Housing in Canada: Key results from the 2016 Census
Archived Content
Information identified as archived is provided for reference, research or recordkeeping purposes. It is not subject to the Government of Canada Web Standards and has not been altered or updated since it was archived. Please "contact us" to request a format other than those available.
Released: 2017-10-25
Housing in Canada: Key results from the 2016 Census
The housing landscape in Canada has changed over the past decade, against a backdrop of record low interest rates since the 2008-2009 recession, increased construction of condominiums, and rising home prices.
Having a home affects almost every aspect of life. As such, housing data are important to informing a number of policies at all levels of government which are aimed at helping Canadians access safe, adequate and affordable housing.
This census release describes key housing indicators, such as the rate of homeownership, the share of households living in condominiums and the share of households living in shelter not considered affordable.
Rate of homeownership relatively stable since 2006, compared with a steady increase from 1991 to 2006
The decision to own or rent one's home is one of the most important decisions for a household. It affects household finances, the ease with which people can relocate, the choice of location and type of dwelling, and other important factors related to how people live.
More than 9.5 million of the 14.1 million households in Canada owned their home in 2016, representing a homeownership rate of 67.8%. The rate of homeownership has been relatively stable over the last decade. In 2006, the rate was 68.4% and in 2011 it was 69.0%. In contrast, over the period 1991 to 2006, the homeownership rate rose from 62.6% to 68.4%.
Many factors contribute to trends in homeownership, including demographics, the size of the housing stock; availability and cost of alternatives to homeownership; interest rates and access to financing; and the preferences and needs of Canadians.
The sustained growth in homeownership prior to 2006 was related, in large part, to baby boomers—the demographically significant generation born from 1946 to 1965—entering homeownership. By 2016, most baby boomers were already homeowners and no longer driving an increase. Future trends will be affected by how long baby boomers remain homeowners and whether younger generations own or rent a home.
Homeownership rates highest in Atlantic Canada
The Atlantic provinces had the highest homeownership rates in Canada in 2016. Newfoundland and Labrador ranked first with a homeownership rate of 76.7%, well above the national average of 67.8%.
Quebec and the territories had homeownership rates below the national average. Homeownership has historically been low in Quebec, and at 61.3% in 2016, it was the lowest rate among the provinces. Nunavut, at 20.0%, had the lowest rate in the country, among both provinces and territories.
Over the last decade, homeownership rates declined in the Atlantic provinces, Ontario, British Columbia and Nunavut, while they increased in Quebec and the Northwest Territories.
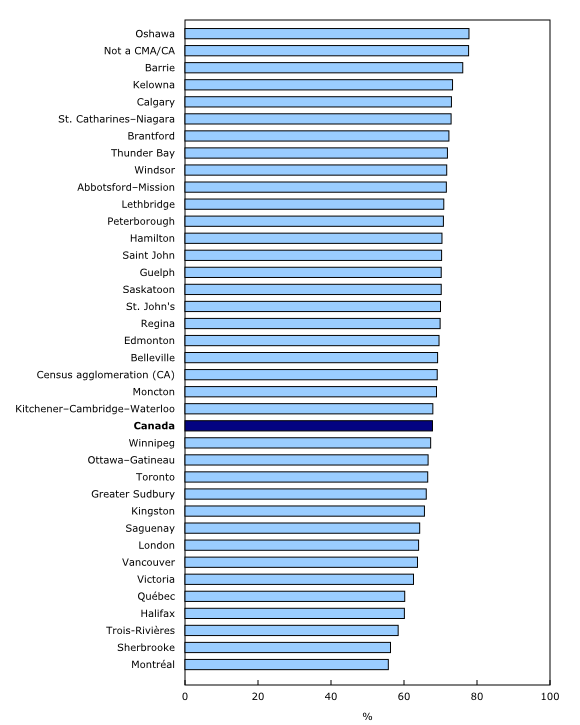
Among census metropolitan areas, homeownership rate highest in Oshawa and Barrie, lowest in Montréal and Sherbrooke
Homeownership rates varied among the largest urban centres (census metropolitan areas or CMAs). In Toronto, the homeownership rate was near the national average, at 66.5%. Vancouver was slightly lower at 63.7%. Calgary, Canada's fastest growing CMA between 2011 and 2016, had a homeownership rate of 73.0%, well above the national average.
Homeownership rates were lower than the national average in all CMAs in Quebec. In 2016, Montreal (55.7%) and Sherbrooke (56.3%) had the lowest homeownership rates among CMAs in Canada. Oshawa (77.8%) and Barrie (76.1%), on the other hand, stood out as CMAs with homeownership rates well above the national average.
Homeownership was also much higher outside of metropolitan areas. In 2016, 77.7% of households outside of census metropolitan and census agglomeration areas were home owners.
Seniors were more likely to own their homes in 2016 than they were a decade earlier
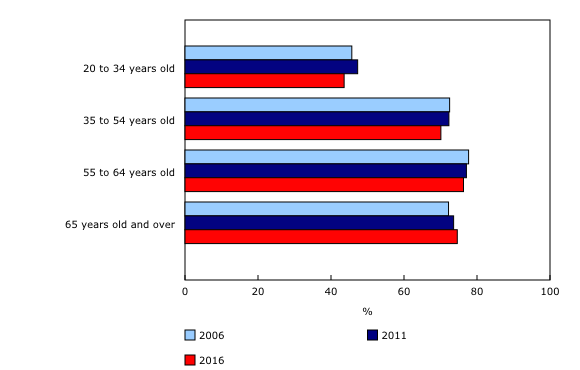
Homeownership is strongly related to age. The homeownership rate was 43.6% among 20- to 34-year olds in 2016. This compares with 70.1% for persons aged 35-54. The homeownership rate was highest at 76.3% for 55-64 year olds, and was slightly lower, at 74.6% for the population aged 65 and over.
Seniors were more likely to own their homes in 2016 than they were a decade earlier. The homeownership rate among the population aged 65 and over was 74.6% in 2016, compared to 72.2% in 2006. Conversely, persons younger than 65 were less likely to own their homes in 2016 than in 2006.
Millennials have a lower homeownership rate than baby boomers at the age of 30
For many years, baby boomers (because of their demographic weight) were driving changes in homeownership rates across Canada. But this is different for younger generations.Younger adults aged 20 to 34—those often referred to as the millennial generation— are slower to get into the housing market than was the case for the baby boomers at that age.
To demonstrate this, one can compare homeownership rates of baby boomers at age 30 in 1981, with millennials aged 30 in 2016. At the age of 30, among millennials who lived in their own home, just over half (50.2%) were owners in 2016, compared with 55.5% of boomers in 1981.
Decisions about renting or owning a home often coincide with household formation decisions such as moving out of the parental home or establishing a home with another person. Many other factors, such as shelter costs, are also involved. Nevertheless, the lower rate of homeownership of millennials, compared with boomers when they were at the same age, is consistent with other generational differences.
For instance, one-third of young adults aged 20 to 34 lived with their parents in 2016, a share that has been increasing since 2001. A closer look at this trend can be found in the August 2, 2017 census release, "Young adults living with their parents in Canada in 2016".
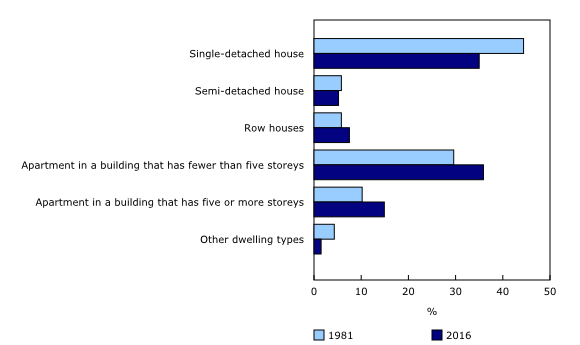
There is also a generational difference in the types of dwellings in which young adults live. In 1981, 44.4% of baby boomers lived in a single-detached home compared with a rate of 35.0% for millennials in 2016. Young adults in 2016 were also more likely to live in apartments than their 1981 counterparts. This is one example of how the housing landscape has changed across generations because of housing trends such as urbanization and increased apartment building construction.
Condominiums on the rise
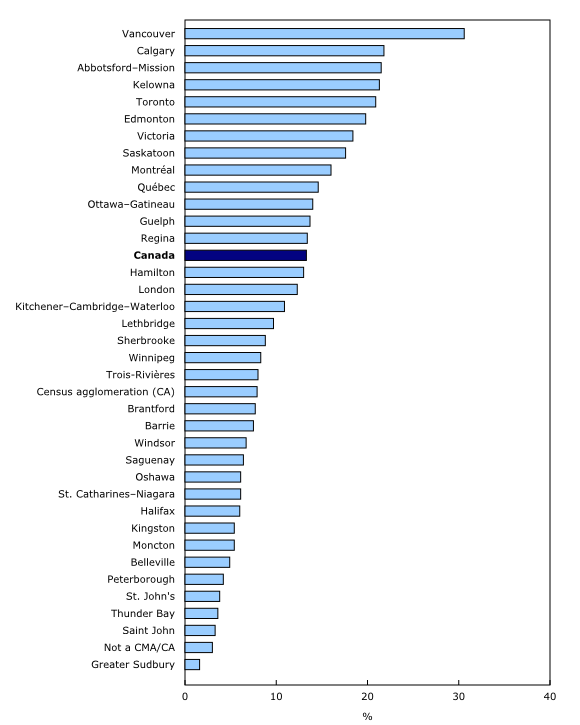
In 2016, 13.3%, or almost 1.9 million households, were living in condominiums, up 1.2 percentage points from 2011. Of these households, almost 1.3 million (67.1%) were owners, while 616,570 (32.9%) were renters.
The share of households living in condominiums varied among census metropolitan areas (CMAs) in 2016. Vancouver (30.6%) had the highest proportion of households living in condominiums, surpassing second-place Calgary (21.8%) by a wide margin. Abbotsford-Mission (21.5%), Kelowna (21.3%), and Toronto (20.9%) also had rates of over one in five households living in a condominium.
Condominiums were a lesser presence in certain other CMAs. Greater Sudbury (1.6%), Saint John (3.3%), Thunder Bay (3.6%), St. Johns (3.8%), Peterborough (4.2%) and Belleville (4.9%) had fewer than 1 in 20 households living in a condominium.
Shelter costs and affordability
Being able to afford monthly shelter cost payments ensures people have a roof over their head. In 1986, the Canada Mortgage and Housing Corporation and the provinces agreed to assess housing affordability against a threshold based on whether the household spent 30% or more of its average monthly total income on shelter costs. For this purpose, shelter costs include mortgage payments, rent, the cost of electricity, heat, water and other municipal services, property taxes, and condominiums fees.
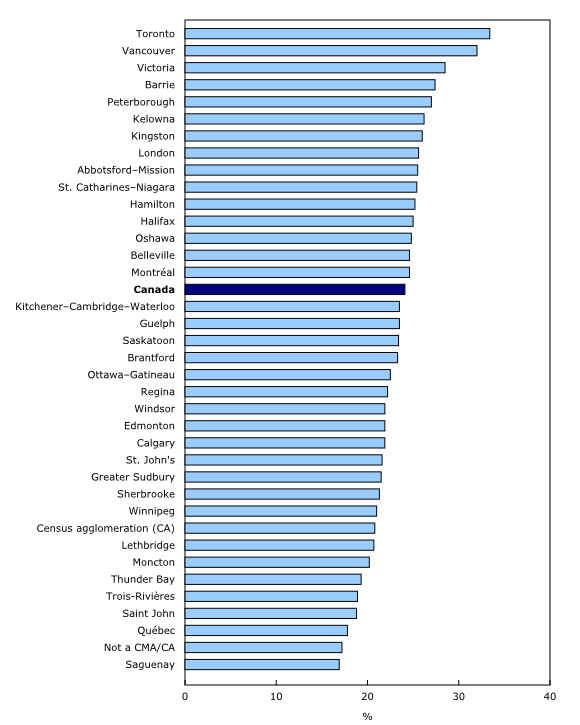
The proportion of households with monthly shelter costs considered not affordable was 24.1% in 2016, compared with 24.4% in 2006.
Among census metropolitan areas in 2016, Toronto (33.4%) and Vancouver (32.0%) had the highest proportion of households that paid 30% or more of their total income on shelter costs. Saguenay (16.9%) and Québec (17.8%) had the lowest proportions of households living in dwellings with shelter costs that were not considered affordable.
Homeowner-estimated dwelling values
Dwelling values, as estimated by occupying homeowners, varied among Canada's census metropolitan areas. In May 2016, Vancouver homeowners reported, on average, the estimated value of their dwellings to be $1,005,920, compared with $734,924 in Toronto and $366,974 in Montreal.
Canada-wide, the average value in 2016 was $443,058. In current dollars (not adjusted for inflation), in 2011, the average owner-estimated dwelling value was $345,182.

In celebration of the country's 150th birthday, Statistics Canada is presenting snapshots from our rich statistical history.
The homes of Canadians and housing statistics have evolved over time. The housing questions in the census have also changed to reflect information needs stemming from changes in housing policy and to better capture the changing portrait of housing in Canada. For example, in the 1980s, the Canada Mortgage and Housing Corporation and the provinces agreed upon and developed housing need indicators, such as what was considered affordable. Changes to the housing questions provided the necessary information for governments to be able to use the census as a key source for tracking the housing needs of Canadians.
In 1871, in the first census after Confederation, 3.5 million Canadians lived in approximately 600,000 dwellings. The value of a home built at that time was about $2,300 (or around $70,000 in today's dollars). The 2016 Census showed that 35.2 million Canadians lived in 14.1 million households and that the average value of an owner-occupied dwelling was about $440,000. This is an example of how housing has evolved in both value and the average number of people per dwelling.
As the housing of Canadians has changed, so too have the statistics that the census collects to reflect these changes. A question on whether a household owns or rents first appeared in the 1921 Census and showed that 61.9% of households owned their home. Housing conditions were measured by the presence of certain features, an approach which was first captured in detail in the 1941 Census. Information was collected on the presence of a refrigerator, a stove (including the number of cooking rings), toilet facilities, and other housing features. As these features became ubiquitous and expectations increased, these questions disappeared. By the 1981 Census, housing conditions were measured through the need for repairs to a dwelling. In addition, detailed questions on housing costs made their debut in the 1971 Census, allowing for the analysis of the affordability of housing.
Note to readers
Definitions
This data release on housing includes households in private occupied dwellings, referred as 'households'. Those living in collective dwellings, such as rooming houses, seniors' residences, nursing homes or jails, are not included. In 2016, there were 14,072,080 households in Canada.
Household characteristics refer to characteristics of the person or group of persons occupying the private dwelling. Household characteristics collected for the 2016 Census of Population that are commonly used in housing analysis include tenure, household size, household total income and household type. Household characteristics were collected for all private households. Information was also collected for the 2016 Census of Population to identify the household maintainers, that is, which household members paid the shelter costs. A common approach in housing analysis is to examine the characteristics of the primary household maintainer (such as age) in relation to dwelling characteristics, shelter costs and other household characteristics.
The owner estimated value refers to the dollar amount expected by the owner if the asset were to be sold.
Please refer to the Dictionary, Census of Population, 2016, Catalogue no. 98-301-X, for additional information on the census variables.
2016 Census of Population products and releases
Statistics Canada is releasing a fifth set of results from the 2016 Census. These results are on housing for the Canadian population at the national, provincial, territorial and subprovincial levels in 2016. Results on immigration and ethnocultural diversity and Aboriginal peoples are also being released today.
Several 2016 Census products are also now available on the Census Program web module. This module has been designed to provide easy access to census data, free of charge. Information is organized into broad categories, including analytical products, data products, reference materials, geography and a video centre.
The Analytical products include this Daily article, while Data products include the housing results for a wide range of standard geographic areas, available through the Census Profile, Data tables and Highlight tables.
In addition, the Focus on Geography Series provides data and highlights on key topics found in this Daily release at various levels of geography.
Reference materials contain information to help understand census data. They include the Guide to the Census of Population, 2016, which summarizes key aspects of the census, as well as response rates and other data quality information. They also include the Dictionary, Census of Population, 2016, which defines census concepts and variables, and the Housing Reference Guide, which explains census concepts and changes made to the 2016 Census. This reference guide also includes information about data quality and historical comparability, and comparisons with other data sources. Both the Dictionary and the Guide to the Census of Population are updated with additional information throughout the release cycle.
Geography-related 2016 Census Program products and services can be found under Geography. These include GeoSearch, an interactive mapping tool.
An infographic on Condominiums in Canada illustrates some key findings for Canada.
Information on the housing conditions of Aboriginal people is available in the article, "The housing conditions of Aboriginal people in Canada," part of the Census in Brief series.
The public is also invited to chat with an expert about this release on Monday October 30, 2017 from 12:30 to 1:30 p.m., Eastern Time.
Over the coming months, Statistics Canada will continue to release results from the 2016 Census of Population, and provide an even more comprehensive picture of the Canadian population. Please see the 2016 Census Program release schedule to find out when data and analysis on the different topics will be released throughout 2017 and consult regularly the Census Program web module for the release of additional products.
Contact information
For more information, or to enquire about the concepts, methods or data quality of this release, contact us (toll-free 1-800-263-1136; 514-283-8300; STATCAN.infostats-infostats.STATCAN@canada.ca) or Media Relations (613-951-4636; STATCAN.mediahotline-ligneinfomedias.STATCAN@canada.ca).
- Date modified:


