2016 Census of Agriculture
Archived Content
Information identified as archived is provided for reference, research or recordkeeping purposes. It is not subject to the Government of Canada Web Standards and has not been altered or updated since it was archived. Please "contact us" to request a format other than those available.
Released: 2017-05-10
Farm operators are slightly older and there are fewer farms in Canada than in 2011, but farms are on average larger and more area is devoted to crop production according to the results from the 2016 Census of Agriculture.
Over the next six weeks, articles digging deeper into different aspects of Canadian agriculture will be published with further analysis of census results.
Agricultural data has been collected in Canada since 1666 and 2016 marks the 22nd Census of Agriculture since Confederation. The census paints a sweeping picture of the agricultural sector. It tracks changes in crops and livestock, as well as the evolution of farming practices and mechanization, from the power of horses to horsepower. Canadian farmers have continually taken advantage of technological advances to more efficiently deliver a wider variety of agricultural products to Canadians and the world.
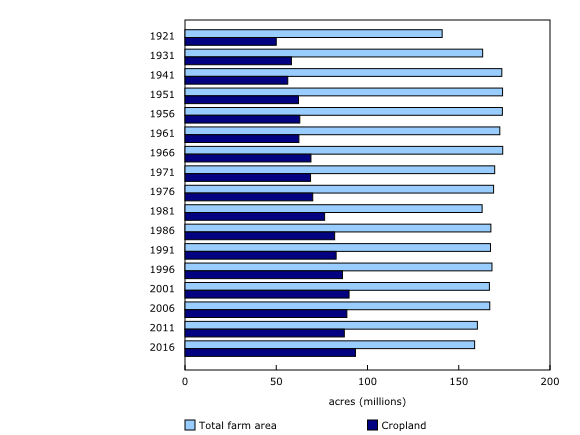
While total farm area edged down from 2011, the area dedicated to cropland rose to 93.4 million acres in 2016. Although urbanization may reduce cropland available in some areas, a net increase in cropland is attributable to a shift in land use. Farmers have converted land formerly used as pasture, summerfallow or other less productive land into productive area. Canola remains the biggest crop, accounting for more than one-fifth of all cropland.
The number of farm operators declined from 2011 while the average age continued to rise. However, the proportion of operators under 35 years of age edged up for the first time since 1991. Despite the increase in the average age, only 1 in 12 operations reported having a formal succession plan laying out how the operation will be transferred to the next generation of farmers.
Primary agriculture accounted for 1.5% of national gross domestic product (agricultural gross domestic product) in 2013. However, this percentage rises to 4.6% when agricultural input and service providers, primary producers, food and beverage processors, agriculture food retail and wholesale industries are taken into account (Statistics Canada. 2013. Special tabulation, based on 2013 gross domestic product by industry).
Agricultural operations in Canada employed 280,315 people in 2015. From a trade perspective, agricultural goods accounted for 2.2% of Canada's total imports and 4.6% of total exports (CANSIM table 228-0059, accessed April 13, 2017). In terms of value, almost one-third of Canadian agricultural production was exported in 2013 (CANSIM table 381-0033,accessed April 13, 2017).
There are fewer farms, but the farms are larger
The results of the 2016 Census of Agriculture show that the agriculture industry continues to consolidate. There were 193,492 farms counted in 2016, down 5.9% from the previous census in 2011. However, this was the lowest rate of decline in 20 years.
While farm numbers have declined, the average area per farm increased from 779 acres in 2011 to an average of 820 acres in 2016.
The area dedicated to cropland rose 6.9% from 2011 to 93.4 million acres (Chart 2) in 2016, as land that was flooded during the 2011 Census was brought back into production, use of summerfallow decreased and marginal land was converted into productive cropland.
Younger operators and women make up a larger share of farmers
The 2016 Census of Agriculture counted 271,935 farm operators on agricultural operations, down from 293,925 in 2011. Farm operators under 35 years of age accounted for an increasing share of total operators and their absolute numbers also rose—from 24,120 in 2011 to 24,850 in 2016. This was the first absolute increase in this category of operators since 1991.
However, the fastest growing age group was farm operators aged 55 years and older (Table 1). The average age of operators—individuals who make management decisions for the agricultural enterprise—edged up from 54.0 years in 2011 to 55.0 years in 2016. This trend parallels the ageing of the general population. Among Canadians aged 15 to 64, the share of people aged 55 to 64 years old (all baby boomers) reached a record high 21.0% in 2016 (Statistics Canada. 2017. Recent trends for the population aged 15 to 64 in Canada. Statistics Canada Catalogue no. 98-200-X2016003, accessed May 3, 2017).
Women account for an increasing share of farm operators, rising from 27.4% in 2011 to 28.7% in 2016. In the 2016 Census of Agriculture, 77,970 women were listed as farm operators. Women were most prevalent among farm operators aged 35 to 54 years (30.7%), followed by those aged 55 and older (27.7%) and those under 35 years of age (26.4%).
Many farm operators also do off-farm work
The 2016 Census of Agriculture found that 44.4% of all farm operators did some off-farm work, usually as a means of supplementing their total income. Just over 3 in 10 (30.2%) operators worked an average of 30 hours a week or more off the farm.
British Columbia had the highest incidence of off-farm work, as well as the highest proportion of farms with total sales under $10,000. Just over half (51.1%) of farm operators in British Columbia reported receiving a wage or salary from another job or operating a business unrelated to the farm.
Corporations more likely to have succession plans
The transfer of agricultural assets as farmers transition out of the sector can happen in a number of ways. Farm assets can be sold in whole or in part and the buyer can be a new entrant or someone looking to expand their existing operation. Farm operations can also be transferred to other parties via a will or written succession plan.
In 2016, 8.4% of farms nationally reported having a written succession plan. Among sole proprietorships, 4.9% had a written succession plan compared with 16.3% of family and non-family corporations.
Just over half (51.7%) of all Canadian farms were sole proprietorships in 2016. Partnerships accounted for 22.9% of farms, while 22.5% were family corporations and 2.7% were non-family corporations. The rate of incorporation among farm operations rose from 19.8% in 2011 to 25.1% in 2016.
More oilseed and grain-type farms
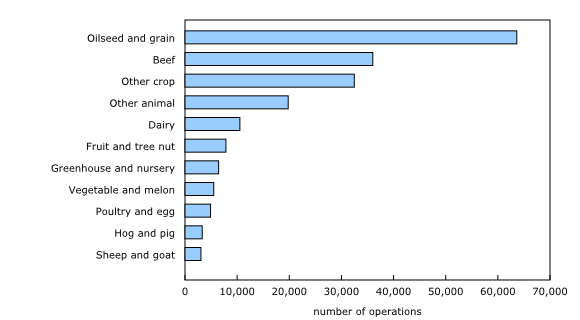
Oilseed and grain-type farms remain the most common type of farm, increasing from 30.0% in 2011 to 32.9% in 2016 (Chart 3). In the Prairie provinces, 46.3% of farms fell into this farm type.
Beef-type farms remain the second most common farm type, accounting for 18.6% of agricultural operations, up slightly from 18.2% in 2011.
Prairie farmers drive gains in field crop area
Total farm area decreased 0.9% from 160.2 million acres in 2011 to 158.7 million acres in 2016. Shifts in tenure were responsible for some of this decline, as rental agreements tend to cover only productive land. The area of cropland increased as farmers cleared, drained and upgraded marginal lands to support crop production, shifted practices to reduce the need for summerfallow, and returned land which had been flooded in 2011 back into production. While cropland grew, woodlands and wetlands as well as pasture decreased.
Farm size varied considerably based on region and farm type. The largest operations on average were found in Saskatchewan (1,784 acres), while the smallest on average were located in Newfoundland and Labrador (174 acres).
Field crop area grew from 69.7 million acres in 2011 to 78.5 million acres in 2016, largely driven by increases in the Prairie provinces. In Manitoba and Saskatchewan, the return of cropland, which had been reported as idle in the last census due to flooding, contributed to the rise in field crop area. Prince Edward Island and New Brunswick were the only provinces to report a decrease in field crop area from 2011 to 2016.
The area of hay and alfalfa cropland declined 16.6% (-2.8 million acres), while the area of pasture decreased 4.4% (-2.2 million acres), due in part to a smaller beef herd. Some of the hay and pasture land was converted to field crop production.
Growing diversity of crops
Farm operators continued to diversify the crops they produce in response to changing market demands and improved crop varieties (Table 2). For example, lentils are now the third-largest crop in Saskatchewan following canola and spring wheat, as market demand increased from foreign buyers. According to the Food and Agriculture Organization of the United Nations, Canada was the largest producer of lentils in the world in 2014.
Meanwhile, there has been an expansion of soybeans, corn for grain and corn for silage in the Prairie provinces, the result of new varieties suitable to the growing conditions of the region. Soybean area in Manitoba more than doubled—from 705,032 acres in 2011 to 1,645,397 acres in 2016. In Central Canada, corn and soybeans remained the largest field crops by area, while fodder crops and potatoes were the largest crop areas in Atlantic Canada.
Livestock sector characterized by exits and consolidation
The beef sector experienced strong international demand for Canadian beef breeding stock from 2011 to 2016, mainly from the United States. Demand was largely driven by the smaller size of the US beef herd from 2010 to 2012 as a result of drought conditions. Increased demand, coupled with limited supply, drove prices to a record high in 2015 (CANSIM table 002-0068, accessed April 25, 2017). Some producers chose to take advantage of higher prices to sell their cattle and focus on other agricultural activities, such as crop production, or opted to leave farming entirely.
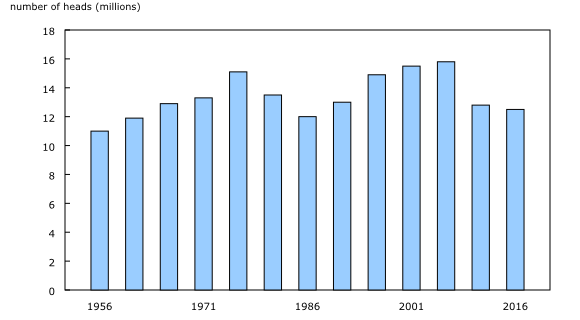
The number of beef cattle decreased 2.4% from 2011 to 6,883,906 heads in 2016, while the number of operations reporting beef cattle declined 12.3% to 62,760. Operations reporting beef cattle had an average of 110 head at the time of the 2016 Census of Agriculture, up 11.3% from 2011.
The beef sector is generally divided in two, with cow-calf operations specializing in raising breeding stock and feedlots specializing in feeding cattle destined for market. The Prairie provinces accounted for just over 80% of the total beef cattle in Canada.
On cow-calf operations, the average beef herd increased from 74 head in 2011 to 84 in 2016. Over the same period, feedlot operations grew on average from 185 head of beef cattle in 2011 to 212 head in 2016.
While the average number of head per farm increased, it was not enough to offset an overall decline in producer numbers. The size of the beef breeding herd (beef cows and beef heifers for breeding herd replacement) fell 1.0%, from 4.5 million animals in 2011 to 4.4 million in 2016. While the 2016 Census marks the second consecutive decrease in the beef breeding herd, the rate of decline slowed from the 22.3% drop reported in the 2011 Census.
Meanwhile, milk production rose 8.7% despite fewer dairy cows (CANSIM table 003-0011, accessed April 13, 2017). Increased production per animal was attributable to improvements in animal nutrition, genetics and production practices.
The average number of dairy cows per farm rose from 65 cows in 2011 to 73 in 2016, a continuation of a long-term upward trend. The number of farms reporting dairy cows decreased 13.4% from 2011 to 12,895 in 2016. The total number of dairy cows fell 2.4% to 939,071 head as farm operations consolidated.
Pig numbers rose from 12.7 million in 2011 to 14.1 million in 2016, while the number of farms reporting pigs increased from 7,371 to 8,402. The growth was due to better market conditions, which boosted the price of pigs relative to the period before the last census. Prior to the 2011 Census of Agriculture, the pig sector was beset by high feed costs, disease and low pig prices, resulting in many farmers leaving the sector and lower pig numbers (CANSIM table 002-0068, accessed April 25, 2017).
The number of farms reporting hens and chickens increased 15.8% from 2011 to 23,910 in 2016. Meanwhile, the number of birds rose from 133.0 million to 145.5 million.
Blueberries, cranberries, and greenhouse veggies bright spots in the horticulture sector
Fruits, berries, and nuts acreage rose 6.7% from 2011, mainly due to blueberries and cranberries. Blueberry area continued to expand in Quebec and Atlantic Canada (principally areas of managed lowbush blueberries) and in British Columbia (where highbush blueberries dominate). Nationally, blueberry area has consistently increased over the past several censuses and now stands at 196,026 acres.
The increase in blueberry area was largely driven by growing international demand. Canada exported 94.8 million kilograms of frozen blueberries in 2016, up 33.7% from 2011. Meanwhile, exports of fresh blueberries rose 84.4% to 37.1 million kilograms. The United States remains Canada's top destination for both fresh and frozen blueberries. Total blueberry exports to the United States increased 86.0% from 2011 and the United States accounted for 71.0% of total blueberry exports in 2016, up from 55.3% in 2011 (Statistics Canada. 2017. Special tabulation, based on World Trade Atlas Database, accessed April 13, 2017).
Cranberry area increased from 15,191 acres in 2011 to 18,134 acres in 2016. Exports of fresh cranberries also increased, rising 77.6% from 2011 to 63.5 million kilograms in 2016 (Statistics Canada. 2017. Special tabulation, based on World Trade Atlas Database, accessed April 13, 2017). Both blueberries and cranberries are amenable to mechanized harvesting, allowing operators to increase the scale of their operation with a minimal increase in the number of employees.
In contrast to blueberries and cranberries, the area of strawberries and raspberries declined as the commodities faced disease outbreaks as well as labour and market challenges. Raspberry area fell 23.7% from 2011 to 5,651 acres in 2016, while strawberry area decreased 8.4% to 10,155 acres.
Apple orchard area continued to decline, with the largest decreases in Nova Scotia and Quebec. Overall, the total acres dedicated to apple production fell 3.2% from 2011 to 43,631 acres in 2016. While area of production declined, the area is used more intensively. For example, the yield of apples in Canada increased from 7.2 tons per acre in 1996 to 10.0 tons per acre in 2016 (CANSIM table 001-0009 accessed April 13, 2017).
Greenhouse vegetable area rose 22.5% from 2011 to 165.4 million square feet in 2016. Ontario continued to lead the provinces, accounting for more than two-thirds of all greenhouse vegetable area. From 2011 to 2016, Ontario saw almost no change in the number of operations in the province, but a 29.8% increase in the area dedicated to greenhouse vegetables. Over this period, Ontario added 25.7 million square feet—more than the total area of greenhouse vegetable production in every other province combined except British Columbia.
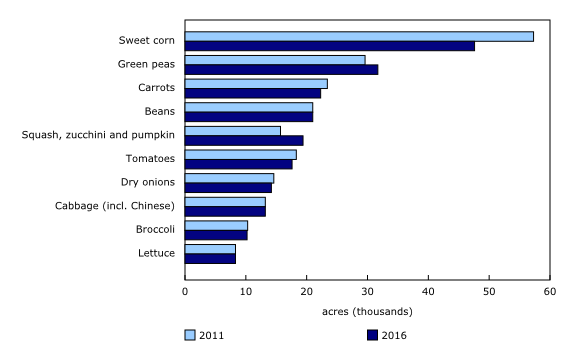
The number of farms reporting field vegetables rose 10.3% from 2011 to 9,994 in 2016. However, most of the new farms reporting vegetables were small. Total field vegetable area in Canada increased 1.0% to 270,294. Despite a 16.9% decrease in sweet corn area since 2011, sweet corn remained the largest vegetable crop area in 2016.
Less nursery, Christmas tree and sod area
Nursery operations reported 17.8% less area in 2016 (49,073 acres) from five years earlier, while Christmas tree area declined 16.0% to 58,780 acres and sod area fell 10.6% to 56,719 acres. Lower sod and nursery area were driven by a shift away from the construction of single-detached dwellings in favour of multi-dwelling type buildings (CANSIM table 027-0001, accessed April 13, 2017), and a move away from traditional landscaping practices towards hardscaping. The decline in Christmas tree area was a result of increased demand for artificial Christmas trees (Statistics Canada. 2017. Special tabulation, based on World Trade Atlas Database, accessed April 13, 2017).
One in eight farms sold food directly to consumers
In 2016, 12.7% of farms reported that they sold directly to consumers. Of the 24,510 farms that were marketing directly to consumers, 96.1% sold unprocessed products such as fruits and eggs, while 14.4% sold value-added products like wine and cheese. Fruit and vegetable combination type farms (79.8%) were most likely to sell directly to consumers.
Farmers harvest the sun for more than growing crops
In 2016, 5.3% of farms reported having a renewable energy-producing system on their operation. Of these farms, 85.0% had solar panels while 15.7% reported wind turbines. Ontario had the highest percentage of farms with renewable energy-producing systems on their operation at 10.4%. Of the 5,180 farms with renewable energy-producing systems in Ontario, 85.5% had solar panels and 17.5% had wind turbines. Prince Edward Island had the second-highest percentage of farms with renewable energy-producing systems at 5.8%, and had the highest percentage of farms reporting renewable energy with wind turbines at 42.3%.
Bigger, more valuable tractors
Farmers continued to report larger and more expensive equipment, in line with the growth in average farm area. The number of tractors over 149 power take off horsepower (p.t.o hp) rose from 85,681 in 2011 to 104,990 in 2016, while their value increased 50.0% (in 2016 constant dollars) to $9.4 billion dollars. The number of tractors smaller than 149 p.t.o hp fell from 600,233 to 546,276 over the same period.
The total value of farm machinery and equipment owned and leased by agricultural operations increased 15.4% (in 2016 constant dollars) to $53.9 billion.
Larger and more valuable farms
The value of land and buildings used by agricultural operations increased 37.5%, from $311.2 billion in 2011 to $427.9 billion (in 2016 constant dollars) in 2016. Land and building values varied across the country, ranging from an average of $1,210 per acre in Saskatchewan to $9,580 per acre in Ontario. The national average value for land and buildings on farms was $2,696 per acre.
Farm profits unchanged from 2010
Gross farm receipts totalled $69.4 billion in 2015, while operating expenses reached $57.5 billion. On average, for every dollar in gross farm receipts, farms incurred 83 cents in expenses in 2015 for an expense-to-receipt ratio of 0.83. Rounded to the nearest cent, the ratio was unchanged from 2010. The stability in the expense-to-receipt ratio indicates that farms were as profitable in 2015 at the national level as they were in 2010.
However, the expense-to-receipt ratio varied across regions and farm types. In 2015, those operations typed as dairy had the most favourable ratio (0.77), despite a deterioration from 0.73 in 2010. Farms typed as sheep and goat, which had the least favourable ratio in 2010 at 1.01, improved to 0.96 in 2015 (Table 3).

As we celebrate Canada's 150th birthday, we take a look back at the evolution of Canadian farming since Confederation.
Canadian agriculture has grown with the country
Total farm sales reached $69.4 billion in 2015, as Canada remains one of the world leading exporters of agriculture products. Farms continued to grow in size, with average farm area reaching 820 acres per farm in 2016, eight times larger than in 1871. At the end of the 19th century, when a dozen eggs cost 26 cents and a loaf of bread cost 4 cents (Bank of Canada, 2005, A History of the Canadian Dollar), the average farm made $714 (current dollars) annually, compared with an average of $358,503 per farm in 2015.
Growth has been possible due to the ongoing shift towards increasing industrialization, mechanization and specialization in the agriculture sector. The use of technology and equipment has allowed farms to be more efficient, with increased precision and automation. The average value of machinery and equipment reached $278,405 per farm in 2016, compared with $213 (current dollars) per farm in 1901. As part of this shift there are now fewer horses reported on agricultural operations, with nearly three times more horses reported in 1871 than in 2016.
Note to readers
Definitions
Total farm area
Total farm area, which is land owned or operated by an agricultural operation, includes: cropland, summerfallow, improved and unimproved pasture, woodlands and wetlands, all other land (including idle land and land on which farm buildings are located).
Expense-to-receipt ratio
The expense-to-receipt ratio is the average amount of operating expenses incurred for a dollar in farm receipts. The ratio is calculated in current dollars.
Price indices were used to obtain constant dollar estimates of receipts, expenditures and capital values in order to eliminate the impact of price changes in year-to-year comparison.
Census Day was May 10, 2016. Farmers were asked to report their receipts and expenses for the last complete fiscal or calendar year (2015).
Census farm
An operation is considered a census farm (agricultural operation) if it produces at least one of the following products intended for sale: crops (hay, field crops, tree fruits or nuts, berries or grapes, vegetables, seed); livestock (cattle, pigs, sheep, horses, game animals, other livestock); poultry (hens, chickens, turkeys, chicks, game birds, other poultry); animal products (milk or cream, eggs, wool, furs, meat); and other agricultural products (Christmas trees, sod, greenhouse or nursery products, mushrooms, honey or bees, maple syrup and its products).
The data for Yukon and the Northwest Territories are not included in the national totals because of the different definition of an agricultural operation in the territories and confidentiality constraints. The data for Yukon and the Northwest Territories are presented separately.
Farm type
Farm type is established through a procedure that classifies each census farm according to the predominant type of production. This is done by estimating the potential receipts from the inventories of crops and livestock reported on the questionnaire and determining the product or group of products that make up the majority of the estimated receipts. For example, a census farm with total potential receipts of 60% from hogs, 20% from beef cattle and 20% from wheat, would be classified as a hog and pig farm. The farm types presented in this document are derived based on the 2012 North American Industrial Classification System (NAICS).
Power take off horsepower (p.t.o hp)
This is the measure of the power available from a tractor engine to drive implements.
Gross farm receipts
The Census of Agriculture measures gross farm receipts for the calendar or accounting year prior to the census.
Gross farm receipts (before deducting expenses) in this analysis include: receipts from all agricultural products sold, and program payments and custom work receipts.
The following are not included in gross farm receipts: sales of forestry products (for example: firewood, pulpwood, logs, fence posts and pilings); sales of capital items (for example: quota, land, machinery); and receipts from the sale of any goods purchased only for retail sales.
Total operating expenses
The Census of Agriculture measures operating expenses for the calendar or accounting year prior to the census.
Total operating expenses includes any expense associated with producing agricultural products (such as the cost of seed, feed, fuel, fertilizers).
The following are not included in total operating expenses: the purchase of land, buildings or equipment, and depreciation or capital cost allowance. Depreciation represents economic "wear and tear" expense. Capital cost allowance represents the amount of depreciation written off by the tax filer as allowed by tax regulations.
2010 to 2015
Some data refer to a reference period other than Census Day. For example, for financial data the reference period is the calendar or accounting (fiscal) year prior to the census.
Farm operator
According to the census, a farm operator is any person responsible for the management decisions made for an agricultural operation as of May 10, 2016.
Contact information
For more information, or to enquire about the concepts, methods or data quality of this release, contact us (toll-free 1-800-263-1136; 514-283-8300; STATCAN.infostats-infostats.STATCAN@canada.ca) or Media Relations (613-951-4636; STATCAN.mediahotline-ligneinfomedias.STATCAN@canada.ca).
- Date modified:


