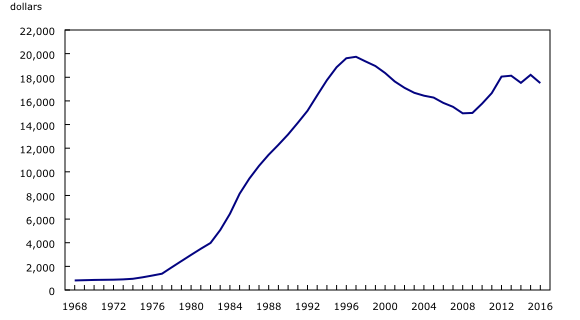
Chart 2
Federal net debt per capita, 1968 to 2016
Chart description
This is a line chart.
| dollars | |
|---|---|
| 1968 | 810 |
| 1969 | 830 |
| 1970 | 852 |
| 1971 | 863 |
| 1972 | 873 |
| 1973 | 898 |
| 1974 | 950 |
| 1975 | 1,075 |
| 1976 | 1,223 |
| 1977 | 1,379 |
| 1978 | 1,918 |
| 1979 | 2,447 |
| 1980 | 2,971 |
| 1981 | 3,488 |
| 1982 | 3,977 |
| 1983 | 5,071 |
| 1984 | 6,442 |
| 1985 | 8,143 |
| 1986 | 9,422 |
| 1987 | 10,504 |
| 1988 | 11,449 |
| 1989 | 12,285 |
| 1990 | 13,165 |
| 1991 | 14,146 |
| 1992 | 15,164 |
| 1993 | 16,470 |
| 1994 | 17,754 |
| 1995 | 18,852 |
| 1996 | 19,608 |
| 1997 | 19,733 |
| 1998 | 19,334 |
| 1999 | 18,950 |
| 2000 | 18,361 |
| 2001 | 17,641 |
| 2002 | 17,108 |
| 2003 | 16,688 |
| 2004 | 16,444 |
| 2005 | 16,283 |
| 2006 | 15,833 |
| 2007 | 15,499 |
| 2008 | 14,951 |
| 2009 | 14,981 |
| 2010 | 15,771 |
| 2011 | 16,666 |
| 2012 | 18,056 |
| 2013 | 18,133 |
| 2014 | 17,528 |
| 2015 | 18,207 |
| 2016 | 17,508 |
- Date modified:
