Chart 1
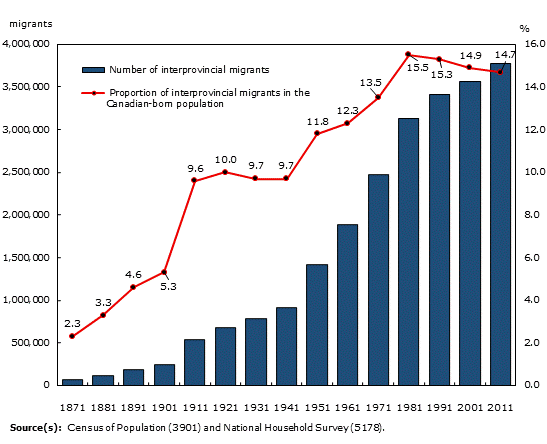
Canadians living in a province/territory other than their province/territory of birth, number and percentage of the population born in Canada, 1871 to 2011

Chart description
The title of the graph is "Canadians living in a province/territory other than their province/territory of birth, number and percentage of the population born in Canada, 1871 to 2011
."
This is a combined line chart.
There are in total 15 categories in the horizontal axis. The primary vertical axis starts at 0 and ends at 4,000,000 with ticks every 500,000 points. The secondary vertical axis starts at 0 and ends at 16 with ticks every 2 points.
There are 2 series in this graph.
The horizontal axis is "Source(s): Census of Population (3901) and National Household Survey (5178).."
The title of series 1 is " Number of interprovincial migrants."
This series is a column clustered chart.
The vertical axis is "migrants."
The minimum value is 68,060 and it corresponds to " 1871."
The maximum value is 3,779,990 and it corresponds to " 2011."
The title of series 2 is " Proportion of interprovincial migrants in the Canadian-born population."
This series is a line markers chart.
The vertical axis is "% ."
The minimum value is 2.3 and it corresponds to " 1871."
The maximum value is 15.5 and it corresponds to " 1981."
| Number of interprovincial migrants | Proportion of interprovincial migrants in the Canadian-born population | |
|---|---|---|
| migrants | % | |
| 1871 | 68,060 | 2.3 |
| 1881 | 121,671 | 3.3 |
| 1891 | 188,241 | 4.6 |
| 1901 | 239,955 | 5.3 |
| 1911 | 537,936 | 9.6 |
| 1921 | 684,157 | 10.0 |
| 1931 | 783,198 | 9.7 |
| 1941 | 915,726 | 9.7 |
| 1951 | 1,412,556 | 11.8 |
| 1961 | 1,892,255 | 12.3 |
| 1971 | 2,470,280 | 13.5 |
| 1981 | 3,128,925 | 15.5 |
| 1991 | 3,416,835 | 15.3 |
| 2001 | 3,563,260 | 14.9 |
| 2011 | 3,779,990 | 14.7 |
- Date modified: