


|
|
| |
Information identified as archived is provided for reference, research or recordkeeping purposes. It is not subject to the Government of Canada Web Standards and has not been altered or updated since it was archived. Please "contact us" to request a format other than those available.

|

Wednesday, April 14, 2004 Canadian international merchandise tradeFebruary 2004Following an unusually weak January for merchandise trade, both exports and imports rebounded sharply for the month of February. Canada's trade surplus in goods jumped by over $600 million to $5.7 billion. 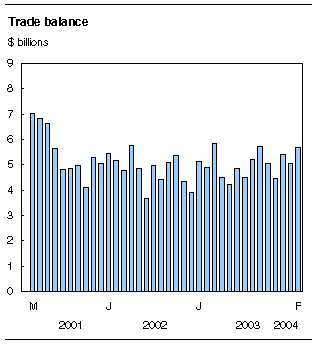
Exporters sent $34.1 billion worldwide in February, up 7.0% from January, which was the lowest level in almost five years. Strong automotive shipments to the United States led the increase. Imports reached $28.4 billion (a 6.1% rise from the previous month) on higher imports of machinery and equipment. The 7.0% export growth to the United States was equal, in percentage terms, to the overall export rise. The United States was also the destination for 81.0% of all export shipments during the month. In turn, Canada purchased just shy of $20 billion from the United States, up 5.8% since January. As a result, Canada's trade surplus with this country soared to just under $8 billion.
Exports increased to all principal trading areas, with the exception of a slight decline to the other OECD countries. Imports increased across the map and Canada's non-US trade deficit widened slightly to $2.3 billion. International merchandise trade has been volatile recently, led in large part by uncertainty in the automotive industry. This sector was influential again in February, being the largest contributor to the export rise. All trade sectors, covering both foreign-bound and incoming goods, registered gains since January. Import and export prices rose only slightly in February, indicating that most of the growth was real or volume related. 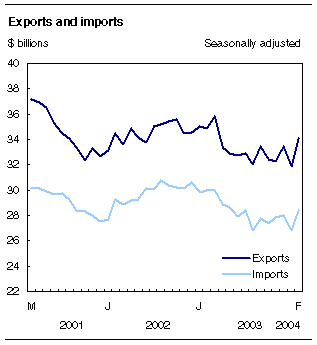
Automotive growth boosts exportsA $350 million surge in truck exports, combined with modest gains in cars and motor vehicle parts led the export growth in February. Automotive reports indicated strong sales for certain vehicles, in contrast to the lackluster performance of the industry over the last few months. High valued scientific and navigational equipment exports, strong furniture shipments to the United States and increases for most commodity areas propelled the machinery and equipment sector to $7.4 billion. The lone decline came in aircraft exports. Exports of industrial goods and materials reached a record high of $6.2 billion, attributable in part to strong international demand and higher prices for metal ore commodities, whose shipments improved 20.0% to $690 million. Zinc and copper showed the largest jumps in February, complemented by higher exports of aluminum, metal-fabricated products and organic chemicals. Much of the growth in forestry exports was price induced, as sustained US housing demand elevated prices for plywood and oriented strand board. Lumber exports ended four months of declines, rising 3.2% to $774 million, the net result of higher prices and lower volumes. Prices also played a role in higher natural gas exports, and combined with volume increases, led to a $200 million rise for the month. Stronger exports of petroleum and coal products also exerted some upward pressure on the energy product sector, while crude petroleum exports dropped 6.9% and prices rose for the fourth straight month. Biggest gain in machinery and equipment imports in a decadeAll import sectors rebounded in February and nearly half of the total increase resulted from the best month since August 1993 for machinery and equipment imports. Aircraft and parts, industrial machinery, televisions and other electronic equipment all contributed to the surge and only a small decline in office machinery imports stood in the way of widespread growth within the sector. Imports of excavating machinery have set record highs for the last two months. Similar to the export pattern, imports of industrial goods and materials resumed their upward trend in February with a 17.3% rebound in metals and metal ores. This followed January's setback, which was partly the result of labour disruptions. A 4.3% rise in motor vehicle parts lifted imports of automotive products by a quarter of a billion dollars. Cars, trucks and other motor vehicles also contributed to the rise in February. Higher imports of motor gasoline, diesel and aviation fuels pushed petroleum and coal products up 22.3%, topping $300 million for the month. Crude petroleum imports grew 4.0% in February, split evenly by volume and price hikes. Available on CANSIM: tables 226-0001, 226-0002, 227-0001, 227-0002, 228-0001 to 228-0003 and 228-0033 to 228-0040. Definitions, data sources and methods: survey numbers, including related surveys, 2201, 2202 and 2203. The February 2004 issue of Canadian International Merchandise Trade, Vol. 58, no. 2 (65-001-XIB, $15/$151) is now available. The publication includes tables by commodity and country on a customs basis. Current account data (which incorporate merchandise trade statistics, service transactions, investment income and transfers) are available quarterly in Canada's Balance of International Payments (67-001-XIB, $29/$93; 67-001-XPB, $38/$124). Merchandise trade data are available in PDF format on the morning of release. Data on Canadian international merchandise trade for March 2004 will be released on May 12. For more information on the publications, contact Jocelyne Elibani (1-800-294-5583; 613-951-9647), International Trade Division. To enquire about the concepts, methods or data quality of this release, contact Matthew MacDonald (613-951-8551), International Trade Division.
| |||||||||||||||||||||||||||||||||||||||||||||||||||||||||||||||||||||||||||||||||||||||||||||||||||||||||||||||||||||||||||||||||||||||||||||||||||||||||||||||||||||||||||||||||||||||||||||||||||||||||||||||||||||||||||||||||||||||||||||||||||||||||||||||||||||||||||||||||||||||||||||||||||||||||||||||||||||||||||||||||||||||||||||||||||||||||||||||||||||||||||||||||||||||||||||||||||||||||

|
|

