Aircraft movement statistics: Major and select small airports, December 2023
Released: 2024-02-29
352,280
December 2023
13.1% 
(12-month change)
Highlights
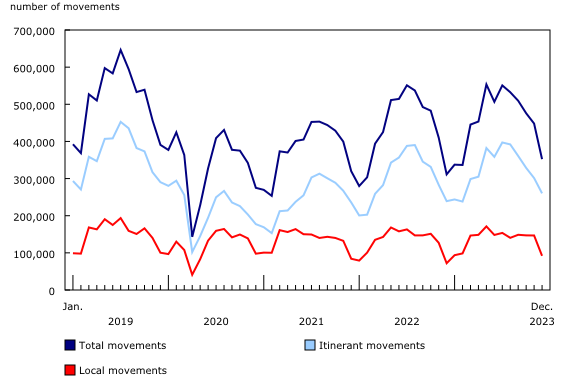
In December, Canada's major and select small airports recorded a total of 352,280 aircraft movements, up 13.1% from December 2022. Itinerant movements rose 8.8% year over year to 260,236, while local movements climbed 27.7% to 92,044.
During 2023, there were a total of 5.5 million aircraft movements at Canada's major and select small airports. This was 5.5% higher than in 2022 and roughly 90% of the movements recorded in 2019.
Increased itinerant movements in all sectors
Aircraft movements were up in all sectors in December 2023, following the winter storms which wreaked havoc on air travel in December 2022. The number of international movements between Canada and countries other than the United States was up 18.1% year over year to 18,422 movements in December 2023, while the number of movements to and from the United States increased 9.7% to 34,125. Total domestic movements (within Canada) were up 7.9% year over year to 207,689 in December.
Of these three sectors, only other international (outside the United States) has surpassed its respective 2019 level.
Movements higher in most provinces and territories
For the second consecutive month, airports in Ontario reported the most aircraft movements with 92,902 in December 2023. All provinces and territories, with the exception of the Northwest Territories and Nova Scotia, reported year-over-year increases in overall traffic. Double-digit percentage change was recorded in Saskatchewan (+46.4%), New Brunswick (+37.8%), Manitoba (+31.4%), Alberta (+22.5%) and British Columbia (+20.2%). Toronto/Lester B. Pearson International remained the busiest airport and recorded the largest year-over-year increase in December (+3,475 movements; +11.8%).
2023: The year of the wildfires
Initially, expectations for continued growth in 2023 were high following the removal of most measures enacted by the Government of Canada in response to the COVID-19 pandemic. Additionally, the strain on airports which provoked cancellations and flight delays was eased with increased employment in the Air Transportation and Support Activities for Air Transportation industries.
By mid-year, wildfires were raging across the country and Natural Resources Canada reported 2023 to be the worst wildfire season in Canada's recorded history. Various levels of government in certain parts of the country declared states of emergency and issued evacuation orders throughout the summer. With the use of aircraft to help combat wildfires, there was increased activity from smaller carriers (Level IV to VI), which includes helicopters and airtankers.
Continued recovery in 2023
There were 5.5 million aircraft movements in 2023, up from 5.2 million (+5.5%) in 2022 and reaching 89.6% of the 2019 level. Itinerant movements increased 6.8% to 3.9 million in 2023, while local movements were up 2.7% to 1.6 million.
Movements in the other international sector rose 22.4% year over year to 183,678 in 2023, while transborder movements (to and from the United States) increased 17.9% to 412,281. Domestic movements were up 4.8% to 3.3 million, propelled by smaller air carriers (Level IV to VI) primarily engaged in increased wildfire and flight school activities.
The 10 busiest airports in Canada all reported year-over-year increases in 2023, with Toronto/Lester B. Pearson International remaining the busiest airport for the second consecutive year. Despite the growth, many of these airports remained below pre-pandemic 2019 levels, specifically those with activities from large air carriers (Level I to III).
Total movements from airports in British Columbia were the highest in Canada, followed by movements from airports in Ontario. These two provinces accounted for more than half of total aircraft movements in 2023.
Did you know we have a mobile app?
Get timely access to data right at your fingertips by downloading the StatsCAN app, available for free on the App Store and on Google Play.
Note to readers
An aircraft movement is defined as a take-off, landing or simulated approach by an aircraft, as defined by NAV CANADA.
Starting with the October 2022 release, the "Aircraft Movement Statistics: Major airports" series has been replaced by "Aircraft Movement Statistics: Major and select small airports." This series collects data on itinerant and local aircraft movements from both major airports (those with towers and flight service stations operated by NAV CANADA), as well as a selection of airports previously available in the small airport data series. This enhancement improves the overall coverage of aircraft movement statistics in Canada.
Data for previous months may have been revised.
The data in this monthly release are not seasonally adjusted.
Contact information
For more information, or to enquire about the concepts, methods or data quality of this release, contact us (toll-free 1-800-263-1136; 514-283-8300; infostats@statcan.gc.ca) or Media Relations (statcan.mediahotline-ligneinfomedias.statcan@statcan.gc.ca).
- Date modified:


