Age and sex, and type of dwelling data: Key results from the 2016 Census
Archived Content
Information identified as archived is provided for reference, research or recordkeeping purposes. It is not subject to the Government of Canada Web Standards and has not been altered or updated since it was archived. Please "contact us" to request a format other than those available.
Released: 2017-05-03
From 2011 to 2016, Canada registered the largest increase in the proportion of seniors since Confederation. This acceleration of population aging is the result of the first baby boomers reaching the age of 65.
Today, Statistics Canada is releasing a second series of data from the 2016 Census on age and sex, and type of dwelling. The agency will release all 2016 Census data in 2017, based on the 2016 Census Program release schedule. These data will provide a detailed and accurate portrait of the lives of Canadians and their communities.
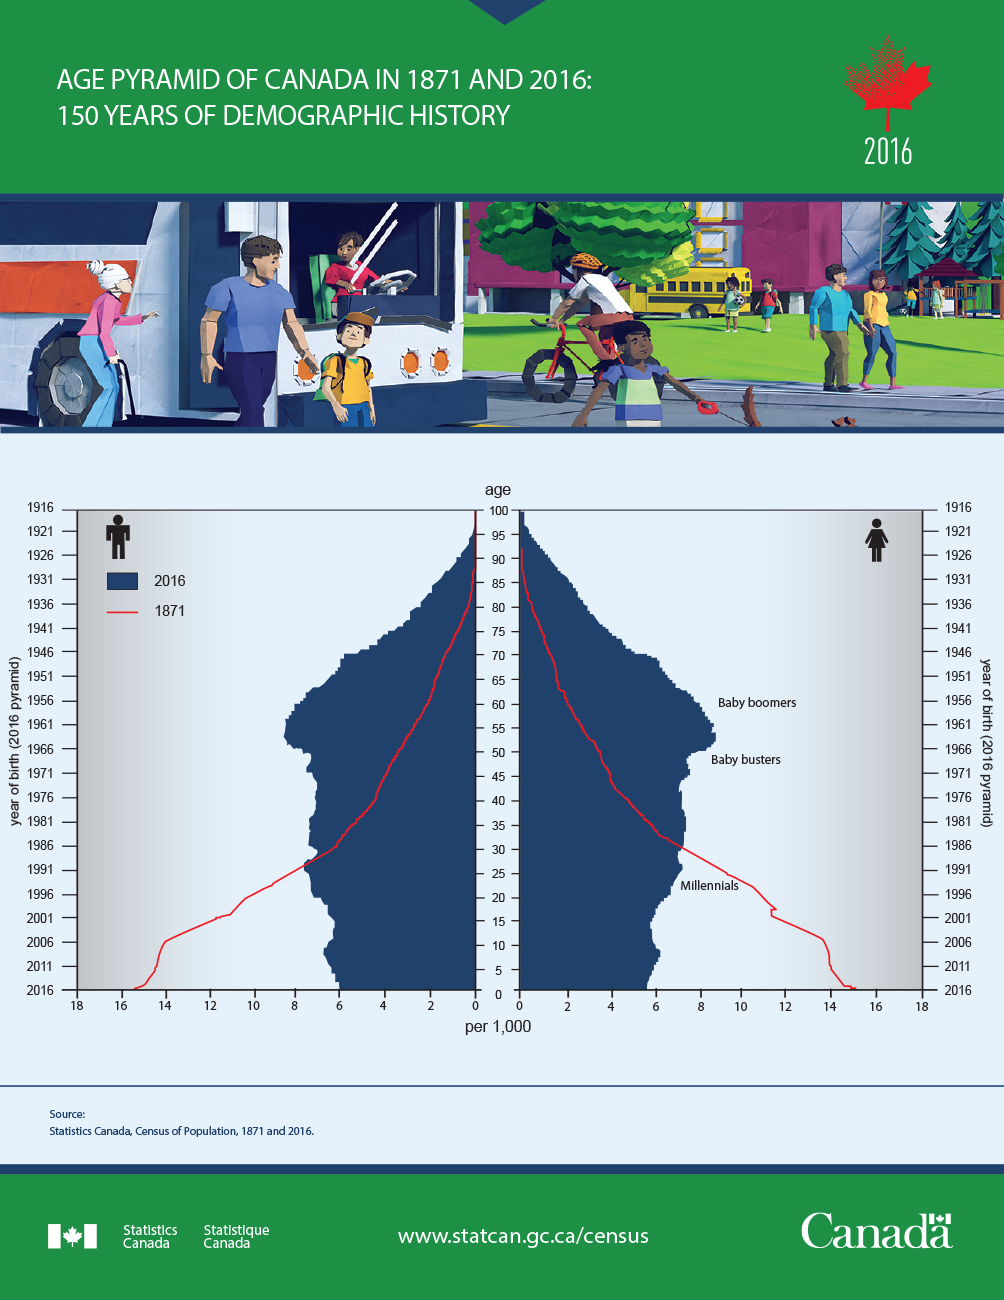
The age-sex composition of Canada's population has changed considerably since 1871, as can be seen in the 1871 and 2016 age pyramids. These pyramids reflect the country's demographic, social and economic history over the past 150 years.
Noteworthy in the 2016 age pyramid is the post-World War II baby boom (1946 to 1965). This is followed by the smaller generations or baby bust of the late 1960s and early 1970s (often called "Generation X"), those aged 15 to 34 (often referred to as "millennials") and the growing number of children aged 5 to 9—due to an increase in the number of births from 2006 to 2011.
Animated age pyramids showing the observed (1851 to 2016) and projected (2017 to 2036) trends related to the age and sex structure for Canada, its provinces and territories are also available on the census web module.
Many aspects of Canadian society are being shaped by the fact that the first baby boomers turned 65 in 2011 and many of them have now left the labour market. More Canadians are receiving an old age pension and are seeking more health care and services. Meanwhile, proportionately fewer people are working and paying income tax. Housing and transportation needs are changing, as is consumption, which is shifting towards goods and services for seniors. The number of families made up of couples whose children have left home is also on the rise.
The 2016 Census age and sex data will be especially helpful for adapting social programs for children, adults and seniors to the new demographic reality.
The provinces and territories, municipalities and private sector also use these data to adapt the direct services required by younger or older populations, such as emergency services, residential and commercial construction, public transit, schools, parks, hospitals and service centres.
This demographic reality is increasingly diversified across the country. Population growth varies greatly from east to west due to various factors (fertility, mortality, and international and internal migration).
Rapid growth in the number of seniors
The first baby boomers turning 65 in 2011 led to the largest increase (+20.0%) in the number of people 65 years of age and older in Canada in 70 years. By comparison, Canada's overall population grew by 5.0% from 2011 to 2016 and the number of children 14 years of age and younger increased by 4.1%.
Other generations also had an influence on the size of age groups. For example, the population aged 40 to 49 decreased from 2011 to 2016, as people who reached these ages (people born in the late 1960s and early 1970s and often referred to as "generation X") are smaller in number than their predecessors, the baby boomers.
Centenarians were the fastest-growing population from 2011 to 2016 (+41.3%). This population has been growing rapidly for many years, mainly due to the gradual increase in life expectancy.
Other analyses on the populations aged 15 to 64 and 85 and older are available in the publications Recent trends for the population aged 15 to 64 in Canada and A portrait of the population aged 85 and older in 2016 in Canada, under the Census in Brief series.
A generational shift in Canada: More seniors now than children
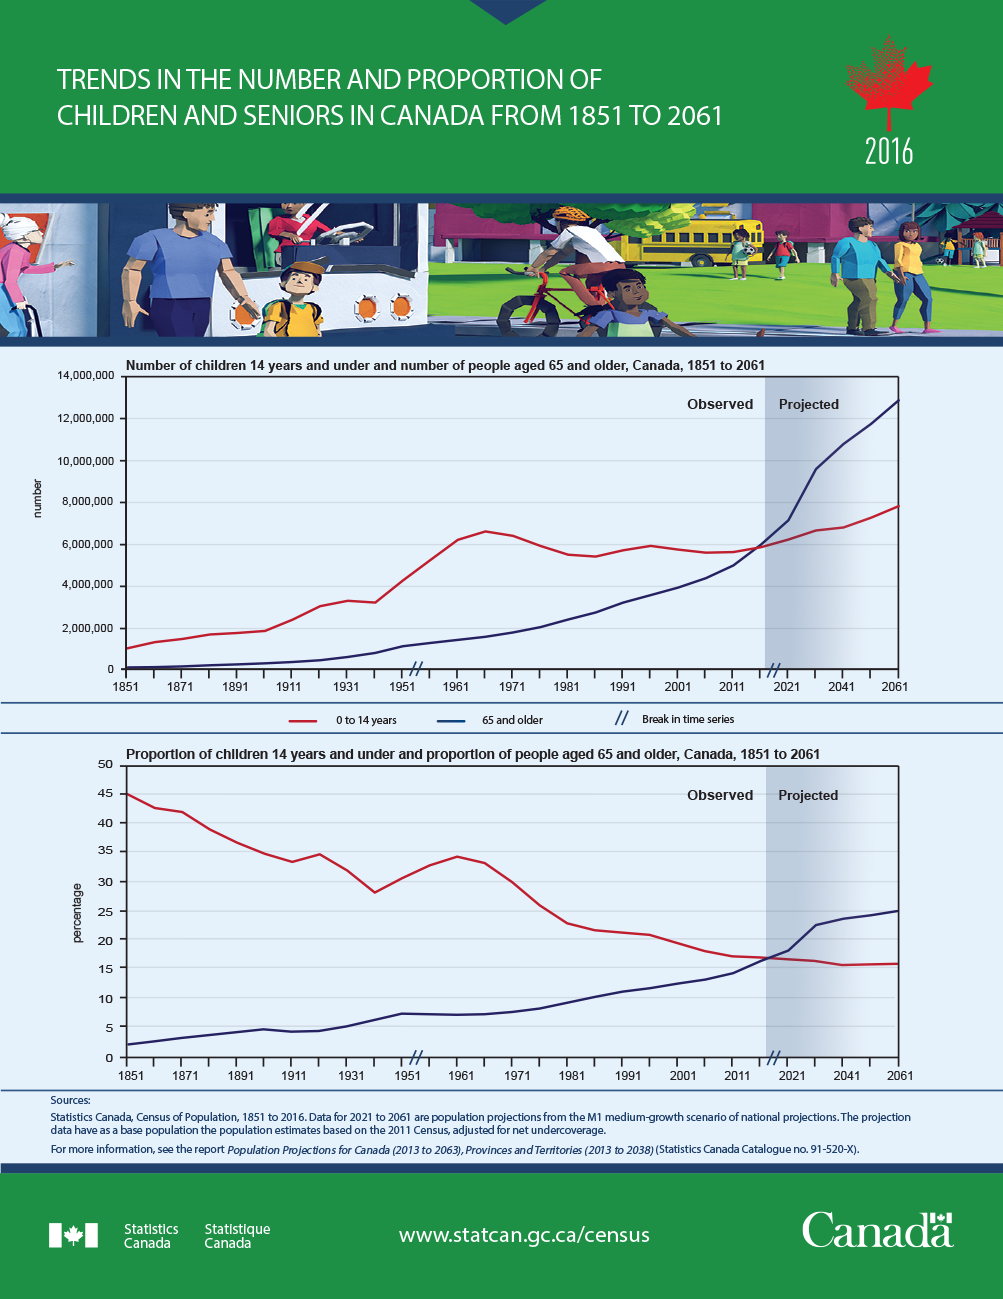
As a result of the rapid increase in the number of people 65 years of age and older since 2011, 2016 marked the first time that the census enumerated more seniors (5.9 million) than children 14 years of age and younger (5.8 million).
For the first time, the share of seniors (16.9%)—the share they represent of the total Canadian population—exceeded the share of children (16.6%). The increase in the proportion of seniors from 2011 to 2016 was the largest observed since 1871—a clear sign that Canada's population is aging at a faster pace.
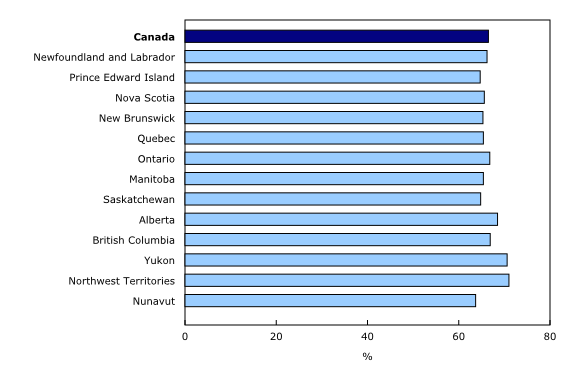
The 2016 Census enumerated 23.4 million 15 to 64 year olds, or 66.5% of the total population. This was down from 68.5% in 2011.
In addition to the baby boomers getting older, these lasting changes are also due to two other trends that will likely continue in the future. The increasing life expectancy of Canadians is gradually bringing the number and proportion of seniors upward, while continuous low fertility rates since the 1970s limit the number of children and drives down their share in the overall population.
Although 30 years of sustained immigration has had a significant impact on Canada's population growth, it did not have much influence on the aging of the population for two reasons. First, immigration flows have been relatively stable since the late 1980s. Secondly, most immigrants arriving in Canada are in their thirties and grow older here in Canada.
One in four Canadians could soon be 65 years of age and older
In 1871, four years after Confederation, more than two in five Canadians were 14 years of age and younger and 3.6% of the population was 65 years of age and older. The life expectancy of Canadians at the time was 40 years and only one in three people reached the age of 65. Today, life expectancy is over 82 years, and 9 in 10 people can expect to reach 65 years of age.
According to population projections, the difference between the number of seniors and children is expected to increase. By 2061, there could be 12 million seniors and fewer than 8 million children.
By 2031, close to one in four Canadians (23%) could be 65 years of age or older, while the proportion of children 14 years of age and younger could remain similar to the 2016 level (16%). The share of people aged 15 to 64 will likely continue to decrease.
The Canadian population in 2016: Younger than most G7 countries
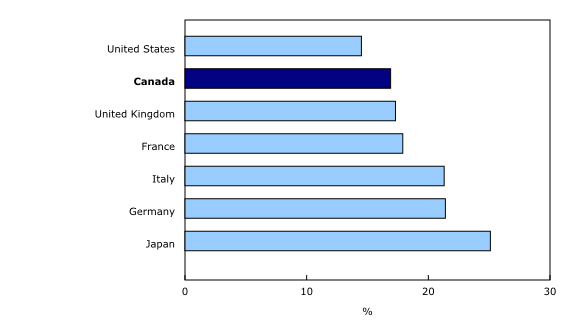
Despite the recent acceleration in population aging, Canada had a lower proportion of seniors in 2016 than any other G7 country except the United States.
On account of higher fertility over the past 30 years, the proportion of seniors in 2016 was lower in the United States than in Canada. The average fertility in the United States was 2.0 children per woman, compared with 1.6 in Canada.
The Canadian population will continue to age rapidly until 2031 and the proportion of seniors could eventually equal the level now seen in Japan.
Japan stands out among all other countries in that it has the oldest population in the world, with one in four people 65 years of age and older. The combination of very low fertility and the highest life expectancy in the world explains why Japan has an older population than elsewhere.
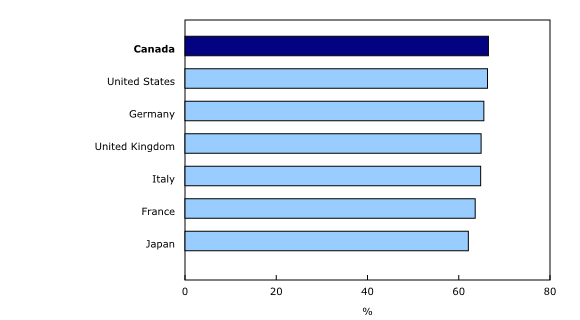
The share of people aged 15 to 64 was also higher in Canada than in other countries.
This situation could be an asset for the Canadian economy, as the country still has a large working-age population (people aged 15 to 64) and a smaller share of children and seniors than elsewhere.
An increasingly female population
Given that women have a longer life expectancy than men, the aging of the Canadian population is also changing the distribution by sex.
Since the mid-1970s, there have been slightly more women than men in Canada. In 2016, women accounted for 50.9% of the total population. This proportion is likely to continue to increase as the large generation of baby boomers grows older.
Among people 65 years of age and older, the number of women exceeded the number of men by more than 20% and there were two women for every man in the 85-and-older population. However, there are major differences between certain regions of Canada (see section on municipalities).
An infographic entitled Population Trends by Age and Sex is also available and summarizes the key trends related to the age and sex structure of the Canadian population.
Provinces and territories
Younger populations in the Prairies and the North, older populations in Eastern Canada
National trends mask considerable differences from one region to another. As with population growth, age structure varies from east to west. Eastern Canada has older populations on average, while Western and Northern Canada have younger populations. These differences are shown in the provincial and territorial comparative age pyramids.
Atlantic provinces: Sharp decline in the number of 15 to 64 year olds, strong increase in the number of seniors
Since 2011, when the first baby boomers began turning 65, more changes have occurred in the age structure of the Atlantic provinces than anywhere else. There is a significant shortfall of children turning 15 years of age to replace the first baby boomers who are moving from the 15-to-64 group to the 65-and-older group. This is due to low fertility, low immigration levels and migratory losses to other regions of Canada.
As a result, from 2011 to 2016, the Atlantic provinces saw the biggest decline in the proportion of people aged 15 to 64 and, in general, the largest increase in the proportion of seniors.
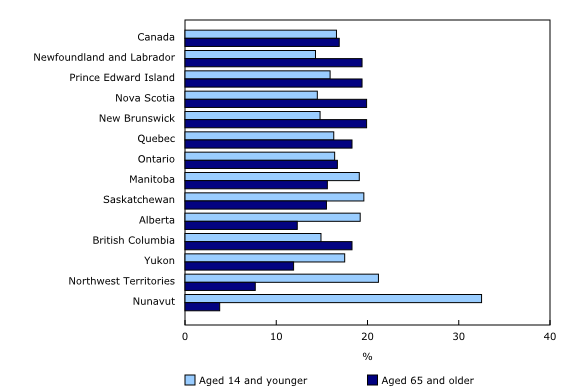
In 2016, almost one in five people in the Atlantic provinces was 65 years of age and older—the highest proportion in the country. By comparison, this proportion was only 12.3% in Alberta, almost 8 percentage points lower. This is the largest difference between provinces since Confederation.
If current trends hold, this difference between the provinces with the highest and lowest proportions of seniors could reach almost 15 percentage points by 2031.
Quebec: A distinct age structure
Just like the Atlantic provinces and Yukon, the proportion of 15 to 64 year olds decreased rapidly in Quebec from 2011 to 2016. Meanwhile, the proportion of seniors in Quebec (18.3%) was above the national average (16.9%) in 2016.
While the proportion of children 14 years of age and younger in Quebec (16.3%) was just below the national average (16.6%), the proportion of children aged 9 and younger was higher in Quebec (11.2%) than anywhere except the Prairie provinces, where fertility is higher.
The situation in Quebec is linked to an increase in the number of births from 2006 to 2011, which was particularly high in the province (+17.5% compared with +11.0% nationally).
Ontario: Similar proportions of children and seniors
The proportions of children (16.4%) and seniors (16.7%) were similar in Ontario. Sustained by immigration, the share of 15 to 64 year olds (66.8%) changed less in Ontario from 2011 to 2016 than any other province, with exception of the Prairie provinces.
Prairies: More children than seniors and more millennials than baby boomers
Like the territories, the Prairie provinces were the only jurisdiction in 2016 where more children 14 years of age and younger were enumerated than seniors 65 years of age and older.
Close to one in five people in these provinces was 14 years of age and younger, a much higher proportion than anywhere except the Northwest Territories and Nunavut.
The Prairies were also the only provinces where there were more people aged 15 to 34, often referred to as millennials, than baby boomers (aged 51 to 70). The population aged 15 to 34 in these provinces is sustained by higher fertility and immigration, and in the case of Alberta, the migration of people from other provinces, often drawn by the booming labour market.
British Columbia: High concentration of very old people on Vancouver Island
In Western Canada, the population of British Columbia is older than the population of the Prairie provinces.
In 2016, the proportion of seniors (18.3%) in British Columbia was similar to Eastern Canada. British Columbia also had the lowest proportion of children 14 years of age and younger in Western Canada.
For many years, British Columbia has had the highest life expectancy among the provinces and territories, as well as lower fertility.
In some municipalities on Vancouver Island, over two in five people were 65 years of age and older in 2016 (see the section on municipalities).
Territories: The youngest populations in Canada
The territories have the youngest populations in Canada. A large proportion of the population living in the territories identifies as an Aboriginal person and the fertility of Aboriginal groups is considerably higher than the rest of the Canadian population. Life expectancy there is also lower than anywhere else, mostly due to different life conditions.
For example, in Nunavut, nearly one-third (32.5%) of the population was 14 years of age and younger in 2016 and only 3.8% of the population was 65 years of age and older. Population aging in the territories is also slower than elsewhere, with the proportion of seniors increasing by only 0.5 percentage points since 2011—the lowest increase among the provinces and territories.
Large urban centres and other regions
Large urban centres: Proportionally more 15 to 64 year olds and fewer seniors
The census provides reliable data on the population of various regions of each province and territory, particularly large urban centres—or census metropolitan areas (CMAs)—and other regions (non-CMAs). The census also provides data for all municipalities in Canada.
The growth and age structure of these regions differ, mostly by the strength and diversity of the labour market, with large urban centres (CMAs) attracting young adults seeking postsecondary education or employment.
In addition to stronger population growth, there were proportionally fewer seniors (15.6%) in 2016 and more 15 to 64 year olds (67.8%) in Canada's 35 CMAs than in non-CMAs (20.0% and 63.4% respectively).
There were also markedly more 15 to 34 year olds in CMAs (26.6%) than in non-CMAs (22.0%).
Population aging was also slower in large urban centres than in other regions. From 2011 to 2016, the proportion of seniors increased by 1.8 percentage points in CMAs and 2.9 percentage points in non-CMAs.
An interactive graph showing the links between population growth and aging for various regions is also available on the Census web module.
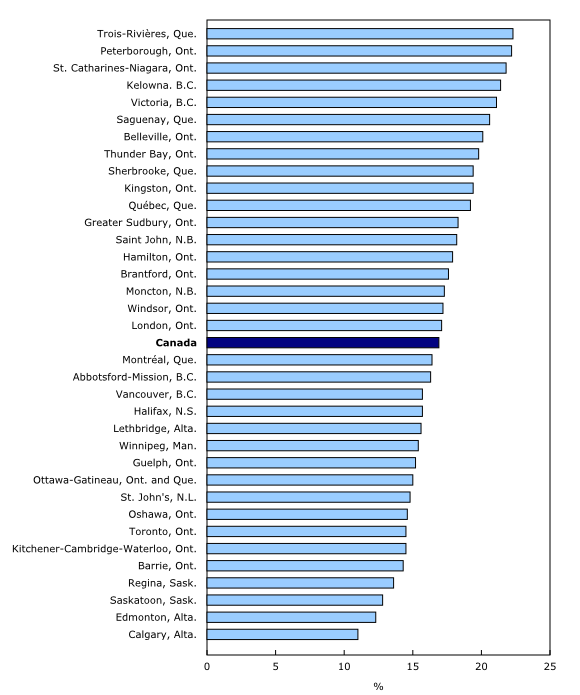
Proportion of seniors twice as high in Trois-Rivières as in Calgary
Just like population growth, age structure also varies greatly from one CMA to another.
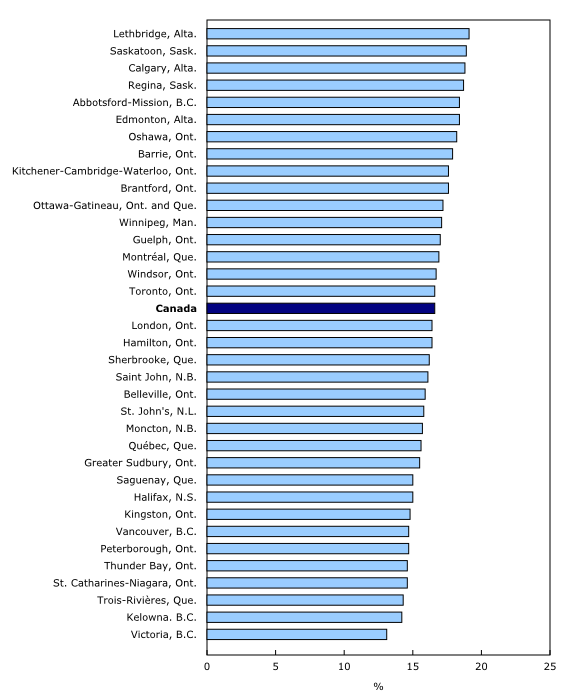
CMAs in the Prairie provinces had stronger demographic growth in 2016 and a younger population than CMAs in Eastern Canada, with higher proportions of children 14 years of age and younger and 15 to 64 year olds and a lower proportion of seniors.
For example, in addition to having the strongest population growth of all CMAs, Calgary had the lowest proportion of seniors (11.0%) in 2016 and one of the highest proportions of children 14 years of age and younger (18.8%) and 15 to 64 year olds (70.2%).
Large urban centres in the Prairies also had slower population aging than provinces in Eastern and Central Canada, attributable to higher fertility and stronger international and internal migration. The proportion of seniors in the Prairie CMAs increased by less than 1.5 percentage points from 2011 to 2016, while it rose by at least 3 percentage points in CMAs in Eastern Canada, including Saguenay, Kingston and Saint John.
More than one in five people in seven large urban centres in the country were 65 years of age and older. However, none of these CMAs were in the Atlantic or Prairie provinces: Trois-Rivières (22.3%), Peterborough (22.2%), St. Catharines–Niagara (21.8%), Kelowna (21.4%), Victoria (21.1%), Saguenay (20.6%) and Belleville (20.1%). With the exception of Kelowna and Victoria, population growth in these CMAs was also lower than anywhere else.
Meanwhile, the proportion of 15 to 64 year olds in St. John's (69.4%) and Halifax (69.3%) was well above the national average of 66.5%, while Victoria had the lowest proportion of children 14 years of age and younger (13.1%) in Canada.
The differences are also shown in the age pyramids, which compare the age and sex structure for census metropolitan areas and census agglomerations.
Populations in the suburbs younger than in the city centre
In many CMAs, the concentration of children 14 years of age and younger was higher in suburbs than in city centres. This indicates that suburbs often grow quickly because they attract young adults wanting to raise a family.
Maps showing the proportions of seniors and children in various neighbourhoods (census tracts) in Canada's 35 CMAs provide a clearer picture of the demographic composition of these large urban centres and are available on the census web module.
Municipalities
More seniors than children in nearly every municipality in Nova Scotia, compared to less than 15% of municipalities in Alberta
The census is an important and reliable data source for Canadian municipalities, 713 of which had a population of 5,000 or more in 2016.
Of these 713 municipalities, 408 (57.2%) had more seniors than children in 2016.
However, this proportion varied greatly from one province to another. For example, every municipality in Nova Scotia except East Hants had more seniors than children, compared with just under 15% of municipalities in Alberta.
Four municipalities in Canada were notable for their high proportions of children 14 years of age and younger. They are all located in the Prairie provinces: Mackenzie County (34.4%) and Taber (31.5%) in Alberta, as well as Stanley (33.4%) and Rhineland (31.6%) in Manitoba.
More than two in five people were 65 years of age and older in four Canadian municipalities. Three of the four are located on Vancouver Island: Qualicum Beach (52.1%), Parksville (42.4%) and Sidney (40.9%). The fourth municipality is Osoyoos (42.9%), located south of Kelowna, close to the US border.
Some Canadian municipalities have higher concentrations of men or women.
The presence of correctional institutions, military bases and sports infrastructure such as ski resorts often explains a high concentration of men. For example, among municipalities with a population of 5,000 or more, Kent, British Columbia held the highest proportion of men with 122.6 men per 100 women. Kent is home to two federal penitentiaries (Mountain Institution and Kent Institution).
Municipalities with older populations have higher concentrations of women. This was the case in many municipalities on Vancouver Island, British Columbia (Parksville, Oak Bay, Qualicum Beach and Sidney), a region known to attract many seniors mainly because of its mild climate.
Types of dwellings
Also released today is information on the types of private dwellings Canadians live in, as well as on the number of Canadians living in collective dwellings in 2016.
The most common type of private dwelling in Canada in 2016 was the single-detached house, accounting for 53.6% or 7.5 million of the 14.1 million private occupied dwellings in Canada. This share has been declining since the early 1980s. Private dwellings are classified according to their structural type, such as single-detached, apartment or mobile home.
The mix of dwelling types differed from region to region and city to city. For example, apartments accounted for the highest share of dwellings in the CMAs of Montréal, Vancouver and Québec. In contrast, apartments were in the minority in Calgary and Edmonton—two of the fastest growing CMAs.
In 2016, 425,750 or 1.2% of Canadians lived in nursing homes or residences for senior citizens. Given population aging, this type of living arrangement is expected to continue to grow in the future.
Further analysis can be found in the Census in Brief article Dwellings in Canada. More information on housing characteristics from the 2016 Census, such as condominiums, cost of housing and affordability, will be available in October 2017.
Note to readers
2016 Census of Population products and releases
Today, Statistics Canada is releasing the second set of results from the 2016 Census of Population. These results focus on the age and sex distribution of the Canadian population and on the types of dwellings in 2016 at the national, provincial, territorial and sub-provincial levels.
Census results show to what extent the Canadian population is aging. These trends have many implications, including on the labour market, retirement, health care and services, housing, public transportation and consumption. Population aging also varies greatly from one region to the next across the country.
Several 2016 Census products are also available today on the Census Program web module. This module has been designed to provide easy access to census data, free of charge. Information is organized into broad categories, including analytical products, data products, reference materials, geography and a video centre.
Analytical products include three articles from the Census in Brief series. Two articles provide analyses focusing on current population issues involving challenges that are relevant from a public policy perspective. The first one focuses on recent trends for the population aged 15 to 64 and the second one deals with the population aged 85 and older in 2016 in Canada. The third article presents information on the structural types of dwellings in Canada and includes basic information on the population living in collective dwellings.
Data products include the age and sex and type of dwelling results for a wide range of standard geographic areas, available through the Census Profile, Data tables and Highlight tables.
In addition, the Focus on Geography Series provides data and highlights on key topics found in this Daily release and in the Census in Brief articles at various levels of geography.
Reference materials contain information to help understand census data. They include the Guide to the Census of Population, 2016, which summarizes key aspects of the census, as well as response rates and other data quality information. They also include the Dictionary, Census of Population, 2016, which defines census concepts and variables, and the Structural Type of Dwelling and Collectives Reference Guide, which explains census concepts and changes made to the 2016 Census. This reference guide also includes information about data quality and historical comparability, and comparisons with other data sources. Both the Dictionary and the Guide to the Census of Population are updated with additional information throughout the release cycle.
Geography-related 2016 Census Program products and services can be found under Geography. This includes GeoSearch, an interactive mapping tool, and thematic maps, which show age and sex data for various standard geographic areas.
A brief historical picture of aging in Canada can be found in the Video centre.
Historical Age Pyramid (1851 to 2036) shows changes in the age structure of Canada, and the provinces and territories over time. Comparison Age Pyramid (2011 and 2016) allows users to compare the age structure of two different geographical entities for Canada, the provinces and territories.
Two infographics are also available. Population Trends by Age and Sex illustrates some key findings, including the share of seniors and children for Canada, provinces and territories, and Dwellings in Canada illustrates the structural types of private dwellings in Canada.
The public is also invited to chat with an expert about this release, on Friday May 5, 2017, from 12:30 to 1:30 p.m., Eastern Time.
Over the coming months, Statistics Canada will continue to release results from the 2016 Census of Population, and provide an even more comprehensive picture of the Canadian population. Please see the 2016 Census Program release schedule to find out when data and analysis on the different topics will be released throughout 2017.
Contact information
For more information, or to enquire about the concepts, methods or data quality of this release, contact us (toll-free 1-800-263-1136; 514-283-8300; STATCAN.infostats-infostats.STATCAN@canada.ca) or Media Relations (613-951-4636; STATCAN.mediahotline-ligneinfomedias.STATCAN@canada.ca).
- Date modified:


