
Canadian Agriculture at a Glance
Alberta has the highest farm operating revenues in Canada
by Michelle St. Pierre and Mike McComb
Skip to text
Text begins
Correction notice
On February 3, 2023, two corrections were made to the following sentences in the section “Farms reporting solar energy production are increasing”: “In 2021, 8.7% of farms in Alberta reported solar energy production, up from 4.3% in the previous census. By comparison, 7.7% of farms in Canada reported solar energy production." The "8.7%" value replaced the "8.6%" value previously published, and the "7.7%" value replaced the "7.6%" value previously published.
Alberta’s abundance of arable land and sunshine, coupled with its extensive land management practices and well-developed meat processing facilities, enables the province to effectively grow crops and raise cattle. Data from the 2021 Census of Agriculture show that Alberta contributes mightily to the economic viability of Canada’s agricultural industry, in large part due to its beef and field crop farming operations.
In 2020, farms in Alberta reported $22.2 billion in farm operating revenues. This was more than any other province and accounted for over a quarter (25.5%) of Canada’s $87.0 billion in total farm revenues.
Farms with $2 million and over in revenues make up three-fifths of farm revenues
In Alberta, farms with at least $2 million in revenues reported over half of the province’s farm operating revenues. In 2020, farms in this category made up 4.0% of farms in the province, yet their farm revenues accounted for 61.7% of total farm revenues in Alberta. By comparison, farms with at least $2 million in revenues accounted for 4.1% of farms in 2021 and 51.5% of farm operating revenues in Canada in 2020.
Oilseed and grain farms make up the biggest share of farm revenues
Farms classified as oilseed and grain accounted for the most farm operating revenues in Alberta. In 2020, oilseed and grain farms reported $9.0 billion in revenues, which made up 40.4% of the province’s total farm revenues. This was followed by farms classified as beef and feedlots, which accounted for 38.8% of Alberta’s farm operating revenues. By comparison, oilseed and grain farms accounted for 38.6% of total farm revenues in Canada while beef farms made up 16.5%.
Beef farms have the highest farm expenses
Beef farms accounted for the most farm expenses in Alberta. In 2020, expenses from beef farms totalled over $8.1 billion, making up 42.8% of the province’s total farm expenses. This was followed by oilseed and grain farms, which made up 36.8% of Alberta’s farm expenses. By comparison, oilseed and grain farms made up the biggest proportion (35.5%) of Canada’s total farm expenses.
As was the case with farm operating revenues, Alberta also reported the highest farm operating expenses in 2020. With $19.0 billion in expenses, Alberta farms made up 26.3% of Canada’s total farm expenses in 2020.

Data table for Chart 1
| Revenues | Expenses | |
|---|---|---|
| percent | ||
| Beef farming and feedlots | 38.8 | 42.8 |
| Oilseed and grain farming | 40.4 | 36.8 |
| Source: Statistics Canada, Census of Agriculture, 2021 (3438). | ||
The number of farms in Alberta is increasing
Alberta was one of two provinces in Canada to report an increase in the number of farms, with a 2.1% increase from 2016. In 2021, Alberta reported 41,505 farms, accounting for 21.9% of Canada’s farms, up from 21.0% in 2016.
The biggest driver of this increase was farms classified as beef and feedlots, which increased by over 2,000 over the period. However, farms reporting cattle increased by 8.3% over the period (representing 21,562 farms), suggesting that the beef and feedlot industry is complex, with farms classified in other categories also reporting cattle.
In 2021, farms classified as beef and feedlots made up 35.2% of Alberta’s farms, followed by oilseed and grain farms (33.6%). Moreover, the province accounted for 36.8% of Canada’s beef farms, which was more than any other province.
| number | percent | |
|---|---|---|
| Dairy and milk production | 393 | 0.9 |
| Beef farming and feedlots | 14,601 | 35.2 |
| Hog and pig farming | 136 | 0.3 |
| Poultry and egg production | 400 | 1.0 |
| Sheep and goat farming | 473 | 1.1 |
| Other animal production | 4,174 | 10.1 |
| Oilseed and grain farming | 13,942 | 33.6 |
| Vegetable and melon farming | 287 | 0.7 |
| Fruit and tree nut farming | 123 | 0.3 |
| Greenhouse, nursery and floriculture production | 421 | 1.0 |
| Other crop farming | 6,555 | 15.8 |
| Total | 41,505 | 100.0 |
| Source: Statistics Canada, Census of Agriculture, 2021 (3438). | ||
Alberta has the second largest total farm area in the country
In 2021, farms in Alberta reported the second highest total farm area (behind Saskatchewan), making up 32.0% of Canada’s total. Alberta reported a total farm area of 49.2 million acres in 2021, which was a 2.2% decrease from 2016.
While cropland in Alberta increased from 2016 to 2021, natural and seeded land for pasture, woodlands, wetlands and summerfallow area decreased. The largest decrease came from natural land for pasture, which decreased by 734,974 acres in 2021.
In 2021, farms classified as oilseed and grain accounted for the largest total farm area in the province, with 46.4%. This was followed by farms classified as beef and feedlots (39.6%) and other crop farms (7.9%).
Alberta has more than a quarter of Canada’s field crop area
In 2021, farms in Alberta reported 25.6 million acres of hay and field crops, up 1.6% from 2016. The province accounted for 27.6% of Canada’s field crop and hay area. The three biggest crop contributors in Alberta were canola, spring wheat and barley. Alberta was the top grower of barley in Canada and grew the second highest number of acres of canola and spring wheat.
| 2021 | Change from 2016 | Proportion of Canada's total | |
|---|---|---|---|
| acres | percent | ||
| Canola | 6,685,992 | 8.4 | 30.0 |
| Spring wheat | 5,709,845 | -0.3 | 35.6 |
| Barley | 3,950,591 | 15.7 | 47.5 |
| Sources: Statistics Canada, Census of Agriculture, 2016 and 2021 (3438). | |||
Alberta leads in beef cows
As was the case in 2016, farms in Alberta reported more beef cows than any other province. In 2021, Alberta accounted for 44.1% of Canada’s total beef cows. Alberta reported 1.7 million beef cows, up 5.6% from 2016.
The province also reported the third most dairy cows. In 2021, farms in Alberta reported 86,821 dairy cows, up 8.5% from 2016. Overall, Alberta accounted for 8.9% of dairy cows reported in Canada in 2021.
Alberta reported the fourth highest inventories of both pigs and chickens. Farms in Alberta reported 1.6 million total pigs in 2021. This was an 8.3% increase from 2016 and led to Alberta accounting for 10.9% of Canada’s reported pig inventory. Alberta reported 9.8% of Canada’s total chicken and hen inventory. In 2021, farms in Alberta reported 14.9 million chickens and hens, up 5.2% from 2016.
Alberta most likely to use rotational grazing and in-field winter grazing
Of all provinces, Alberta had the highest rate of use of both rotational grazing and in-field winter grazing or feeding. Rotational grazing is the practice of grazing livestock on pastures that are managed to allow for a specific recovery period following grazing. In 2020, 30.5% of farms in Alberta reported using rotational grazing. While this rate was lower than in 2015 (33.3%), it was higher than the rate reported across Canada (20.7%).
In 2020, over a quarter (28.9%) of farms in Alberta reported in-field winter grazing and feeding, up from 27.5% in 2015. In-field winter grazing or feeding is the practice of keeping grazing livestock in the field (cropland or pastureland) over winter. Beef farms made up 59.4% of farms in the province that reported in-field winter grazing in 2020.
Among provinces, Alberta had the second highest rate of use for windbreaks and shelterbelts. Windbreaks and shelterbelts are rows of natural or planted trees or hedges along field edges that stop prevailing winds from eroding the soil. In 2020, over two-thirds (69.6%) of farms in Alberta reported shelterbelts or windbreaks. This is higher than in 2015 (50.7%), and above the national average of 52.3%.

Data table for Chart 2
| Rotational grazing | In-field winter grazing or feeding | Windbreaks or shelterbelts | |
|---|---|---|---|
| percent | |||
| Alberta | 30.5 | 28.9 | 69.6 |
| Canada | 20.7 | 16.0 | 52.3 |
| Source: Statistics Canada, Census of Agriculture, 2021 (3438). | |||
Farms reporting solar energy production are increasing
In 2021, 8.7% of farms in Alberta reported solar energy production, up from 4.3% in the previous census. By comparison, 7.7% of farms in Canada reported solar energy production.
In general, Alberta farms were less likely to report renewable energy production. In 2021, 10.2% of farms reported renewable energy production, which was below the national average (11.9%).
Alberta is among the national leaders in use of auto-steer and drone technology
Alberta reported the third highest use of automated guidance steering systems (auto-steer). In 2020, nearly a third (31.1%) of farms in Alberta reported using auto-steer equipment, up from 25.7% in 2015. This was also higher than the national average (26.8%).
One possible reason for Alberta’s higher-than-average rate of auto-steer equipment is because of its prevalence of farms classified as oilseed and grain. In 2020, 73.2% of the 50,917 farms that reported auto-steer equipment in Canada were oilseed and grain farms, and in Alberta, over a third of farms were oilseed and grain (33.6%).
Alberta also reported the third highest rate of use for drones. In 2020, 4.2% of farms in the province reported using drones. This was slightly higher than the national average (3.6%).
Alberta has the second highest rate of succession planning in Canada
One province (Saskatchewan) had a higher rate of succession planning than Alberta. In 2021, 14.0% of farms in Alberta reported a succession plan, up from 8.5% in 2016. By comparison, 12.0% of farms in Canada reported a succession plan in 2021.
In 2021, farms in Alberta accounted for over a quarter (25.4%) of Canada’s share of farms that reported a succession plan, up from 21.2% in 2016.
Farms classified as oilseed and grain made up the biggest proportion (43.7%) of farms in Alberta that reported a succession plan in 2021. This was followed by beef and feedlots (31.3%).
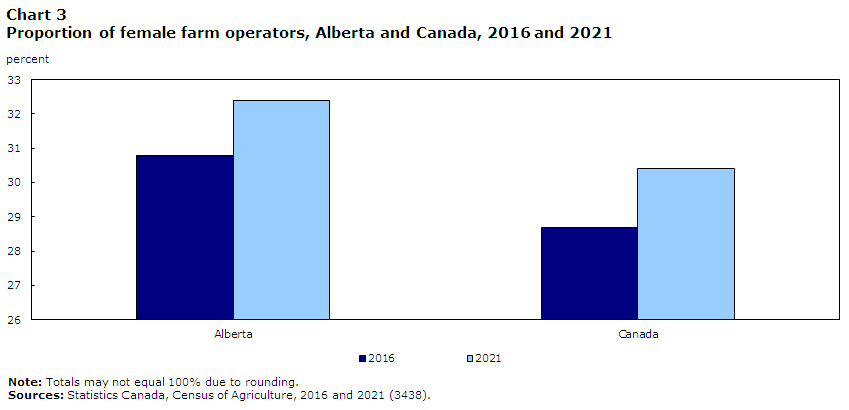
Alberta has the second highest percentage of female farm operators
As was the case in 2016, Alberta reported the second highest percentage of female farm operators among provinces. In 2021, females accounted for 32.4% of farm operators in the province, up from 30.8% in 2016. By comparison, females made up 30.4% of total farm operators in Canada in 2021. Despite making up just over one-fifth (21.8%) of total farm operators in Canada, Alberta accounted for 23.2% of female farm operators in the country.
Data table for Chart 3
| Alberta | Canada | |
|---|---|---|
| percent | ||
| 2016 | 30.8 | 28.7 |
| 2021 | 32.4 | 30.4 |
|
Note: Totals may not equal 100% due to rounding. Sources: Statistics Canada, Census of Agriculture, 2016 and 2021 (3438). |
||
The proportion of farm operators working off the farm is increasing
In 2020, 49.0% of farm operators in Alberta reported working off the farm, up from 47.3% in 2015. This rate was just above the national average (47.7%). There was an increase in the proportion of farm operators in Alberta working less than 20 hours per week off the farm, from 9.3% in 2015 to 11.3% in 2020. Conversely, there was decrease in the proportion of farm operators working 40 hours or more per week off the farm, from 17.1% in 2015 to 15.5% in 2020.

Data table for Chart 4
| More than 40 hours | 30 to 40 hours | 20 to 29 hours | Less than 20 hours | |
|---|---|---|---|---|
| percent | ||||
| 2015 | 36.1 | 30.1 | 14.2 | 19.7 |
| 2020 | 31.7 | 32.7 | 12.6 | 23.0 |
|
Note: Totals may not equal 100% due to rounding. Sources: Statistics Canada, Census of Agriculture, 2016 and 2021 (3438). |
||||
Definitions and concepts
A significant conceptual change to the main statistical unit used by Statistics Canada’s Agriculture Statistics Program has been introduced for the 2021 Census of Agriculture: a “farm” or an “agricultural holding” (i.e., the census farm) now refers to a unit that produces agricultural products and reports revenues or expenses for tax purposes to the Canada Revenue Agency. Before 2021, a “farm” was defined as an agricultural operation that produced at least one agricultural product intended for sale
In 2021, there have been changes to the definition of a census farm; in Yukon and Northwest Territories, some activities that were previously included within the definition are not included in 2021. Caution should be taken when comparing the 2021 Census of Agriculture data with data from previous censuses.
The data displayed by geography have undergone random tabular adjustment. The Canada total data for geographic breakdowns may differ from the Canada total data displayed in tables by North American Industry Classification System (NAICS) category and sales class.
The data for Yukon and the Northwest Territories are not included in the national totals; they are presented separately.
The Census of Agriculture is conducted every five years and is a census of all agricultural operations that produces agricultural products and reports revenues or expenses for tax purposes to the Canada Revenue Agency. Important concepts used in this analysis include:
Total farm area, which is land owned or operated by an agricultural operation, includes: cropland, summer fallow, improved and unimproved pasture, woodlands and wetlands, all other land (including idle land and land on which farm buildings are located).
Total farm area includes the total area of land owned, leased, rented, crop-shared or used by this operation minus land area used by others.
Cropland is the total area of field crops, hay, field vegetables, fruits, berries, nuts, sod, nursery products and Christmas trees.
Farm type is established through a procedure that classifies each census farm according to the predominant type of production. This is done by estimating the potential revenues from the inventories of crops and livestock reported on the questionnaire and determining the product or group of products that make up the majority of the estimated receipts. For example, a census farm with total potential revenues of 60% from hogs, 20% from beef cattle and 20% from wheat, would be classified as a hog and pig farm. The farm types presented in this document are derived based on the 2017 NAICS.
Farm operator refers to any person responsible for the management decisions in operating a farm or agricultural operation. Also known as an agricultural operator, farmer, operator or rancher.
Farm employees include both farm operators and agricultural workers.
Price indexes were used to obtain constant dollar estimates of sales, export values and farm assets in order to eliminate the impact of price change in year-to-year comparisons.
Farm operating revenues
Farm operating revenues come from the Agriculture Taxation Data Program (ATDP). Previously, revenues for agricultural operations were reported to the Census of Agriculture. Caution should be taken when comparing the 2021 Census of Agriculture data with previous censuses.
The Census of Agriculture measures farm operating revenues (in current dollars) for the calendar or accounting year prior to the census. Farm operating revenues (before deducting expenses) in this analysis include: operating revenues from all agricultural products sold, program payments and custom work revenues.
The following are not included in farm operating revenues: sales of forestry products (for example: firewood, pulpwood, logs, fence posts and pilings); sales of capital items (for example: quota, land, machinery); and revenues from the sale of any goods purchased only for retail sales.
Total operating expenses
Total operating expenses come from the ATDP. Previously, expenses for agricultural operations were reported to the Census of Agriculture. Caution should be taken when comparing the 2021 Census of Agriculture data with previous censuses.
The Census of Agriculture measures operating expenses (in current dollars) for the calendar or accounting year prior to the census. Total operating expenses include any expense associated with producing agricultural products (such as the cost of seed, feed, fuel, fertilizers).
The following are not included in total operating expenses: the purchase of land, buildings or equipment, and depreciation or capital cost allowance. Depreciation represents economic "wear and tear" expense. Capital cost allowance represents the amount of depreciation written off by the tax filer as allowed by tax regulations.
Expenses-to-revenues ratio
The expenses-to-revenues ratio is the average amount of operating expenses incurred for a dollar in farm operating revenues. The ratio is calculated in current dollars.
Census Day was May 11, 2021. Farmers were asked to report their operating revenues and expenses for the last complete fiscal or calendar year (2020).
Full-time employment is classified as farm operators who worked 30 hours or more per week; part-time employment is classified as farm operators who worked less than 30 hours per week.
Some data refer to a reference period other than Census Day. For example, for financial data the reference period is the calendar or accounting (fiscal) year prior to the census.
- Date modified: