
Skip to text
Text begins
Correction notice
On February 3, 2023, a correction was made to the following sentence in the section “Rate of renewable energy production on par with the rest of Canada”: “By comparison, 7.7% of farms across Canada reported solar energy production." The "7.7%" value replaced the "7.6%" value previously published.
Farming in Nova Scotia has a reputation for blueberry and apple cultivation, in part because of the acidity in the soil, which is conducive for these types of crop cultivation. The province is also home to a wide variety of grape cultivars for producing wines. Data from the 2021 Census of Agriculture reaffirm the province’s reputation for blueberry and apple farming.
In 2021, farms in Nova Scotia reported the third largest lowbush blueberry area in Canada, with 35,814 acres. The province accounted for over a fifth (22.0%) of Canada’s reported lowbush blueberry acreage.
The province reported 4,924 acres of apples, the fourth largest apple acreage in the country. From 2016 to 2021, apple acreage decreased slightly by 0.6% across Canada, but increased by 11.5% in Nova Scotia.
One factor impacting fruit farming in Nova Scotia (and across Canada) has been the increase in prices for fresh fruit, which may be pushing more farms to produce fresh fruit. In 2021, the Farm Product Price Index indicates that fresh fruit in Canada saw a 24.9% increase over the past five years in the price index. Lowbush blueberries and apples are reported under fresh fruit.
Nova Scotia has the most mink in Canada
In 2021, farms in Nova Scotia reported 84,458 mink. Despite the province reporting a two-thirds (66.6%) decrease from 2016 in the number of mink, it still made up over a third (35.8%) of Canada’s total. Two factors impacting the decrease in mink were consumer concerns about animal welfare and the consolidation of buyers.
Another factor impacting mink farming has been the decrease in mink fur exports. Over the past five years (2017 to 2021), exports for mink fur in Canada declined by 90.5%.
Fruit farms make up largest farm area
Farms classified as fruit and tree nut accounted for 22.1% of the province’s total farm area. This was followed by beef and feedlots (17.3%), dairy and milk (15.3%), and other crop farming (15.3%). In 2021, farms in Nova Scotia reported 720,045 acres in total farm area, down 21.4% since 2016. The decrease in total farm area was greater than the national rate of decline (-3.2%).
The top three contributors to total fruit and tree nut area in Nova Scotia were lowbush blueberries, apples and grapes. Lowbush blueberries accounted for 80.3% of the total fruit area for the province, followed by 11.0% for apples and 2.6% for grapes.
While poultry and egg farms accounted for 2.4% of Nova Scotia’s farm area, they made up 26.0% of the province’s farm operating revenues.
| 2016 | 2021 | Change | |
|---|---|---|---|
| acres | |||
| Dairy and milk production | 124,514 | 111,068 | -13,446 |
| Beef farming and feedlot | 139,980 | 125,745 | -14,235 |
| Hog and pig farming | 2,553 | 1,025 | -1,528 |
| Poultry and egg production | 21,638 | 17,546 | -4,092 |
| Sheep and goat farming | 9,076 | 10,535 | 1,459 |
| Other animal production | 51,330 | 36,290 | -15,040 |
| Oilseed and grain farming | 25,334 | 23,164 | -2,170 |
| Vegetable and melon farming | 20,890 | 67,438 | 46,548 |
| Fruit and tree nut farming | 232,201 | 160,600 | -71,601 |
| Greenhouse, nursery and floriculture production | 88,050 | 61,301 | -26,749 |
| Other crop farming | 200,091 | 111,026 | -89,065 |
| Total farm area | 915,657 | 725,738 | -189,919 |
| Sources: Statistics Canada, Census of Agriculture, 2016 and 2021 (3438). | |||
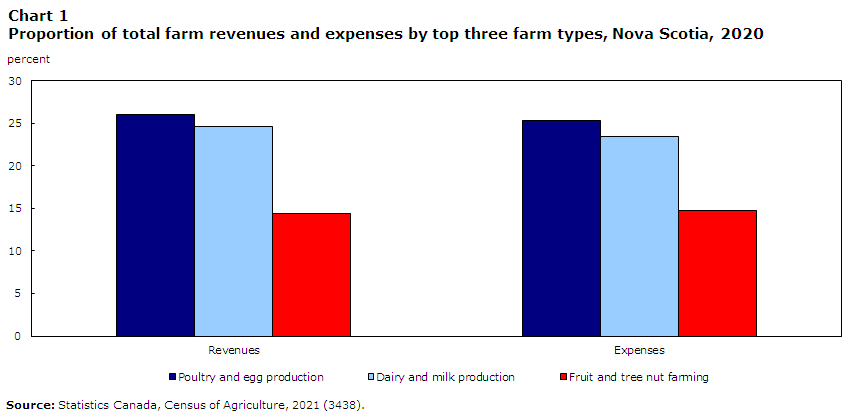
Poultry and egg farms account for biggest part of farm revenues
In 2020, farms classified as poultry and egg production accounted for over a quarter ($188.1 million) of the province’s farm operating revenues. This was followed by dairy and milk production ($177.9 million) and fruit and tree nut ($104.5 million) farms. In 2020, farms in Nova Scotia reported $722.1 million in farm operating revenues, accounting for 0.8% of Canada’s total farm operating revenues.
While fruit and tree nut farms accounted for 14.4% of farm operating revenues in Nova Scotia, they accounted for 2.2% of farm operating revenues in Canada in 2020.
Data table for Chart 1
| Revenues | Expenses | |
|---|---|---|
| percent | ||
| Poultry and egg production | 26.0 | 25.3 |
| Dairy and milk production | 24.6 | 23.4 |
| Fruit and tree nut farming | 14.4 | 14.8 |
| Source: Statistics Canada, Census of Agriculture, 2021 (3438). | ||
The number of farms is declining at a quicker rate than in the rest of Canada
The total number of farms reported in Nova Scotia decreased by 21.2% from the previous census. This was the largest decrease among provinces in Canada. By comparison, the number of farms reported across Canada decreased by 1.9% over the same period.
Farms classified as hog and pig had the biggest percentage decrease. From 2016 to 2021, the number of pig farms dropped by 56.5%. In total, there were 2,741 farms reported in Nova Scotia in 2021.
Rate of renewable energy production on par with the rest of Canada
In 2021, 11.5% of farms reported renewable energy production, which was more than double the rate (4.3%) reported in the previous census. By comparison, 11.9% of farms in Canada reported renewable energy production in 2021.
In Nova Scotia, solar energy was the most frequently reported source of renewable energy production. In 2021, 6.1% of farms in the province reported producing solar energy, up from 3.3% in the previous census. By comparison, 7.7% of farms across Canada reported solar energy production.
Rate of direct sales is above national level
In 2020, nearly a third (30.3%) of farms in Nova Scotia reported direct sales, up from 23.6% in 2015. By comparison, 13.6% of farms across Canada reported direct sales in 2020. Farms classified as beef and feedlots made up the largest portion (18.5%) of the 831 farms that reported direct sales in 2020 in the province.
Increasing use of shelterbelts or windbreaks
In 2020, 53.7% of farms in Nova Scotia reported selected land practices, up from 41.8% in 2015. By comparison, 64.5% of farms reported selected land practices in Canada.
The most frequently reported land practice in the province was the use of shelterbelts or windbreaks. In 2020, 40.4% of farms in Nova Scotia reported shelterbelts or windbreaks, up from 24.3% in 2015. Despite this increase, the provincial rate was still below the national level (52.3%).
The rate of succession planning is increasing significantly
In 2021, 8.1% of farms in Nova Scotia reported a succession plan, up from 5.2% in 2016. By comparison, 12.0% of farms across Canada reported a succession plan.
As mentioned earlier, fruit and tree nut farms made up the biggest proportion of total farms in Nova Scotia, and in 2021, represented over a quarter (25.8%) of all farms reporting a succession plan. This was significantly higher than what was reported across the country. In Canada, fruit and tree nut farms represented 3.2% of all farms reporting a succession plan.
Nova Scotia has the oldest farm operators
As was the case in 2016, Nova Scotia reported the highest average farm operator age in Canada. The average age of farm operators in the province increased from 56.5 years in 2016 to 58.2 years in 2021. In Nova Scotia, over two-thirds (67.6%) of farm operators were aged 55 years and older, which was above the national level (60.5%).

Data table for Chart 2
| Under 35 years | 35 to 54 years | 55 years and older | |
|---|---|---|---|
| percent | |||
| 2016 | 6.9 | 34.3 | 58.8 |
| 2021 | 6.3 | 26.0 | 67.6 |
|
Note: Totals may not equal 100% due to rounding. Sources: Statistics Canada, Census of Agriculture, 2016 and 2021 (3438). |
|||
Slight increase in proportion of female operators
The proportion of female operators in Nova Scotia increased from 27.3% in 2016 to 29.5% in 2021. However, this was still below the national level (30.4%).
In 2021, the number of total farm operators (3,785) in Nova Scotia decreased by 18.3% from 2016. The decrease in the number of farm operators was quite similar to the decrease of 21.2% in the total number of farms in the province.

Data table for Chart 3
| Male | Female | |
|---|---|---|
| percent | ||
| 2016 | 72.7 | 27.3 |
| 2021 | 70.5 | 29.5 |
|
Note: Totals may not equal 100% due to rounding. Sources: Statistics Canada, Census of Agriculture, 2016 and 2021 (3438). |
||
An increasing proportion of farm operators working off the farm
In Nova Scotia, the proportion of farm operators reporting working off the farm increased slightly from 44.7% in 2015 to 46.9% in 2020. Farm operators were less likely to work off farm part time (less than 30 hours per week) than full time (30 or more hours per week).

Data table for Chart 4
| More than 40 hours | 30 to 40 hours | 20 to 29 hours | Less than 20 hours | |
|---|---|---|---|---|
| percent | ||||
| 2015 | 38.6 | 30.8 | 13.0 | 17.6 |
| 2020 | 31.6 | 33.8 | 13.0 | 21.1 |
|
Note: Totals may not equal 100% due to rounding. Sources: Statistics Canada, Census of Agriculture, 2016 and 2021 (3438). |
||||
Definitions and concepts
A significant conceptual change to the main statistical unit used by Statistics Canada’s Agriculture Statistics Program has been introduced for the 2021 Census of Agriculture: a “farm” or an “agricultural holding” (i.e., the census farm) now refers to a unit that produces agricultural products and reports revenues or expenses for tax purposes to the Canada Revenue Agency. Before 2021, a “farm” was defined as an agricultural operation that produced at least one agricultural product intended for sale
In 2021, there have been changes to the definition of a census farm; in Yukon and Northwest Territories, some activities that were previously included within the definition are not included in 2021. Caution should be taken when comparing the 2021 Census of Agriculture data with data from previous censuses.
The data displayed by geography have undergone random tabular adjustment. The Canada total data for geographic breakdowns may differ from the Canada total data displayed in tables by North American Industry Classification System (NAICS) category and sales class.
The data for Yukon and the Northwest Territories are not included in the national totals; they are presented separately.
The Census of Agriculture is conducted every five years and is a census of all agricultural operations that produces agricultural products and reports revenues or expenses for tax purposes to the Canada Revenue Agency. Important concepts used in this analysis include:
Total farm area, which is land owned or operated by an agricultural operation, includes: cropland, summer fallow, improved and unimproved pasture, woodlands and wetlands, all other land (including idle land and land on which farm buildings are located).
Total farm area includes the total area of land owned, leased, rented, crop-shared or used by this operation minus land area used by others.
Cropland is the total area of field crops, hay, field vegetables, fruits, berries, nuts, sod, nursery products and Christmas trees.
Farm type is established through a procedure that classifies each census farm according to the predominant type of production. This is done by estimating the potential revenues from the inventories of crops and livestock reported on the questionnaire and determining the product or group of products that make up the majority of the estimated receipts. For example, a census farm with total potential revenues of 60% from hogs, 20% from beef cattle and 20% from wheat, would be classified as a hog and pig farm. The farm types presented in this document are derived based on the 2017 NAICS.
Farm operator refers to any person responsible for the management decisions in operating a farm or agricultural operation. Also known as an agricultural operator, farmer, operator or rancher.
Farm employees include both farm operators and agricultural workers.
Price indexes were used to obtain constant dollar estimates of sales, export values and farm assets in order to eliminate the impact of price change in year-to-year comparisons.
Farm operating revenues
Farm operating revenues come from the Agriculture Taxation Data Program (ATDP). Previously, revenues for agricultural operations were reported to the Census of Agriculture. Caution should be taken when comparing the 2021 Census of Agriculture data with previous censuses.
The Census of Agriculture measures farm operating revenues (in current dollars) for the calendar or accounting year prior to the census. Farm operating revenues (before deducting expenses) in this analysis include: operating revenues from all agricultural products sold, program payments and custom work revenues.
The following are not included in farm operating revenues: sales of forestry products (for example: firewood, pulpwood, logs, fence posts and pilings); sales of capital items (for example: quota, land, machinery); and revenues from the sale of any goods purchased only for retail sales.
Total operating expenses
Total operating expenses come from the ATDP. Previously, expenses for agricultural operations were reported to the Census of Agriculture. Caution should be taken when comparing the 2021 Census of Agriculture data with previous censuses.
The Census of Agriculture measures operating expenses (in current dollars) for the calendar or accounting year prior to the census. Total operating expenses include any expense associated with producing agricultural products (such as the cost of seed, feed, fuel, fertilizers).
The following are not included in total operating expenses: the purchase of land, buildings or equipment, and depreciation or capital cost allowance. Depreciation represents economic "wear and tear" expense. Capital cost allowance represents the amount of depreciation written off by the tax filer as allowed by tax regulations.
Expenses-to-revenues ratio
The expenses-to-revenues ratio is the average amount of operating expenses incurred for a dollar in farm operating revenues. The ratio is calculated in current dollars.
Census Day was May 11, 2021. Farmers were asked to report their operating revenues and expenses for the last complete fiscal or calendar year (2020).
Full-time employment is classified as farm operators who worked 30 hours or more per week; part-time employment is classified as farm operators who worked less than 30 hours per week.
Some data refer to a reference period other than Census Day. For example, for financial data the reference period is the calendar or accounting (fiscal) year prior to the census.
- Date modified: