
Canadian Agriculture at a Glance
Vegetable and melon farms make up the biggest share of farms in Newfoundland and Labrador
by Michelle St. Pierre and Mike McComb
Skip to text
Text begins
Correction notice
On February 3, 2023, a correction was made to the following sentence in the section “More farms in Newfoundland and Labrador are producing renewable energy”: “The most frequently reported type of renewable energy production was solar energy, which was produced by 5.5% of farms in 2021.” The “5.5%” value replaced the “5.2%” value previously published.
Farming in Newfoundland and Labrador has faced many challenges, in part because of the province’s geography, climate and soil conditions. Despite this, vegetable and melon farming has played a major role in the province’s primary agriculture, as indicated in data from the 2021 Census of Agriculture.
In 2021, nearly a quarter (23.5%) of total farms reported in Newfoundland and Labrador were classified as vegetable and melon. The next most frequently reported farm type was greenhouse, nursery and floriculture (16.3%).
By farm type, the number of vegetable and melon farms increased 3.8% from the previous census, though the total number of farms reported in the province decreased by 15.5% from 2016, for a total of 344 farms in 2021.
In Newfoundland and Labrador, farms reporting field vegetables (including those farms classified as vegetable and melon farms) primarily grew carrots, rutabagas and turnips, and cabbages. These commodities were the top three contributors in terms of both acres and number of farms, with carrots comprising 213 acres from 95 farms, rutabagas and turnips comprising 195 acres from 89 farms, and cabbages comprising 127 acres from 90 farms.
One factor impacting field vegetable farming in Newfoundland and Labrador (and across Canada) has been the increase in prices for fresh vegetables. The Farm Product Price Index indicates that fresh vegetables (except potatoes and pulse crops) in Canada saw a 22.6% increase from 2016 to 2021.
In a similar vein, the number of farms that reported growing the top three field vegetables in Newfoundland and Labrador also increased over the past five years. The number of farms growing cabbage increased 25.0% from 2016 to 2021, followed by the number of farms growing rutabagas and turnips (+12.7%), and carrots (+4.4%).
Beef farms and feedlots make up the biggest portion of total farm area
While accounting for 12.8% of the total number of farms in the province, in 2021, farms classified as beef and feedlots made up over a third (37.1%) of total farm area reported in Newfoundland and Labrador. This was a small decrease from 38.8% in 2016. In Canada, beef and feedlots accounted for 27.9% of total farm area reported in 2021.
| Farm count | Farm area | |
|---|---|---|
| percent | ||
| Dairy and milk production | 7.8 | 24.5 |
| Beef farming and feedlots | 12.8 | 37.1 |
| Hog and pig farming | 0.3 | 0.1 |
| Poultry and egg production | 5.5 | 2.5 |
| Sheep and goat farming | 6.1 | 2.4 |
| Other animal production | 5.5 | 2.3 |
| Oilseed and grain farming | 0.3 | 0.7 |
| Vegetable and melon farming | 23.5 | 8.2 |
| Fruit and tree nut farming | 8.7 | 6.6 |
| Greenhouse, nursery and floriculture production | 16.3 | 6.2 |
| Other crop farming | 13.1 | 9.5 |
| Source: Statistics Canada, Census of Agriculture, 2021 (3438). | ||
The total farm area reported in Newfoundland and Labrador decreased by 30.1% from the previous census, to 49,425 acres in 2021. This was a greater decrease than the number of farms (-15.5%), and the average farm area declined from 174 acres per farm in 2016 to 144 acres per farm in 2021 as a result.
While there were declines in all types of land use in Newfoundland and Labrador, cropland declined by the smallest percentage amount from 2016 and 2021 (-2.5%). Cropland made up 39.0% of farm area (19,298 acres) in the province in 2021, up from 28.0% in 2016. The largest absolute decrease in farm area came from woodlands and wetlands, which declined by 7,484 acres from 2016 to 10,660 acres in 2021. Despite this decrease, woodlands and wetlands still accounted for 21.6% of total farm area in the province.
Dairy and poultry farms lead farm operating revenues and expenses
In Newfoundland and Labrador, farms classified as dairy and milk accounted for the largest proportion of total farm operating revenues, followed by poultry and egg farms. In 2020, dairy and milk farms accounted for 38.0% of farm operating revenues reported in the province. This was followed by farms classified as poultry and egg production, and greenhouse, nursery and floriculture operations.

Data table for Chart 1
| Revenues | Expenses | |
|---|---|---|
| percent | ||
| Dairy and milk production | 38.0 | 39.1 |
| Poultry and egg production | 34.4 | 31.3 |
| Greenhouse, nursery and floriculture production | 8.1 | 8.0 |
| Source: Statistics Canada, Census of Agriculture, 2021 (3438). | ||
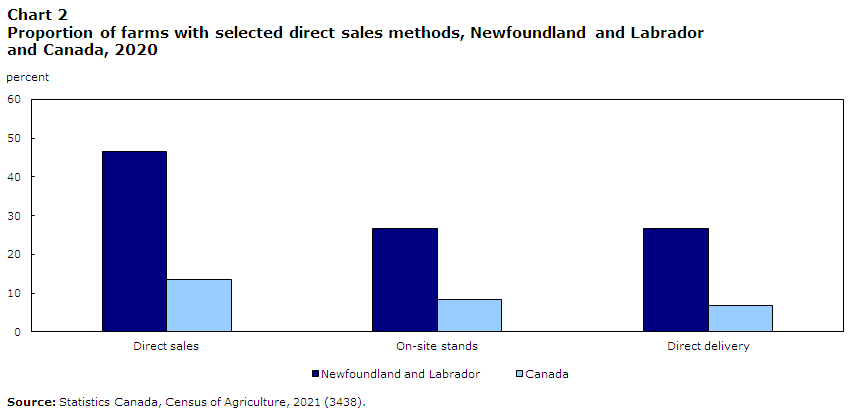
Newfoundland and Labrador is a leader in direct sales
As was the case in the previous census, farms in Newfoundland and Labrador reported the highest rate of direct sales among provinces in Canada. In 2020, nearly half (46.5%) of the farms in the province reported direct sales, up from 34.2% in 2015. The province with the next highest rate of direct sales was British Columbia, where 34.0% of farms sold directly to consumers.
One reason why direct sales were so frequently reported in Newfoundland and Labrador is because a significant number of vegetable and melon farms, the largest classification of farms in the province, reported direct sales (66.7%).
In 2020, the most frequently reported methods of direct sales in Newfoundland and Labrador were on-site farm stands and direct deliveries, which were used by 92 farms (26.7%). For both methods, this represents a higher proportion of farms than in any other province, and above the national averages (8.2% and 6.8%).
Data table for Chart 2
| Direct sales | On-site stands | Direct delivery | |
|---|---|---|---|
| percent | |||
| Newfoundland and Labrador | 46.5 | 26.7 | 26.7 |
| Canada | 13.6 | 8.2 | 6.8 |
| Source: Statistics Canada, Census of Agriculture, 2021 (3438). | |||
More farms in Newfoundland and Labrador are producing renewable energy
In 2021, 8.7% of all farms in Newfoundland and Labrador reported renewable energy production. While this was lower than the average in Canada (11.9%), it was an increase from the previous census, when 1.7% of farms in the province reported renewable energy production. The most frequently reported type of renewable energy production was solar energy, which was produced by 5.5% of farms in 2021.
Newfoundland and Labrador above average in testing soil samples and using slow-release fertilizer
A soil sample test is used to gather information about the level of nutrients in the soil. In 2020, almost two-fifths (38.1%) of farms in Newfoundland and Labrador reported using a soil sample test. This was higher than what was reported across Canada (32.0%).
Farms in Newfoundland and Labrador also reported an above-average rate of slow-release fertilizer, with 27.0% of farms in the province using slow-release fertilizer, compared with 23.4% of farms in Canada. A slow-release fertilizer is a special fertilizer that gradually releases nutrients into the soil.
Newfoundland and Labrador farms less likely to have a succession plan
Despite operators being older than in the rest of the country on average, farms in Newfoundland and Labrador were less likely to report that they had a succession plan. In 2021, less than one tenth (9.3%) of farms in Newfoundland and Labrador reported a succession plan. This was higher than in 2016 (5.7%), but lower than the Canadian average (12.0%). As was the case across Canada, farms reporting $100,000 and over in revenues were more likely to report a succession plan in Newfoundland and Labrador.
One possible reason for the difference in succession plan rates could be because Newfoundland and Labrador reported a smaller proportion of farms with revenues of $100,000 and over. In 2020, nearly a third (32.6%) of farms in the province reported revenues of $100,000 and over, compared with 44.2% of farms in Canada.
The average age of farm operators in Newfoundland and Labrador is increasing
In 2021, the average age reported for farm operators in Newfoundland and Labrador was 57.5 years old, up from 55.8 in 2016, and higher than the Canadian average of 56.0.
Almost two-thirds of farm operators (65.6%) in Newfoundland and Labrador were aged 55 years and older, higher than 58.2% in 2016. In Canada, 60.5% of all farm operators were aged 55 years and older.
In 2021, 28.9% of farm operators in Newfoundland and Labrador were aged 35 to 54, just below the Canadian average of 30.9%. Farm operators younger than 35 years old accounted for 3.3% of farm operators in the province, which was lower than the rate across Canada (8.6%).
While there are fewer farm operators in Newfoundland and Labrador, a higher proportion of them are female
The total number of farm operators reported in the province decreased 9.6% from 2016 to 450 farm operators in 2021. Conversely, the proportion of female farm operators in Newfoundland and Labrador increased to just over a quarter (25.6%) of total farm operators, up from 23.0% in 2016. However, this was still below the national level (30.4%).
While more farm operators are working off the farm, they work fewer hours than before
In 2020, 47.8% of farm operators in Newfoundland and Labrador reported off-farm work, up from 41.0% in 2015. This is very close to the Canadian average, where just under half (47.7%) of total farm operators reported off-farm work.
While farm operators were more likely to work off the farm in 2020, they were also less likely to work full time off the farm than in the previous census. Of those who worked off the farm in Newfoundland and Labrador, 69.8% worked more than 30 hours a week, down from 79.4% in 2015, but still above the Canadian average of 66.0%. At the same time, of those working off the farm, the share working less than 20 hours a week off the farm was 23.3% in 2020, up from 10.3% in 2015, and above the Canadian average of 22.1%.
Of all provinces, Newfoundland and Labrador had the highest proportion of farm operators working 40 hours or more off the farm, and the lowest proportion working 30 to 39 hours off the farm.

Data table for Chart 3
| More than 40 hours | 30 to 40 hours | 20 to 29 hours | Less than 20 hours | |
|---|---|---|---|---|
| percent | ||||
| 2015 | 50.0 | 29.4 | 10.3 | 10.3 |
| 2020 | 41.9 | 27.9 | 7.0 | 23.3 |
|
Note: Totals may not equal 100% due to rounding. Sources: Statistics Canada, Census of Agriculture, 2016 and 2021 (3438). |
||||
Definitions and concepts
A significant conceptual change to the main statistical unit used by Statistics Canada’s Agriculture Statistics Program has been introduced for the 2021 Census of Agriculture: a “farm” or an “agricultural holding” (i.e., the census farm) now refers to a unit that produces agricultural products and reports revenues or expenses for tax purposes to the Canada Revenue Agency. Before 2021, a “farm” was defined as an agricultural operation that produced at least one agricultural product intended for sale
In 2021, there have been changes to the definition of a census farm; in Yukon and Northwest Territories, some activities that were previously included within the definition are not included in 2021. Caution should be taken when comparing the 2021 Census of Agriculture data with data from previous censuses.
The data displayed by geography have undergone random tabular adjustment. The Canada total data for geographic breakdowns may differ from the Canada total data displayed in tables by North American Industry Classification System (NAICS) category and sales class.
The data for Yukon and the Northwest Territories are not included in the national totals; they are presented separately.
The Census of Agriculture is conducted every five years and is a census of all agricultural operations that produces agricultural products and reports revenues or expenses for tax purposes to the Canada Revenue Agency. Important concepts used in this analysis include:
Total farm area, which is land owned or operated by an agricultural operation, includes: cropland, summer fallow, improved and unimproved pasture, woodlands and wetlands, all other land (including idle land and land on which farm buildings are located).
Total farm area includes the total area of land owned, leased, rented, crop-shared or used by this operation minus land area used by others.
Cropland is the total area of field crops, hay, field vegetables, fruits, berries, nuts, sod, nursery products and Christmas trees.
Farm type is established through a procedure that classifies each census farm according to the predominant type of production. This is done by estimating the potential revenues from the inventories of crops and livestock reported on the questionnaire and determining the product or group of products that make up the majority of the estimated receipts. For example, a census farm with total potential revenues of 60% from hogs, 20% from beef cattle and 20% from wheat, would be classified as a hog and pig farm. The farm types presented in this document are derived based on the 2017 NAICS.
Farm operator refers to any person responsible for the management decisions in operating a farm or agricultural operation. Also known as an agricultural operator, farmer, operator or rancher.
Farm employees include both farm operators and agricultural workers.
Price indexes were used to obtain constant dollar estimates of sales, export values and farm assets in order to eliminate the impact of price change in year-to-year comparisons.
Farm operating revenues
Farm operating revenues come from the Agriculture Taxation Data Program (ATDP). Previously, revenues for agricultural operations were reported to the Census of Agriculture. Caution should be taken when comparing the 2021 Census of Agriculture data with previous censuses.
The Census of Agriculture measures farm operating revenues (in current dollars) for the calendar or accounting year prior to the census. Farm operating revenues (before deducting expenses) in this analysis include: operating revenues from all agricultural products sold, program payments and custom work revenues.
The following are not included in farm operating revenues: sales of forestry products (for example: firewood, pulpwood, logs, fence posts and pilings); sales of capital items (for example: quota, land, machinery); and revenues from the sale of any goods purchased only for retail sales.
Total operating expenses
Total operating expenses come from the ATDP. Previously, expenses for agricultural operations were reported to the Census of Agriculture. Caution should be taken when comparing the 2021 Census of Agriculture data with previous censuses.
The Census of Agriculture measures operating expenses (in current dollars) for the calendar or accounting year prior to the census. Total operating expenses include any expense associated with producing agricultural products (such as the cost of seed, feed, fuel, fertilizers).
The following are not included in total operating expenses: the purchase of land, buildings or equipment, and depreciation or capital cost allowance. Depreciation represents economic "wear and tear" expense. Capital cost allowance represents the amount of depreciation written off by the tax filer as allowed by tax regulations.
Expenses-to-revenues ratio
The expenses-to-revenues ratio is the average amount of operating expenses incurred for a dollar in farm operating revenues. The ratio is calculated in current dollars.
Census Day was May 11, 2021. Farmers were asked to report their operating revenues and expenses for the last complete fiscal or calendar year (2020).
Full-time employment is classified as farm operators who worked 30 hours or more per week; part-time employment is classified as farm operators who worked less than 30 hours per week.
Some data refer to a reference period other than Census Day. For example, for financial data the reference period is the calendar or accounting (fiscal) year prior to the census.
- Date modified: