
Police-reported crime in rural and urban areas in the Canadian provinces, 2024
Highlights
- In 2024, the majority of Criminal Code (excluding traffic) offences in the provinces occurred in urban areas, i.e., census metropolitan areas (CMAs) or census agglomerations (CAs). However, 19% of crimes were recorded in rural areas (outside CMAs or CAs), even though these areas account for 14% of the population in the provinces. In 2014 also, about one in five crimes were reported in rural areas, but these areas accounted for 16% of the population at the time.
- When factoring in population size, the crime rate in rural areas was 42% higher than the rate in urban areas. In rural areas, the crime rate stood at 7,421 incidents per 100,000 population in 2024, compared with 5,235 incidents per 100,000 population in urban areas. Ten years earlier, in 2014, this gap was 29%.
- The police-reported crime rate in rural areas increased from 7,386 incidents per 100,000 population in 2023 to 7,421 incidents per 100,000 population in 2024, making it a fourth consecutive annual increase. In contrast, the crime rate in urban areas decreased from 5,474 incidents per 100,000 population in 2023.
- The Crime Severity Index (CSI) takes into account both the number of offences and their severity. The rural CSI (100.6) was 38% higher than the urban CSI (72.7) in 2024.
- In 2009, the first year with comparable data, the violent CSI—which measures the volume and severity of violent crimes—was lower in rural areas (84.5) than in rural areas (95.3). The reverse was true 15 years later. In 2024, the violent CSI was 46% higher in rural areas (134.8) than in urban areas (92.5).
- Although they represented 14% of the population, rural areas accounted for 22% of violent crimes, 27% of Criminal Code traffic violations, 17% of property crimes, 23% of other Criminal Code offences and 21% of drug offences in 2024.
- For almost all types of police-reported crime, rates were higher in rural areas than in urban areas in 2024. Different types of theft, including robbery, were the main exceptions.
- In 2024, police reported 173 homicides in rural areas, for a rate of 2.92 homicides per 100,000 population. By comparison, police reported 605 homicides in urban areas, for a rate of 1.72 homicides per 100,000 population.
- From 2014 to 2024, the homicide rate for women in rural areas increased by 68% (from 1.16 to 1.96 incidents per 100,000 women) compared with 50% for men (from 2.55 to 3.83 incidents per 100,000 men). In 2024, women accounted for 57 of the 173 homicide victims in rural areas, a record since comparable data were first collected in 2009.
- The rate of police-reported intimate partner violence in rural areas was nearly double the urban rate (573 incidents per 100,000 population compared with 310 incidents per 100,000 population). The rate of intimate partner homicides in rural areas (0.41 incidents per 100,000 population) was also nearly twice as high as in urban areas (0.21 incidents per 100,000 population).
- In all the provinces, except Prince Edward Island and Ontario, crime rates were higher in rural areas than in urban areas. Saskatchewan (18,896 incidents per 100,000 population), Manitoba (14,164 incidents per 100,000 population) and Alberta (10,830 incidents per 100,000 population) had the highest rural crime rates among the provinces in 2024.
- The crime rate in the provincial rural North (17,766 incidents per 100,000 population) was more than three times higher than in the rural South (5,468 incidents per 100,000 population) and twice as high as the urban North (8,603 incidents per 100,000 population).
In Canada, most crimes occur in urban areas (Cotter, 2025; Perreault, 2023). Urban areas also have the highest levels of fear of crime (Ceccato, 2022; Cotter, 2025; David, 2023; Little et al., 2005; Perreault, 2019). However, crime levels have a modest impact on fear of crime, which is more a reflection of wide-ranging anxiety influenced by factors such as signs of social disorder, the presence of strangers or marginalized people, or unfamiliar places (Farrall et al., 2009; Fitzgerald, 2008; Lupton, 1999; Scott, 2003). Overall, residents of urban areas are more exposed to many factors known to undermine a sense of safety. For example, persons living in central neighbourhoods of metropolitan areas are more likely to observe signs of social disorder (Cotter, 2016) and to encounter strangers or unfamiliar places (Lupton, 1999) and marginalized people (Krausz et al., 2019).
Persons living in rural areasNote can also face certain factors that contribute to feeling unsafe, such as isolation or a low police presence (Canadian Municipal Network on Crime Prevention, 2020; Marshall & Johnson, 2005). Generally speaking, rural areas are well perceived, including by their residents, as quiet, peaceful and community-centred places (Bell, 2006; David, 2023; Donnermeyer & DeKeseredy, 2008; Lockie & Bourke, 2001), although their residents are slightly less likely to be satisfied with the work of the police, particularly in terms of responding quickly to calls or ensuring the safety of citizens (Ruddell & O’Connor, 2022).
A growing body of literature has highlighted factors that could contribute to crime in rural areas, such as remoteness or isolation; limited access to services, education and jobs; and gun culture, drug addiction and limited police resources (Ceccato, 2025; Canadian Municipal Network on Crime Prevention, 2020). Recent studies based on police data have also shown that, overall, crime is higher in rural areas than in urban areas in Canada, particularly in the northern parts of the provinces (Cotter, 2025; Perreault, 2023; Perreault, 2019; Savage et al., 2025). As a result, many initiatives have been implemented in recent years to combat crime in rural areas (Public Safety Canada, 2025a).
As in urban areas, crime can have significant impacts in rural areas. However, certain factors that are either specific to rural areas or are more pronounced may exacerbate some of these impacts, such as limited access to victim services and health care, stigmatization, the breakdown of social and family ties, and the reputation of communities (Ceccato, 2025; Canadian Municipal Network on Crime Prevention, 2020). Crime in rural areas also differs in several ways from crime in urban areas, including in terms of relationship between victims and offenders, the prevalence of certain types of crime or the presence of firearmsNote (Ceccato, 2025; Cotter, 2025; Perreault, 2023; Canadian Municipal Network on Crime Prevention, 2020; Savage et al. 2025).
Therefore, monitoring crime trends in rural areas is warranted, as these trends are otherwise overshadowed by urban trends in national statistics. This article, which is based on data from the Uniform Crime Reporting (UCR) Survey and the Homicide Survey, presents key trends in crime rates and the Crime Severity Index (CSI) for police-reported crime in rural areas of the Canadian provinces. This is an update of the Juristat article entitled “Police-reported crime in rural and urban areas in the Canadian provinces, 2021” (Perreault, 2023).
This Juristat article was produced with funding support from Public Safety Canada.
Start of text box 1
Text box 1
Definitions
Census metropolitan area (CMA) and census agglomeration (CA): A CMA or a CA is formed by one or more adjacent municipalities centred on a population centre (also known as the core). A CMA must have a total population of at least 100,000, of which 50,000 or more must live in the core. A CA must have a core population of at least 10,000. To be included in the CMA or CA, adjacent municipalities must have a high degree of integration with the core, as measured by commuting flows derived from census data. A CMA or CA may have more than one police service.
Rural area and urban area: For this article, rural areas include areas outside CMAs and CAs, while urban areas include CMAs and CAs. Crime data is reported at the police service level, thus police services are classified as rural when serving an area where most of the population lives outside a CMA or CA. Urban police services serve an area where most of the population lives within a CMA or CA. Urban areas geographies may not fully align with standard CMA and CA geographic units as they were adjusted to reflect policing boundaries. Consequently, some areas within a CMA or CA may be classified as “rural” if being served by a police service serving a predominantly rural population, and vice versa.
Provincial North (or northern regions): The Provincial North comprises Labrador and the northern regions of Quebec, Ontario, Manitoba, Saskatchewan, Alberta and British Columbia, according to the definition agreed on by the Northern Development Ministers Forum and used by the Conference Board of Canada’s Centre for the North (see Map 1). These northern boundaries generally reflect provincial administrative regions. For more information, see Statistics Canada, 2022 and Allen & Perreault (2015). In this article, the terms “provincial North”, “North” and “northern regions (or areas)” are used interchangeably.
Criminal incident: Includes all Criminal Code and other federal statute offences reported by police services. Incidents are categorized by the most serious violation in the incident. Police-reported statistics may be affected by differences in the way police services deal with minor offences. In some instances, police or municipalities might choose to deal with some minor offences using municipal by-laws or provincial provisions rather than Criminal Code provisions. Counts are based on the most serious violation in the incident.
Crime rate: The crime rate is the sum of all Criminal Code incidents reported by the police divided by the population. The crime rate excludes Criminal Code traffic violations and other federal statute violations, such as drug offences.
Crime Severity Index (CSI): The CSI takes into account the volume and the relative severity of crime. To calculate the police-reported CSI, each violation is assigned a weight. CSI weights are based on the violation’s incarceration rate and the average length of the prison sentence handed down by criminal courts. The more serious the average sentence, the higher the weight assigned to the offence, meaning that the more serious offences have a greater impact on the index. Unlike the traditional crime rate, all offences, including Criminal Code traffic violations and other federal statute violations, such as drug offences, are included in the CSI. To calculate the CSI, the weighted offences are summed then divided by the population. Like other indexes (e.g., the Consumer Price Index), to allow for ease of comparison, the CSI is then standardized to a base year of “100” (for the CSI, the base year is 2006). All CSI values are relative to the Canada-level CSI for 2006. CSI values are available back to 1998. For more information, see “Understanding and using the Crime Severity Index”.
End of text box 1
Nearly one in five crimes occurred in rural areas in 2024
In 2024, nearly 440,000 Criminal Code (excluding traffic) offences were reported by police services serving a predominantly rural population. This represented close to one in five (19%) police-reported incidents in the provinces in 2024. This proportion was also higher than the proportion of the population living in these areas (14%).
Although the majority of police-reported crimes in 2024 occurred in urban areas, when factoring in population size, the crime rate in rural areas was 42% higher than the rate in urban areas. In rural areas, the crime rate stood at 7,421 incidents per 100,000 population, compared with 5,235 incidents per 100,000 population in urban areas (Table 1).
When all Criminal Code and other federal statute offences—i.e., traffic violations, drug offences, and violations to federal statutes such as the Immigration and Refugee Protection Act or the Customs Act—are considered, the gap between rural and urban areas widens further. In 2024, rural police services reported 8,277 Criminal code or other federal statute violations per 100,000 population. This was 47% higher than the rate in urban areas (5,616 incidents per 100,000 population) (Table 1).
The crime rate in rural areas has risen for a fourth consecutive year
In 2024, the crime rate—which includes Criminal Code (excluding traffic) offences—in rural areas was slightly higher than in 2023. Although the increase was modest, with the rate rising from 7,386 incidents per 100,000 population in 2023 to 7,421 incidents per 100,000 population in 2024, it was a fourth consecutive annual increase. In contrast, the crime rate in urban areas fell from 5,474 incidents per 100,000 population in 2023 to 5,235 incidents per 100,000 population in 2024 (Chart 1).
Chart 1 start

Data table for Chart 1
| Year | Urban areas—all violations Data table for Chart 1 Note 1 | Rural areas—all violations Data table for Chart 1 Note 1 | Urban areas—crime rate Data table for Chart 1 Note 2 | Rural areas—crime rate Data table for Chart 1 Note 2 |
|---|---|---|---|---|
| rate per 100,000 population | ||||
Source: Statistics Canada, Canadian Centre for Justice and Community Safety Statistics, Uniform Crime Reporting Survey. |
||||
| 2014 | 5,404 | 7,239 | 4,748 | 6,136 |
| 2015 | 5,525 | 7,500 | 4,897 | 6,424 |
| 2016 | 5,575 | 7,641 | 4,963 | 6,550 |
| 2017 | 5,649 | 7,697 | 5,059 | 6,535 |
| 2018 | 5,780 | 7,596 | 5,225 | 6,516 |
| 2019 | 6,044 | 8,188 | 5,523 | 7,103 |
| 2020 | 5,375 | 7,950 | 4,903 | 6,963 |
| 2021 | 5,386 | 8,012 | 4,936 | 7,116 |
| 2022 | 5,707 | 8,297 | 5,290 | 7,192 |
| 2023 | 5,859 | 8,216 | 5,474 | 7,386 |
| 2024 | 5,616 | 8,277 | 5,235 | 7,421 |
Chart 1 end
In both rural and urban areas, crime rates were on the rise until the onset of the COVID-19 pandemic. In 2020, the rate declined in both rural and urban areas, with a stronger decrease in urban areas. Because of the lockdowns, business closures and the increase in telework during the pandemic, property crimes in Canada fell sharply. Specifically, the decrease in the number of shoplifting incidents and thefts of $5,000 or under contributed significantly to pulling in the crime rate downward in 2020 (Moreau, 2021). However, these crimes are much more common in urban areas.
Although crime rates in both rural and urban areas subsequently resumed an upward trend, crime rates in urban areas in 2024 remained below their pre-pandemic levels of 2019. In rural areas, the rate returned to its pre-pandemic level in 2021 (Chart 1).
The Crime Severity Index is also higher in rural areas
In Canada, two official measures of crime are typically used: the crime rate and the CSI. The crime rate measures the volume of crime (all Criminal Code violations, except traffic and other federal statute violations) relative to the population size, whereas the CSI measures the volume and severity of crime and includes all Criminal Code and other federal statute violations. CSI values are available back to 1998 (see Text box 1).
In 2024, the CSI in rural areas was 100.6, or 38% higher than the urban CSI the same year (72.7). This was up slightly from the rural CSI observed in 2023 (100.3) and marks the highest level since comparable data began being compiled in 2009. Note This also represented a 33% increase since 2014, when the CSI was at its lowest level on record (Chart 2).
Since comparable data began being compiled in 2009, the gap between the rural CSI and the urban CSI has widened. In 2009, the CSI was slightly higher in rural areas (89.6) than in urban areas (86.7).
Chart 2 start

Data table for Chart 2
| 2009 | 2010 | 2011 | 2012 | 2013 | 2014 | 2015 | 2016 | 2017 | 2018 | 2019 | 2020 | 2021 | 2022 | 2023 | 2024 | |
|---|---|---|---|---|---|---|---|---|---|---|---|---|---|---|---|---|
| crime severity index Data table for Chart 2 Note 1 | ||||||||||||||||
Source: Statistics Canada, Canadian Centre for Justice and Community Safety Statistics, Uniform Crime Reporting Survey. |
||||||||||||||||
| Urban CSI | 86.7 | 81.0 | 75.2 | 72.6 | 66.1 | 64.4 | 67.5 | 68.9 | 70.5 | 73.0 | 76.4 | 69.7 | 70.3 | 74.4 | 76.6 | 72.7 |
| Rural CSI | 89.6 | 88.6 | 85.9 | 86.3 | 79.5 | 75.8 | 81.6 | 85.0 | 85.8 | 85.5 | 93.2 | 91.8 | 94.4 | 96.9 | 100.3 | 100.6 |
| Urban Violent CSI | 95.3 | 89.5 | 84.9 | 80.1 | 71.8 | 68.4 | 72.8 | 73.3 | 77.6 | 79.8 | 85.1 | 81.3 | 86.1 | 92.1 | 93.6 | 92.5 |
| Rural Violent CSI | 84.5 | 83.2 | 85.0 | 86.7 | 81.4 | 77.9 | 83.8 | 91.0 | 95.6 | 97.7 | 111.5 | 117.3 | 126.1 | 130.0 | 134.4 | 134.8 |
Chart 2 end
In 2009, the violent Crime Severity Index was lower in rural areas than in urban areas, but the opposite was true in 2024
In 2024, the violent crime rate was 73% higher in rural areas than in urban areas. Police services serving predominantly rural populations reported 130,019 violent crimes in 2024, representing 2,197 incidents per 100,000 population, compared with 1,273 incidents per 100,000 population in urban areas. Thus, while rural areas account for 14% of the population in the provinces, they accounted for 22% of police-reported violent crimes in 2024 (Table 1, Chart 3).
Chart 3 start

Data table for Chart 3
| Type of offence Data table for Chart 3 Note 1 | Urban areas | Rural areas |
|---|---|---|
| rate per 100,000 population | ||
Source: Statistics Canada, Canadian Centre for Justice and Community Safety Statistics, Uniform Crime Reporting Survey. |
||
| Violent crime | 1,273 | 2,197 |
| Property crime | 3,085 | 3,694 |
| Other Criminal Code offences | 877 | 1,530 |
| Criminal Code traffic violations | 247 | 531 |
| Drug offences | 115 | 185 |
| Other federal statute violations | 19 | 141 |
Chart 3 end
In addition, the gap between rural and urban violent crime rates has widened in recent years. Both rural and urban areas have seen a considerable increase in violent crime rates since 2014. This is also the crime category that saw the sharpest increase during this period. However, the increase was more pronounced in rural areas (+46%) than in urban areas (+36%) (Table 1).
The violent CSI, which measures the volume and severity of violent crimes, showed a similar trend. Since reaching a low in 2014 (77.9), the violent CSI has risen steadily each year, peaking at 134.8 in 2024. However, the reported increase compared with 2023 (+0.3%) was the lowest annual increase since 2014. Although the violent CSI in urban areas has also increased since 2014, the annual increases have generally been smaller than those in rural areas. There were also two years of decline (2020 and 2024), during which the violent CSI in rural areas continued to rise (Chart 2).
As with violent crime rates, the gap between rural and urban CSIs has widened over time. In 2009, the violent CSI in rural areas (84.5) was 11% lower than the rate in urban areas (95.3). The reverse was true 15 years later when the violent CSI was 46% higher in rural areas (134.8) than in urban areas (92.5) (Chart 2).
The biggest rural–urban differences in Criminal Code offences are observed in traffic violations
Offences under the Criminal Code can be grouped into four broad categories: violent crimes (or crimes against the person), property crimes, traffic violations and other offences under the Criminal Code.
Among these categories, traffic violations showed the largest difference in rates between rural and urban areas in 2024. In rural areas, police services reported 31,408 traffic violations, including impaired driving, dangerous driving and failure to stop. This corresponds to 531 incidents per 100,000 population, more than double the rate recorded in urban areas (247 incidents per 100,000 population) (Table 1, Chart 3).
This difference in traffic violations between rural and urban areas was to be expected. According to the literature, the farther one is from city centres, the fewer alternatives there are to cars, and the greater the reliance on car use and distance travelled (Affordability Action Council, 2024; Laviolette, 2020; Turcotte, 2008).
Since 2014, traffic violations have decreased in both rural (-8%) and urban (-23%) areas. This decline is largely attributable to the decrease in alcohol-impaired driving incidents (Table 1).
The second-largest difference is observed in other Criminal Code offences
The category “other Criminal Code offences” includes all offences that do not fall into one of the other three categories. These include offences such as disturbing the peace, offences against the administration of justice (e.g., failure to appear in court, breach of probation), offences related to child sexual abuse and exploitation material (a term that has replaced “child pornography”),Note possession of weapons, and terrorism offences (e.g., participating in the activities of a terrorist group, harbouring or concealing a terrorist, inciting fear of terrorist activities).
The second-largest difference between rural and urban rates was found in this category of “other Criminal Code offences.” In 2024, police services serving predominantly rural populations reported 90,532 such incidents, representing 1,530 incidents per 100,000 population. This rate was 74% higher than that in urban areas, which was 877 incidents per 100,000 population. This difference was largely attributable to high rates of offences against the administration of justice, disturbing the peace and non-violent weapons offences (e.g., possession of weapons, unsafe storage of firearms, and firearm documentation and administration offences) in rural areas compared with urban areas (Table 1, Chart 3).
Considerably higher rates in rural areas were also noted for certain less frequent types of offences, such as threats to property or animals (37 incidents per 100,000 population in rural areas compared with 9.7 incidents per 100,000 population in urban areas) and trespassing at night (20 incidents per 100,000 population compared with 7.2 incidents per 100,000 population).
Rural police services reported approximately one in six property crimes
Property crimes are the most common crimes in the provinces. In 2024, these accounted for 57% of incidents comprising the crime rate and 53% of all offences under the Criminal Code and other federal statutes.
In 2024, police services serving predominantly rural populations reported 218,603 property crimes, accounting for approximately one in six property crimes reported in the provinces that year. Compared with other crime categories, this is the category for which the proportion of crimes reported in rural areas (17%) most closely aligns with the proportion of the population living in these areas (14%) (Table 1, Chart 3).
The rate of property crime was nevertheless slightly higher in rural areas (3,694 incidents per 100,000 population) than in urban areas (3,085 incidents per 100,000 population). Furthermore, since 2014, the rate of property crimes has increased more in rural areas (+13%) than in urban areas (+2%) (Table 1).
Start of text box 2
Text box 2
Crime in population centres
In this article, urban areas are defined as all areas that are part of a census metropolitan area (CMA) or census agglomeration (CA), while areas outside CMAs and CAs are considered rural (see Text box 1). However, it is generally recognized that the concepts of “urban” and “rural” exist on a continuum, ranging from the centres of large urban areas to the remotest and most isolated rural areas. To reflect this reality, Statistics Canada has also developed the concept of population centres. Population centres are defined as areas with a population of at least 1,000 and a population density of 400 persons or more per square kilometre. Population centres are classified into three groups, depending on the size of their population:
- small population centres, with a population of 1,000 to 29,999
- medium population centres, with a population of 30,000 to 99,999
- large urban population centres, with a population of 100,000 or more.
Population centres include all people living in the cores, secondary cores and fringes of CMAs and CAs, as well as those living in population centres outside CMAs and CAs. According to this classification, areas outside population centres are classified as rural areas.
As such, this classification is slightly different from the one used elsewhere in this article. For example, according to this classification, some areas classified as urban elsewhere in this article may be considered rural, particularly those within a CMA or CA but located outside their fringes. Conversely, some areas classified as rural elsewhere in this article may be considered part of the “population centre” category under this classification, notably small towns outside a CMA or CA.
Overall, police services primarily serving populations living outside a population centre reported a crime rate of 5,924 incidents per 100,000 population in 2024. This rate was 8% higher than that reported by police services mainly serving populations living in population centres (5,481 incidents per 100,000 population), a much narrower gap than when comparing CMAs or CAs with areas outside CMAs or CAs (i.e., urban and rural areas as defined elsewhere in this article) (Chart 4).
Chart 4 start

Data table for Chart 4
| Rate per 100,000 population | |
|---|---|
| Note: Data include Criminal Code violations, excluding traffic violations. Police services are classified according to where the majority of the population served by the police service lives. A population centre has a population of at least 1,000 and a population density of 400 persons or more per square kilometre, based on population counts from the current Census of Population. In this chart, all areas outside population centres are classified as rural areas. A census metropolitan area (CMA) or a census agglomeration (CA) comprises one or more adjacent municipalities centred on a population centre (known as the core). A CMA must have a total population of at least 100,000, of which 50,000 or more must live in the core. A CA must have a core population of at least 10,000. To be included in the CMA or CA, adjacent municipalities must be highly integrated with the core, as measured by commuting flows derived from census data. A CMA or CA may be served by more than one police service. Elsewhere in this article, CMAs and CAs are classified as “urban”, while areas outside CMAs and CAs are classified as “rural.” Rates are calculated per 100,000 population, and population counts are based on July 1 estimates from Statistics Canada’s Centre for Demography. Excludes data from the Royal Canadian Mounted Police’s Canadian Police Centre for Missing and Exploited Children, the British Columbia Integrated Child Exploitation Unit and the Canadian Forces Military Police Group.
Source: Statistics Canada, Canadian Centre for Justice and Community Safety Statistics, Uniform Crime Reporting Survey. |
|
| Total | |
| Rural areas | 5,924 |
| Population centre | 5,481 |
| Non-CMA or CA (rural as defined elsewhere in this article) | |
| Rural areas | 6,522 |
| Population centre | 11,063 |
| CMA or CA (urban as defined elsewhere in this article) | |
| Rural areas | 4,218 |
| Population centre | 5,286 |
Chart 4 end
These differing results, depending on the definitions used, can be explained in part by the low crime rates recorded in areas of CMAs or CAs outside of population centres, i.e., 4,218 incidents per 100,000 population in 2024 (Chart 4). These areas may share certain characteristics with other rural areas, such as a low police presence, low population density, or remoteness from immediate neighbours. However, they have access to the services, institutions and jobs of the urban cores from which they form the “rural fringe.”
In contrast, population centres located outside CMAs or CAs recorded high crime rates in 2024, with a total of 11,063 incidents per 100,000 population (Chart 4). These areas include communities with populations ranging from 1,000 to 9,999 located outside large urban cores. Several of these communities are gateways to vacation areas. Crime rates—calculated based on the size of the resident population rather than the ambient populationNote —may overestimate the extent of crime in these areas. In addition, many population centres outside CMAs or CAs are in the Provincial North, where crime rates are generally higher.Note
End of text box 2
In nearly every province, crime is higher in rural areas than in urban areas
When police-reported data were disaggregated by rural and urban areas for the first time in 2017, rural crime was primarily an issue in the Prairie provinces and, to a lesser extent, in Newfoundland and Labrador. In all other provinces, the crime rate in rural areas was either roughly equal to or lower than that in urban areas (Perreault, 2019).
The situation today is very different. While rural areas in the Prairie provinces and Newfoundland and Labrador continue to show the largest gaps in crime rates compared with urban areas, crime is now higher in rural areas in nearly every province. In 2024, only the rural areas in Prince Edward Island and Ontario still had crime rates lower than those in urban areas (Table 2).
From 2014 to 2024, crime rates have increased more in rural than in urban areas in almost every province. Only Ontario and Manitoba recorded a higher increase in crime rates in urban areas during this period. The rural areas of New Brunswick (+72%), Newfoundland and Labrador (+64%), and Prince Edward Island (+49%) recorded the highest growth in crime rates since 2014 (Table 2).
Violent crime rates also increased more in rural areas than in urban areas in most provinces during the same period. Rural areas in New Brunswick (+92%) Quebec (+90%) and Prince Edward Island (+83%) recorded a considerable increase in the violent crime rate (Table 2, Table 3).
In 2024, Saskatchewan (18,896 incidents per 100,000 population), Manitoba (14,164 incidents per 100,000 population) and Alberta (10,830 incidents per 100,000 population) had the highest rates of police-reported crime in rural areas among the provinces. In contrast, rural areas in Quebec (3,907 incidents per 100,000 population) and Ontario (4,212 incidents per 100,000 population) had the lowest rates (Table 2).
Chart 5 start

Data table for Chart 5
| Newfoundland and Labrador | Prince Edward Island | Nova Scotia | New Brunswick | Quebec | Ontario | Manitoba | Saskatchewan | Alberta | British Columbia | All provinces | |
|---|---|---|---|---|---|---|---|---|---|---|---|
| crime severity index Data table for Chart 5 Note 1 | |||||||||||
Source: Statistics Canada, Canadian Centre for Justice and Community Safety Statistics, Uniform Crime Reporting Survey. |
|||||||||||
| Urban areas | 77.3 | 76.2 | 72.6 | 78.4 | 61.4 | 60.7 | 126.6 | 125.7 | 86.3 | 92.0 | 72.7 |
| Rural areas | 104.3 | 65.9 | 82.0 | 96.2 | 71.7 | 61.1 | 180.6 | 219.4 | 141.9 | 93.0 | 100.6 |
| percent change from 2014 to 2024 | |||||||||||
| Urban areas | 13 | 18 | 7 | 36 | 5 | 22 | 49 | 9 | 7 | 1 | 13 |
| Rural areas | 88 | 64 | 27 | 80 | 32 | 16 | 46 | 51 | 24 | 17 | 33 |
Chart 5 end
When the seriousness of crimes is taken into account, the trends are broadly similar to those shown by crime rates. In most provinces, however, the gap between rural and urban areas is narrower, suggesting that certain low-severity crimes contribute more to the rural crime rate than the urban rate. In Ontario, however, the opposite is true. While the crime rate is lower in rural areas, the rural CSI is roughly equal to the urban CSI (Chart 5, Table 4).
Start of text box 3
Text box 3
Rural crime in the territories
Overall, crime in the territories is relatively high compared with what is recorded in the provinces (Statistics Canada, 2025). The population of the territories represented approximately 0.3% of the Canadian population but accounted for 2.4% of Criminal Code (excluding traffic) offences in 2024.
Two census agglomerations (CAs) in the territories meet the definition of an urban area used in this article: Whitehorse and Yellowknife, the capitals of Yukon and the Northwest Territories, respectively. Although Iqaluit’s population (nearly 8,500) does not meet the threshold required to be a CA (10,000 or more), Nunavut’s capital remains the territory’s largest population centre and main service centre. As such, for this analysis, the three capitals will be compared with other communities in the territories. Together, the three capitals account for just over half of the population of the territories. However, this proportion varies from one territory to another: 83% in Yukon, 50% in the Northwest Territories and 20% in Nunavut.
The 2024 Crime Severity Index (CSI) values were lower in territorial capitals than in other communities in Yukon and the Northwest Territories, similar to the differences observed between urban and rural areas in the provinces. The gap between the capitals and other communities in these territories has also widened in recent years. Since 2014, the CSI has increased by 9% in Whitehorse, but by 21% in other Yukon communities. In the Northwest Territories, the increase was 58% in Yellowknife, but 99% in other communities (Chart 6).
The situation was completely different in Nunavut, where the CSI was significantly higher in Iqaluit (639.0) than in all other communities in the territory (357.6). Furthermore, this gap has widened, as the CSI in Iqaluit has increased by 67% since 2014, while it has increased by 39% in other communities across the territory (Chart 6).
Chart 6 start

Data table for Chart 6
| Capitals | Non-capitals | |||
|---|---|---|---|---|
| Index | Percent change from 2014 to 2024 | Index | Percent change from 2014 to 2024 | |
| crime severity index Data table for Chart 6 Note 1 | ||||
Source: Statistics Canada, Canadian Centre for Justice and Community Safety Statistics, Uniform Crime Reporting Survey. |
||||
| Yukon | ||||
| CSI | 170.7 | 9 | 402.4 | 21 |
| Violent CSI | 176.5 | -12 | 450.1 | 9 |
| Northwest Territories | ||||
| CSI | 317.4 | 58 | 735.1 | 99 |
| Violent CSI | 363.2 | 151 | 778.8 | 96 |
| Nunavut | ||||
| CSI | 639.0 | 67 | 357.6 | 39 |
| Violent CSI | 843.6 | 111 | 599.0 | 31 |
| All territories | ||||
| CSI | 274.5 | 36 | 497.6 | 60 |
| Violent CSI | 317.2 | 53 | 644.6 | 50 |
Chart 6 end
The difference in crime levels between capital cities and other communities was also observed for violent crime. The violent CSI in Whitehorse (176.5) and Yellowknife (363.2) was less than half the violent CSI reported in other communities in their territories (450.1 in Yukon and 778.8 in the Northwest Territories). Once again, the situation in Nunavut was reversed, with a violent CSI of 843.6 in Iqaluit and 599.0 for other communities in the territory. Since 2014, the violent CSI has increased by 111% in Iqaluit and 151% in Yellowknife. However, it declined in Whitehorse (-12%) during the same period.
From 2014 to 2024, police reported 73 homicides (representing an average annual rate of 10.92 homicides per 100,000 population) and 60 attempted murders (8.97 incidents per 100,000 population) in all communities outside the capitals, compared with 40 homicides (5.69 incidents per 100,000 population) and 32 attempted murders (4.55 incidents per 100,000 population) in the capitals.
In 2024, mischief was the most common offence in the territories. As in the provinces, where the rate of mischief was nearly three times higher in rural areas than in urban areas, the rate of mischief reported by the police was much higher outside capital cities (24,045 incidents per 100,000 population) than in capital cities (12,479 incidents per 100,000 population). Disturbing the peace ranked as the second most common offence, both outside capital cities (7,804 incidents per 100,000 population) and within them (6,043 incidents per 100,000 population) (Table 5).
The rates outside the capital cities were highest, compared with rates within capitals, for violent firearm-specific offences, aggravated assaults, and driving while impaired by alcohol or by alcohol and drugs. In contrast, several property crimes showed lower rates outside the capitals in 2024, specifically for most theft offences (theft under $5,000, theft of $5,000 or more, shoplifting, possession of stolen goods) and fraud offences (Table 5).
End of text box 3
Those living in rural areas are more likely to live in an area with either a very high or very low crime rate
Rural areas are not uniform; rather, they are diverse and complex, with differences across a wide range of socioeconomic indicators (DeKeseredy, 2020; Gallent & Gkartzios, 2019; Halfacree, 2006). Some communities are particularly remote, while others are near large population centres and have access to a wider range of services. Some communities have economies that are primarily focused on agriculture, while others have economies based on natural resources or tourism and vacation resorts. Some communities are experiencing economic or population decline, while others are attracting large numbers of retirees or dealing with the effects of an economic or population boom.
This heterogeneity can also be observed in crime rates. Compared with the urban population, those living in rural areas are more likely to live in communities with crime rates at either end of the spectrum, i.e., very low or very high. For example, 6.4% of the rural population lived in communities with a crime rate of less than 2,000 crimes per 100,000 population, compared with 2.0% of the urban population. In contrast, 11% of the rural population lived in communities with crime rates above 12,000 crimes per 100,000 population, compared with 2.0% of the urban population (Chart 7).
Chart 7 start

Data table for Chart 7
| Crime rate (number of incidents per 100,000 population) | |||||
|---|---|---|---|---|---|
| Fewer than 2,000 | 2,000 to 3,499 | 3,500 to 6,499 | 6,500 to 11,999 | 12,000 or more | |
| percent | |||||
| Note: Includes Criminal Code offences, excluding traffic violations. Urban police services serve an area where the majority of the population lives within a census metropolitan area (CMA) or census agglomeration (CA). Rural police services serve an area where the majority of the population lives outside a CMA or CA. A CMA or a CA comprises one or more adjacent municipalities centred on a population centre (known as the core). A CMA must have a total population of at least 100,000, of which 50,000 or more must live in the core. A CA must have a core population of at least 10,000. To be included in the CMA or CA, adjacent municipalities must be highly integrated with the core, as measured by commuting flows derived from census data. A CMA or CA may be served by more than one police service. Rates are calculated per 100,000 population, and population counts are based on July 1 estimates from Statistics Canada’s Centre for Demography. Excludes data from the Royal Canadian Mounted Police’s Canadian Police Centre for Missing and Exploited Children, the British Columbia Integrated Child Exploitation Unit and the Canadian Forces Military Police Group.
Source: Statistics Canada, Canadian Centre for Justice and Community Safety Statistics, Uniform Crime Reporting Survey. |
|||||
| Urban population | 2 | 23 | 57 | 16 | 2 |
| Rural population | 6 | 33 | 32 | 17 | 11 |
Chart 7 end
Although urban areas are highly diverse, with significant differences in size and population density, they are much more homogeneous than rural areas in terms of crime. Nearly 6 in 10 people living in urban areas (57%) lived in a community with a crime rate between 3,500 and 6,500 incidents per 100,000 population. By comparison, slightly less than one-third (32%) of those living in rural areas lived where the crime rate fell within this range (Chart 7).
These results suggest that an analysis based solely on a dichotomous comparison, where all rural areas are compared with all urban areas, would not capture the very diverse realities of different areas, especially rural ones. These specific characteristics can only be partially explored in an article such as this, which focuses primarily on major trends at the national level. In the next section, this issue is examined further by breaking down the data for urban and rural areas according to whether they are in the southern or northern parts of the provinces.
Crime rates are higher in the Provincial North than in the southern parts of the provinces
According to the definition agreed on by the Northern Development Ministers Forum and used by the Conference Board of Canada’s Centre for the North, the Provincial North comprises Labrador and the northern regions of Quebec, Ontario, Manitoba, Saskatchewan, Alberta and British Columbia (Map 1). For more information on this definition, see Statistics Canada (2022) and Allen & Perreault (2015).
In 2024, just over 5% of the population of the provinces lived in the North. However, they accounted for a larger proportion of the rural population (16%) than of the urban population (3.7%).
Map start
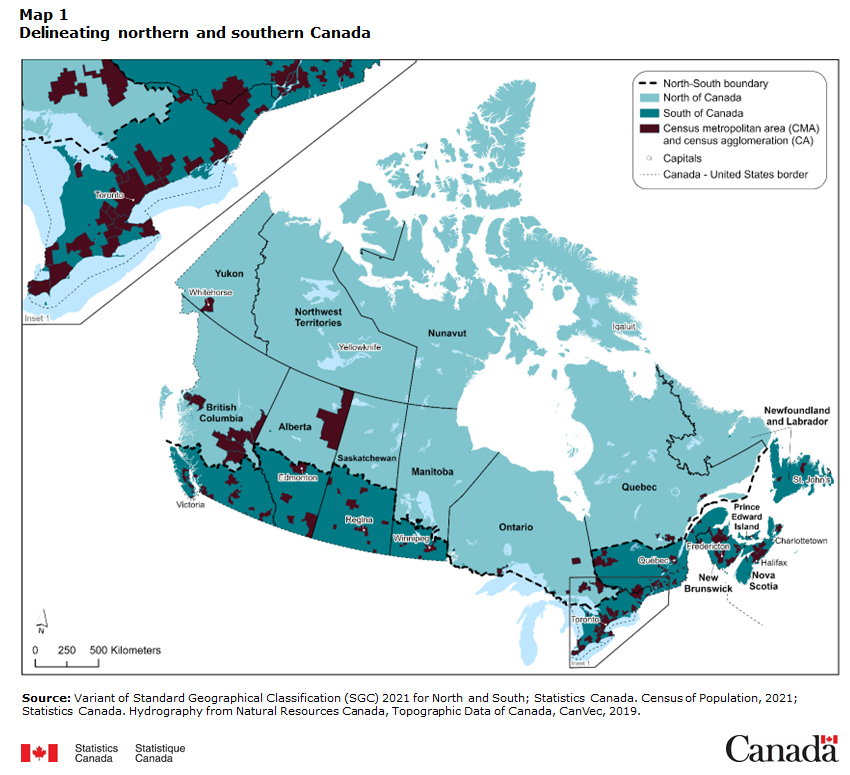
Description for Map
The heavy dashed black line indicates the boundary between the North and the South within the provinces. The light teal area represents the North and encompasses the Territories as well as the northern regions of Newfoundland and Labrador, Quebec, Ontario, Manitoba, Saskatchewan, Alberta, and British Columbia. The dark aquamarine area represents the South and encompasses the southern regions of these provinces and includes all of Prince Edward Island, Nova Scotia and New Brunswick.
The dark brown areas indicate the census metropolitan areas (CMAs) and the census agglomerations (CAs).
The boundaries between the provinces and the territories are indicated with solid black lines. The locations and names of the capitals in each province and territory are included in the map. The light dashed black line indicates the Canada – United States border.
Source: Variant of Standard Geographical Classification (SGC) 2021 for North and South; Statistics Canada (Statistics Canada, Variant of Standard Geographical Classification (SGC) 2021 for North and South). Census of Population, 2021; Statistics Canada. Hydrography from Natural Resources Canada, Topographic Data of Canada, CanVec, 2019.
Map 1 end
Communities in the Provincial North have a very different socioeconomic and demographic profile from those in the southern parts of the provinces, and this is even more true for rural areas. Specifically, certain socioeconomic issues are more significant in the Provincial North than in the southern parts of the provinces, such as higher unemployment and poverty rates, lower school enrolment rates, residential instability, inadequate or insufficient infrastructure, and substance abuse, all of which are known to influence crime (Ceccato & Abraham, 2022; Kitchen 2006; Sapp, 2023; Savage et al., 2025; Ukert et al., 2018).
Additionally, there are also higher proportions of First Nations people, Métis and Inuit in the Provincial North, many of whose communities face high rates of crime or criminal victimization (Allen, 2020; Boyce, 2016; Perreault, 2022). This reality is inextricably linked to the historical and ongoing effects of colonial and assimilation policies that have been detrimental to Indigenous Peoples, contributing to their economic marginalization and causing significant intergenerational trauma, in which violence takes roots (Aguiar & Halseth, 2015; Bombay et al., 2014; Comack, 2018; Truth and Reconciliation Commission, 2015, Department of Justice Canada, 2025). On the other hand, Indigenous communities may be better able to offer culturally relevant services and support, as well as access to culture and traditions; while services in urban settings are more likely to offer mainstream, colonial infrastructures, with few Indigenous-specific supports, which can be a barrier for accessing services (Murdock, 2024).
Recently, a study of a cohort of persons accused of crime also revealed a particularly high rate of reoffending in the rural North (Savage, 2025). Specifically, 28% of persons accused of a crime in rural areas of the Provincial North in 2014 had further contact with the police—that is, they were identified as persons accused of a crime—in at least 10 other incidents over the following nine years. By comparison, this proportion was 13% in urban areas in the southern parts of the provinces (Chart 8). In other words, a small number of people are responsible for a disproportionate share of crime, particularly in rural areas in the Provincial North.Note
Chart 8 start

Data table for Chart 8
| Number of re-contacts with police as a person accused of crime Data table for Chart 8 Note 2 | Rural northern region Data table for Chart 8 Note 1 | Rural southern region Data table for Chart 8 Note 1 | Urban northern region Data table for Chart 8 Note 1 | Urban southern region Data table for Chart 8 Note 1 |
|---|---|---|---|---|
| percent | ||||
Source: Statistics Canada, Canadian Centre for Justice and Community Safety Statistics, Uniform Crime Reporting Survey (re-contact file). |
||||
| No re-contact | 23 | 39 | 35 | 43 |
| 1 re-contact | 11 | 15 | 14 | 14 |
| 2 to 5 re-contacts | 23 | 21 | 22 | 20 |
| 6 to 10 re-contacts | 14 | 10 | 11 | 9 |
| More than 10 re-contacts | 28 | 15 | 19 | 13 |
Chart 8 end
Thus, several studies have shown that crime rates are relatively high in the Provincial North, both in rural and urban areas (Allen & Perreault, 2015; Cotter 2025; Perreault, 2019; Perreault, 2023; Savage et al., 2025).
The police-reported data for 2024 confirm the previous observations. Overall, the crime rate reported by police services in the rural North (17,766 incidents per 100,000 population) was more than triple than that reported in the rural South (5,468 incidents per 100,000 population) and the urban South (5,106 incidents per 100,000 population). It was also more than double the rate reported in the urban North (8,603 incidents per 100,000 population) (Chart 9).
Thus, the high crime rate in rural areas of the Provincial North largely explains the difference between rural and urban areas overall. In the southern parts of the provinces, there was little difference overall between rural areas (5,468 incidents per 100,000 population) and urban areas (5,106 incidents per 100,000 population). The crime rate in rural South (5,468 incidents per 100,000 population) was even lower than that in the urban North (8,603 incidents per 100,000 population) (Chart 9).
Furthermore, the gap between rural areas in the Provincial North and other areas has widened in recent years. Compared with 2014, the crime rate increased by 24%Note in rural areas in the Provincial North. By comparison, the increase was 17% in the rural South, 15% in the urban Provincial North and 10% in the urban South.
Chart 9 start

Data table for Chart 9
| Urban southern region | Urban northern region | Rural southern region | Rural northern region | |
|---|---|---|---|---|
| rate per 100,000 population | ||||
Source: Statistics Canada, Canadian Centre for Justice and Community Safety Statistics, Uniform Crime Reporting Survey. |
||||
| Newfoundland and Labrador | 6,468 | ... not applicable | 5,825 | 33,573 |
| Prince Edward Island | 6,354 | ... not applicable | 5,264 | ... not applicable |
| Nova Scotia | 6,003 | ... not applicable | 6,392 | ... not applicable |
| New Brunswick | 5,843 | ... not applicable | 6,695 | ... not applicable |
| Quebec | 3,676 | 3,872 | 3,215 | 12,350 |
| Ontario | 4,405 | 6,440 | 3,063 | 8,700 |
| Manitoba | 7,966 | 65,475 | 7,991 | 36,649 |
| Saskatchewan | 9,869 | ... not applicable | 11,597 | 85,559 |
| Alberta | 6,342 | 14,621 | 8,611 | 15,093 |
| British Columbia | 6,478 | 13,078 | 6,430 | 11,550 |
| All provinces | 5,106 | 8,603 | 5,468 | 17,766 |
Chart 9 end
Rural areas in northern Saskatchewan show the greatest gap compared with the southern parts of the province. In 2024, the Saskatchewan rural North crime rate (85,559 incidents per 100,000 population) was nearly nine times higher than that in urban areas in the southern parts of the province (9,869 incidents per 100,000 population) and seven times higher than that in the rural South (11,597 incidents per 100,000 population). The gap was also particularly wide in Newfoundland and Labrador and in Manitoba (Chart 9).
In several provinces, however, crime rates were as high in the urban North as in the rural North, and sometimes even higher. For example, rural areas in northern Manitoba had one of the highest crime rates (36,649 incidents per 100,000 population), but this rate was lower than that in urban areas in the same region (65,475 incidents per 100,000 population). In northern British Columbia, crime rates were also higher in urban than rural areas (Chart 9).
Start of text box 4
Text box 4
Police services in First Nations and Inuit communities
The Truth and Reconciliation Commission documented historical abuses suffered by First Nations people, Inuit and Métis at the hands of the police, including the role of the Royal Canadian Mounted Police in removing children from their families and sending them to residential or Indian day schools, as well as the forced removal of First Nations people from their lands, and other measures taken to erase their culture and history (Assembly of First Nations, 2025; Truth and Reconciliation Commission, 2015).
In 1991, after several reports highlighted a growing dissatisfaction with Canada’s approach to policing Indigenous communities (Lithopoulos, 2016; Ruddell & Lithopoulos, 2013), the First Nations and Inuit Policing Program (FNIPP) was created. The FNIPP is managed by Public Safety Canada and funded by federal, provincial and territorial governments. It aims to support police services that are culturally appropriate for First Nations and Inuit communities and that reflect the expectations of Indigenous communities (Royal Canadian Mounted Police, 2025; Public Safety Canada, 2022).
There are two models for providing police services in Indigenous communities (whether rural or urban) that are funded through the FNIPP : (1) self-administered agreements, where an Indigenous community manages its own police service, and (2) tripartite agreements, where existing police services, such as the Royal Canadian Mounted Police, the Ontario Provincial Police or the Sûreté du Québec, are contracted to provide police services in an Indigenous community (Royal Canadian Mounted Police, 2025; Public Safety Canada, 2022). It is worth noting that these agreements are limited to policing in Indigenous communities, thus they do not address the need for Indigenous people living outside these communities to also have access to culturally appropriate policing.
Police-reported data are currently available at the police service level. Police services operating under tripartite agreements often serve non-Indigenous communities in addition to the Indigenous communities for which they provide police services. As a result, crime data for Indigenous communities served by these services are not available because they are combined with data from non-Indigenous communities they also serve.
In 2020, Statistics Canada released a study on police-reported crime in jurisdictions where at least half of the population served was Indigenous. The study found that these police services reported crime rates approximately six times higher than those reported by police services serving predominantly non-Indigenous populations (Allen, 2020).
No studies to date have however examined crime in Indigenous communities with their own self-managed police services (the term “Indigenous police services” used in the rest of this section refers to this model). In Canada, there are 36 such services, which served a population of 151,225 in 2024.Note Just over half of these police services are in Quebec (21 police services) and one-quarter are in Ontario (9), while the others are in Manitoba (1), Saskatchewan (1), Alberta (3) and British Columbia (1). Some services may serve more than one Indigenous community and have more than one detachment.Note For example, the Nishnawbe Aski Police Service serves the communities of the Nishnawbe Aski Nation in northern Ontario and has 34 detachments (Nishnawbe Aski Police Service, 2025), and the Nunavik Police Service serves the 14 Inuit villages in northern Quebec (Nunavik Police Service, 2025).
Among self-administered Indigenous police services, 8 serve predominantly urban populations and 28 serve predominantly rural populations.Note Note In addition, 21 of these services operate primarily in the southern parts of the provinces, and 15 operate primarily in the northern parts.Note Thus, compared with other police services, Indigenous police services are more likely to serve populations living outside major urban centres and in the northern regions of the provinces.
Overall, Indigenous police services (22,813 incidents per 100,000 population) reported a crime rate approximately four times higher than that of other police servicesNote (5,468 incidents per 100,000 population) in 2024. As with crime in rural areas, crime levels reported by Indigenous police services vary considerably. While some Indigenous police services reported crime rates below 3,000 incidents per 100,000 population, others reported more than 60,000 incidents per 100,000 population.
Just as crime rates are overall higher in rural areas compared to urban areas across the provinces, crime rates reported by Indigenous police services in 2024 were also higher in rural areas than in urban areas. Specifically, Indigenous police services serving predominantly rural populations reported a rate of 25,638 incidents per 100,000 population, while those serving predominantly urban populations reported a rate of 11,762 incidents per 100,000 population. However, there was little difference between Indigenous police services operating in the southern parts of the provinces (22,641 incidents per 100,000 population) and those operating in the northern parts of the provinces (22,935 incidents per 100,000 population) (Chart 10).
Chart 10 start

Data table for Chart 10
| Area and region | Rate per 100,000 population |
|---|---|
| Note: Includes self-administered Indigenous police services, meaning police services managed by a First Nation or Inuit community supported through the First Nations and Inuit Policing Program (FNIPP). In Canada, there are 36 such services, which served a population of 151,225 people in 2024. As such, results should not be interpreted as being representative of all Indigenous communities. According to Census, there were over 1.7 million Indigenous people living in the provinces in 2021. Just over half of these police services are in Quebec (21 services) and one-quarter are in Ontario (9). The remainder are in Manitoba (1), Saskatchewan (1), Alberta (3) and British Columbia (1). Some services may serve more than one Indigenous community and have more than one detachment. Note that data for 6 of the 36 police services with Self-administered Police Service Agreements under the FNIPP may be imputed in a given year based on historical reporting. Imputation is applied to address missing or incomplete data. Given the relatively small counts and the use of imputed data, comparisons that focus on FNIPP police services should be interpreted with caution. Includes Criminal Code offences, excluding traffic violations. The provincial north comprises Labrador and the northern regions of Quebec, Ontario, Manitoba, Saskatchewan, Alberta and British Columbia, according to the definition agreed on by the Northern Development Ministers Forum and used by the Conference Board of Canada’s Centre for the North. These northern boundaries generally reflect provincial administrative regions. Urban police services serve an area where the majority of the population lives within a census metropolitan area (CMA) or census agglomeration (CA). Rural police services serve an area where the majority of the population lives outside a CMA or CA. A CMA or a CA comprises one or more adjacent municipalities centred on a population centre (known as the core). A CMA must have a total population of at least 100,000, of which 50,000 or more must live in the core. A CA must have a core population of at least 10,000. To be included in the CMA or CA, adjacent municipalities must be highly integrated with the core, as measured by commuting flows derived from census data. A CMA or CA may be served by more than one police service. Rates are calculated per 100,000 population, and population counts are based on July 1 estimates from Statistics Canada’s Centre for Demography.
Source: Statistics Canada, Canadian Centre for Justice and Community Safety Statistics, Uniform Crime Reporting Survey. |
|
| Urban areas | 11,762 |
| Rural areas | 25,638 |
| Southern regions | 22,641 |
| Northern regions | 22,935 |
Chart 10 end
Despite recent additional government funding to support First Nations and Inuit communities currently served under the FNIPP and to expand the program to new First Nations and Inuit communities, many stakeholders have highlighted the lack of resources and underfunding faced by self-governed Indigenous police services, including the fact that they are not considered an essential service, forcing them to operate on a short-term agreement basis (Assembly of First Nations, 2025; Assembly of First Nations, 2023; Behrend, 2025; Office of the Auditor General of Canada, 2024; Kahnawà:ke Mohawk Peacekeepers, 2025). In a decision handed down in 2022, the Canadian Human Rights Tribunal characterized this underfunding as systemic discrimination, a decision that was upheld by the Supreme Court at the end of 2024 (Supreme Court of Canada, 2024; Pekuakamiulnuatsh Takuhikan, 2025).
Although the data presented in this Juristat article cannot directly contribute to the discussion of funding of Indigenous police services, they nevertheless shed light on some challenges faced by many of them.
End of text box 4
Violent crime
Overall, the rate of police-reported violent crime was higher in rural areas than in urban areas (Table 1, Table 2, Table 3). However, considerable differences lie beneath this overall picture: certain violent crimes are much more likely to occur in rural areas, while others are far more frequent in urban areas.
Homicide rates are rising in rural areas, but falling in urban areas
Homicide is one of the least common violent crimes in Canada. However, it is the most serious crime that carries the most severe sanctions. Compared with most other crimes, homicides are more likely to be brought to the attention of the police. Therefore, homicide data are unlikely to vary based on the rate of reporting these incidents to the police or policing practices, and as a result, reliable comparisons across regions of Canada are possible, despite providing only a very partial picture of overall violent crime.
Previous studies have noted higher homicide rates in rural areas (Cotter, 2025; Perreault, 2023; Sutton, 2023). Specifically, rates of gender-based or intimate partner homicide are disproportionately higher than those in urban areas (Cotter, 2025; Sutton, 2023). The same is true for homicides involving Indigenous victims, with rates of homicides of Indigenous people being higher in rural areas than in urban areas (Cotter, 2025). In 2024, Indigenous people represented 62% of homicide victims in rural areas in the provinces, 91% of which were First Nations, 1.9% were Inuit, 3.8% were Métis, and 2.9% were from an unknown Indigenous group. In comparison, Indigenous people represented 19% of victims in urban areas. Moreover, homicide victims in rural areas were more likely than those in urban areas to be reported missing at the time the homicide came to the attention of the police (Cotter, 2025).
In 2024, police reported 173 homicides in rural areas, for a rate of 2.92 homicides per 100,000 population. By comparison, police reported 605 homicides in urban areas, a rate of 1.72 homicides per 100,000 population (Table 1).
The homicide rate in rural areas has shown an upward trend in recent years. It rose from 1.86 homicides per 100,000 population in 2014 to 2.92 homicides per 100,000 population, an increase of 57%.Note The increase was more pronounced among women than men. From 2014 to 2024, the homicide rate for women in rural areas increased by 68% (from 1.16 to 1.96 incidents per 100,000 women) compared with 50% for men (from 2.55 to 3.83 incidents per 100,000 men) (Chart 11). In 2024, women accounted for 57 of the 173 homicide victimsNote in rural areas, a record since comparable data were first collected in 2009.Note
Chart 11 start

Data table for Chart 11
| Year | Urban areas—men victims | Urban areas—women victims | Rural areas—men victims | Rural areas—women victims |
|---|---|---|---|---|
| rate per 100,000 population | ||||
| Note: Excludes victims whose gender was reported as unknown. The Homicide Survey began collecting data on the gender of homicide victims in 2019. Gender refers to the gender a person publicly expresses in their daily life, including at work, while shopping or accessing services, in their housing environment, and in the broader community. Before 2019, data from the Homicide Survey were presented based on the sex of victims and accused persons. Sex and gender are distinct concepts. Given the small counts of victims and accused persons identified as gender diverse, the publicly available aggregate Homicide Survey data have been recoded to assign these counts to either “men” or “women” to protect confidentiality and privacy. A small number of homicides included in a given year’s total occurred in previous years. Homicides are counted according to the year in which they are reported to Statistics Canada. Urban police services serve an area where the majority of the population lives within a census metropolitan area (CMA) or census agglomeration (CA). Rural police services serve an area where the majority of the population lives outside a CMA or CA. A CMA or a CA comprises one or more adjacent municipalities centred on a population centre (known as the core). A CMA must have a total population of at least 100,000, of which 50,000 or more must live in the core. A CA must have a core population of at least 10,000. To be included in the CMA or CA, adjacent municipalities must be highly integrated with the core, as measured by commuting flows derived from census data. A CMA or CA may be served by more than one police service. Rates are calculated per 100,000 population, and population counts are based on July 1 estimates from Statistics Canada’s Centre for Demography.
Source: Statistics Canada, Canadian Centre for Justice and Community Safety Statistics, Homicide Survey. |
||||
| 2014 | 1.99 | 0.78 | 2.55 | 1.16 |
| 2015 | 2.30 | 0.87 | 3.06 | 1.61 |
| 2016 | 2.55 | 0.80 | 2.58 | 1.18 |
| 2017 | 2.58 | 0.79 | 3.08 | 1.73 |
| 2018 | 2.60 | 0.73 | 2.85 | 1.72 |
| 2019 | 2.68 | 0.67 | 3.53 | 1.64 |
| 2020 | 2.84 | 0.83 | 4.12 | 1.51 |
| 2021 | 3.07 | 0.91 | 3.26 | 1.80 |
| 2022 | 3.20 | 0.97 | 4.77 | 1.50 |
| 2023 | 2.61 | 0.98 | 4.06 | 1.49 |
| 2024 | 2.39 | 1.01 | 3.83 | 1.96 |
Chart 11 end
Overall, the increase in the homicide rate from 2014 to 2024 was similar in the rural South (+60%) and the rural North (+56%). However, in 2024, the homicide rate was considerably higher in the rural North (7.66 homicides per 100,000 population) than in the rural South (2.03 homicides per 100,000 population) (Chart 12).
The rise in the homicide rate in rural areas is partly the result of the growing number of homicides attributable to organized crime or gangs. In 2014, eight homicides (8.0% of homicides) in rural areas were linked to organized crime or gangs. In 2024, this number rose to 23 (13.3%). However, homicides are still less likely to be linked to organized crime or gangs in rural areas than in urban areas, where 21% of homicides were attributable to organized crime or gangs in 2024.
Chart 12 start

Data table for Chart 12
| Year | Urban southern region | Urban northern region | Rural southern region | Rural northern region |
|---|---|---|---|---|
| rate per 100,000 population | ||||
| Note: A small number of homicides included in a given year’s total may have occurred in previous years. Homicides are counted according to the year in which they are reported to Statistics Canada. The provincial north comprises Labrador and the northern regions of Quebec, Ontario, Manitoba, Saskatchewan, Alberta and British Columbia, according to the definition agreed on by the Northern Development Ministers Forum and used by the Conference Board of Canada’s Centre for the North. These northern boundaries generally reflect provincial administrative regions. Urban police services serve an area where the majority of the population lives within a census metropolitan area (CMA) or census agglomeration (CA). Rural police services serve an area where the majority of the population lives outside a CMA or CA. A CMA or a CA comprises one or more adjacent municipalities centred on a population centre (known as the core). A CMA must have a total population of at least 100,000, of which 50,000 or more must live in the core. A CA must have a core population of at least 10,000. To be included in the CMA or CA, adjacent municipalities must be highly integrated with the core, as measured by commuting flows derived from census data. A CMA or CA may be served by more than one police service. Rates are calculated per 100,000 population, and population counts are based on July 1 estimates from Statistics Canada’s Centre for Demography.
Source: Statistics Canada, Canadian Centre for Justice and Community Safety Statistics, Homicide Survey. |
||||
| 2014 | 1.34 | 2.30 | 1.27 | 4.91 |
| 2015 | 1.54 | 2.54 | 1.58 | 6.21 |
| 2016 | 1.64 | 2.30 | 1.39 | 4.37 |
| 2017 | 1.65 | 2.38 | 1.55 | 6.77 |
| 2018 | 1.60 | 3.02 | 1.47 | 6.44 |
| 2019 | 1.64 | 2.60 | 1.69 | 7.30 |
| 2020 | 1.81 | 2.67 | 2.04 | 6.97 |
| 2021 | 1.95 | 3.32 | 1.91 | 5.86 |
| 2022 | 2.02 | 4.18 | 2.49 | 6.91 |
| 2023 | 1.73 | 4.10 | 1.90 | 7.60 |
| 2024 | 1.67 | 2.85 | 2.03 | 7.66 |
Chart 12 end
In urban areas, the homicide rate has also been on the rise since 2014, but to a lesser extent (+24%). However, compared with 2023, the homicide rate declined in urban areas (-5.5%), while it increased in rural areas (+4.0%).
Among the provinces, rural areas of Manitoba had the highest police-reported homicide rate from 2014 to 2024.Note The average annual rate recorded by these areas during this period was 6.05 homicides per 100,000 population, followed by rural areas of Saskatchewan (5.79 homicides per 100,000 population). These provinces also have the highest rates of homicides in urban areas. Alberta recorded the largest gap between the average annual rates in rural (3.94 incidents per 100,000 population) and urban (2.30 incidents per 100,000 population) areas. However, from 2014 to 2024, some rural areas had a lower average annual homicide rate than urban areas, namely in Newfoundland and Labrador, Prince Edward Island, and Nova Scotia (Chart 13).
Chart 13 start

Data table for Chart 13
| Urban areas | Rural areas | |
|---|---|---|
| average annual rate per 100,000 population | ||
| Note: Urban police services serve an area where the majority of the population lives within a census metropolitan area (CMA) or census agglomeration (CA). Rural police services serve an area where the majority of the population lives outside a CMA or CA. A CMA or a CA comprises one or more adjacent municipalities centred on a population centre (known as the core). A CMA must have a total population of at least 100,000, of which 50,000 or more must live in the core. A CA must have a core population of at least 10,000. To be included in the CMA or CA, adjacent municipalities must be highly integrated with the core, as measured by commuting flows derived from census data. A CMA or CA may be served by more than one police service. Rates are calculated per 100,000 population, and population counts are based on July 1 estimates from Statistics Canada’s Centre for Demography.
Source: Statistics Canada, Canadian Centre for Justice and Community Safety Statistics, Homicide Survey. |
||
| Newfoundland and Labrador | 0.99 | 0.73 |
| Prince Edward Island | 0.89 | 0.49 |
| Nova Scotia | 2.04 | 1.08 |
| New Brunswick | 1.51 | 1.79 |
| Quebec | 1.00 | 1.22 |
| Ontario | 1.62 | 1.80 |
| Manitoba | 4.04 | 6.05 |
| Saskatchewan | 4.07 | 5.79 |
| Alberta | 2.30 | 3.94 |
| British Columbia | 1.98 | 3.05 |
| All provinces | 1.74 | 2.53 |
Chart 13 end
Although overall homicide rates are considerably higher in rural areas than in urban areas, this pattern does not hold for attempted murders. In 2024, police recorded 115 attempted murders in the rural areas of the provinces, a rate of 1.94 attempted murders per 100,000 population. This rate was slightly higher than that recorded in urban areas (1.81 incidents per 100,000 population) (Table 1).
Access to health care can be more difficult in rural areas (Wilson et al., 2020). Specifically, preventable mortality—premature deaths that should not occur with timely and effective health care—is higher in remote areas (Subedi et al., 2019). As a result, compared to victims in rural areas, victims of attempted murder in urban areas may be more likely to receive timely care.
It should also be noted that the rate of aggravated assault (level 3), which includes assaults in which the victim’s life was endangered, is significantly higher in rural areas than in urban areas (Table 1).
Rates of aggravated assault and uttering threats are approximately twice as high in rural areas
Assault is the most frequently reported violent crime by police in both rural and urban areas (Chart 14). Assault includes applying force to another person, threateningNote to do so, or accosting or impeding another person while openly carrying a weapon. Assault is classified into three levels based on certain circumstances. Aggravated assault (level 3) includes incidents in which a victim is wounded, maimed or disfigured, or their life is endangered. Level 2 assault includes incidents that cause bodily harm, involve choking or strangulation, or in which the accused person carries, uses or threatens to use a weapon. Most other assaults are classified as common assault (level 1).Note Common assaults are by far the most common. They also carry the lowest weight in calculating the CSI (i.e., their severity)—nearly 20 times lower than that of level 3 assaults.
Chart 14 start

Data table for Chart 14
| Type of offence | Urban areas | Rural areas |
|---|---|---|
| rate per 100,000 population | ||
| Note: Urban police services serve an area where the majority of the population lives within a census metropolitan area (CMA) or census agglomeration (CA). Rural police services serve an area where the majority of the population lives outside a CMA or CA. A CMA or a CA comprises one or more adjacent municipalities centred on a population centre (known as the core). A CMA must have a total population of at least 100,000, of which 50,000 or more must live in the core. A CA must have a core population of at least 10,000. To be included in the CMA or CA, adjacent municipalities must be highly integrated with the core, as measured by commuting flows derived from census data. A CMA or CA may be served by more than one police service. Rates are calculated per 100,000 population, and population counts are based on July 1 estimates from Statistics Canada’s Centre for Demography. Excludes data from the Royal Canadian Mounted Police’s Canadian Police Centre for Missing and Exploited Children, the British Columbia Integrated Child Exploitation Unit and the Canadian Forces Military Police Group.
Source: Statistics Canada, Canadian Centre for Justice and Community Safety Statistics, Uniform Crime Reporting Survey. |
||
| Common assault (level 1) | 452 | 835 |
| Uttering threats | 203 | 393 |
| Assault with a weapon or causing bodily harm (level 2) | 190 | 317 |
| Sexual assault (level 1) | 80 | 120 |
| Criminal harassment | 72 | 118 |
| Indecent or harassing communications | 57 | 128 |
| Robbery | 64 | 21 |
Chart 14 end
Overall, police-reported rates of assault across all levels were higher in rural areas than in urban areas. In 2024, for common assault (level 1), police services in rural areas reported 835 incidents per 100,000 population, compared with 452 incidents per 100,000 population in urban areas. The largest gap was observed for level 3 assaults, with rates approximately 2.6 times higher in rural areas (21 incidents per 100,000 population) than in urban areas (8.2 incidents per 100,000 population) (Chart 14, Table 1).
Among the provinces, Saskatchewan (1,839 incidents per 100,000 population) had the highest rate of common assault in rural areas in 2024. However, rural areas of Manitoba had the highest rates of level 2 (854 incidents per 100,000 population) and level 3 (90 incidents per 100,000 population) assaults. These two provinces also had the largest gaps between rural and urban areas, although rural areas in Newfoundland and Labrador and Prince Edward Island had level 3 assault rates twice as high as those in urban areas (Table 6, Table 7).
Uttering threats ranked second among the most common violent offences in 2024. The rate of uttering threats was nearly double in rural areas (393 incidents per 100,000 population) compared with urban areas (203 incidents per 100,000 population) (Chart 14, Table 1). As with assaults, Saskatchewan and Manitoba had the highest rates and the largest gaps relative to urban areas (Table 6, Table 7).
Sexual assaults are more common in rural areas
Sexual assault is a gendered crime, meaning that most victims are women and most accused persons are men (Burczycka, 2021; Burczycka, 2020; Conroy, 2024; Cotter & Burczycka, 2026; Cotter & Savage, 2019; Perreault 2020; Rotenberg & Cotter, 2018). In 2024, police-reported sexual assaults were relatively common, with this crime being the most common after assault and uttering threats, in rural (124 incidents per 100,000 population) and in urban (82 incidents per 100,000 population) areas. However, these figures underestimate the actual number of sexual assaults. According to a recent Statistics Canada study, fewer than 1 in 10 victims of sexual assault in 2024 reported the most serious assault to the police (Cotter & Burczycka, 2026).
In Canada, sexual assaults are classified into three levels according to the same criteria used for assault. Sexual assault, however, is a more serious crime. For example, the weight assigned to level 1 sexual assault in the CSI calculation is approximately 10 times higher than that of common assault (level 1) and 3 times higher than that of level 2 assault. Thus, although there are fewer police-reported sexual assaults than assaults, sexual assaults contribute the most to the violent CSI in rural areas.
Furthermore, police-reported sexual assaults show a clear upward trend. From 2014 to 2024, the rate of sexual assault increased by 56% in rural areas (from 79 to 124 incidents per 100,000 population) and by 55% in urban areas (from 53 to 82 incidents per 100,000 population) (Chart 15).
At the national level, the rate of sexual assault rose considerably starting in 2017, possibly fuelled by high-profile campaigns such as #MeToo, which encouraged victims to come forward (Rotenberg & Cotter, 2018). Indeed, self-reported victimization surveys did show an increase from 2018 to 2024 in the proportion of sexual assaults being reported to police (Cotter & Burczycka, 2026). In addition, the definition of a founded incident was changed in 2018, which may have also slightly contributed to an increase in sexual assaults reported by police (Moreau, 2019). In rural areas, a sharp increase in the rate of sexual assaults from 2018 to 2024 was also recorded. While the rate of sexual assault stabilized at the start of the COVID-19 pandemic, it began to rise again in 2021, reaching a plateau that has remained steady since (Chart 15).
Chart 15 start

Data table for Chart 15
| Year | Urban areas | Rural areas |
|---|---|---|
| rate per 100,000 population | ||
| Note: Urban police services serve an area where the majority of the population lives within a census metropolitan area (CMA) or census agglomeration (CA). Rural police services serve an area where the majority of the population lives outside a CMA or CA. A CMA or a CA comprises one or more adjacent municipalities centred on a population centre (known as the core). A CMA must have a total population of at least 100,000, of which 50,000 or more must live in the core. A CA must have a core population of at least 10,000. To be included in the CMA or CA, adjacent municipalities must be highly integrated with the core, as measured by commuting flows derived from census data. A CMA or CA may be served by more than one police service. Rates are calculated per 100,000 population, and population counts are based on July 1 estimates from Statistics Canada’s Centre for Demography. Excludes data from the Royal Canadian Mounted Police’s Canadian Police Centre for Missing and Exploited Children, the British Columbia Integrated Child Exploitation Unit and the Canadian Forces Military Police Group.
Source: Statistics Canada, Canadian Centre for Justice and Community Safety Statistics, Uniform Crime Reporting Survey. |
||
| 2014 | 53 | 79 |
| 2015 | 54 | 80 |
| 2016 | 54 | 83 |
| 2017 | 64 | 85 |
| 2018 | 72 | 97 |
| 2019 | 77 | 107 |
| 2020 | 69 | 105 |
| 2021 | 81 | 128 |
| 2022 | 85 | 127 |
| 2023 | 85 | 127 |
| 2024 | 82 | 124 |
Chart 15 end
As with assault, police-reported rates of sexual assault were highest in rural areas of Saskatchewan (153 incidents per 100,000 population) and Manitoba (145 incidents per 100,000 population) in 2024, followed by rural areas in Quebec (135 incidents per 100,000 population) and Ontario (132 incidents per 100,000 population). In terms of sexual assault rates, Ontario had the largest differences between rural and urban areas (Table 6, Table 7).
Like sexual assault, criminal harassment is a gendered crime, meaning that most victims are womenNote and most accused persons are men (Milligan, 2011). Overall, criminal harassment was the most common violent crime after sexual assault in 2024. However, in rural areas, incidents of indecent or harassing communications (128 incidents per 100,000 population) were slightly more common than incidents of criminal harassment (118 incidents per 100,000 population) (Chart 14). Both criminal harassment (+71%) and indecent or harassing communications (+106%) have increased significantly since 2014 in rural areas (Table 1).
The rate of intimate partner violence is nearly twice as high in rural areas than in urban areas
In general, crimes in urban areas are more likely to be committed by a stranger than crimes in rural areas. In contrast, crimes in rural areas are more likely to be committed by someone known to the victim, including an intimate partner (Cotter, 2025). Previous studies have found higher rates of intimate partner violence in rural areas (Cotter, 2025; Perreault, 2023; Savage et al., 2025), particularly in remote communities (Burczycka, 2022).
In 2024, police services serving predominantly rural populations reported 573 incidents of intimate partner violence per 100,000 population, nearly double the rate recorded in urban areas (310 incidents per 100,000 population), and this gap is widening. Since 2014, the rate of intimate partner violence has increased more in rural areas (+34%) than in urban areas (+20%) (Chart 16). Furthermore, the rate of intimate partner homicides in rural areas (0.41 incidents per 100,000 population) was nearly double that in urban areas (0.21 incidents per 100,000 population) in 2024.Note These rates were relatively similar to those recorded on average over the previous 10 years (0.45 and 0.20 incidents per 100,000 population, respectively).
Chart 16 start

Data table for Chart 16
| Year | Urban areas | Rural areas |
|---|---|---|
| rate per 100,000 population aged 12 and older | ||
| Note: Intimate partner violence refers to violence committed by current and former legally married spouses, common-law partners, dating partners and other intimate partners. Includes victims aged 12 and older. Victims older than 110 years are excluded from analyses because of possible instances of miscoding of unknown age within this age category. Excludes victims where the age was unknown or where the accused–victim relationship was unknown. Excludes a small number of victims in Quebec whose ages were unknown but were miscoded as 0. Based on the Incident-based Uniform Crime Reporting Survey trend database, which, as of 2009, includes data for 99% of the population in Canada. Urban police services serve an area where the majority of the population lives within a census metropolitan area (CMA) or census agglomeration (CA). Rural police services serve an area where the majority of the population lives outside a CMA or CA. A CMA or a CA comprises one or more adjacent municipalities centred on a population centre (known as the core). A CMA must have a total population of at least 100,000, of which 50,000 or more must live in the core. A CA must have a core population of at least 10,000. To be included in the CMA or CA, adjacent municipalities must be highly integrated with the core, as measured by commuting flows derived from census data. A CMA or CA may have more than one police service. Rates are calculated per 100,000 population aged 12 and over, and population counts are based on July 1 estimates from Statistics Canada’s Centre for Demography. Excludes data from the Royal Canadian Mounted Police’s Canadian Police Centre for Missing and Exploited Children, the British Columbia Integrated Child Exploitation Unit and the Canadian Forces Military Police Group.
Source: Statistics Canada, Canadian Centre for Justice and Community Safety Statistics, Incident-based Uniform Crime Reporting Survey trend database. |
||
| 2014 | 258 | 426 |
| 2015 | 264 | 437 |
| 2016 | 264 | 459 |
| 2017 | 269 | 463 |
| 2018 | 276 | 467 |
| 2019 | 290 | 509 |
| 2020 | 290 | 546 |
| 2021 | 299 | 550 |
| 2022 | 305 | 536 |
| 2023 | 312 | 554 |
| 2024 | 310 | 573 |
Chart 16 end
These data are based only on acts of violence reported to the police. However, most acts of violence committed by an intimate partner go unreported (Conroy, 2021; Cotter, 2021). The decision to report an incident is often personal and complex. According to the results of the 2019 General Social Survey – Canadians’ Safety (Victimization), many victims who did not report the violence they experienced to the police cited the private or personal nature of the matter, which was resolved informally (68%) (Conroy, 2021). Moreover, a previous study found higher rates of reporting to the police among victims of intimate partner violence in remote areas (Burczycka, 2022).
Although intimate partner violence is a problem in both urban and rural areas, it may manifest differently in rural areas, particularly because of isolation, the influence of social norms and a culture of silence; limited access to support services or shelters; housing and financial issues; gun culture; and caregiving responsibilities for children and animals (Ceccato, 2025; Letourneau et al., 2023; Canadian Municipal Network on Crime Prevention, 2020; Wood et al., 2025; Youngson et al., 2021). Lastly, in some rural communities, victims, accused persons and police officers may all know each other, and this can influence the likelihood that an incident will be reported and how it will be handled by the authorities (Hale et al., 2023).
Robbery is one of the few violent crimes that is more common in urban areas than in rural areas
Robbery is a relatively serious crime. The weight assigned to robbery in the calculation of the CSI is similar to that assigned to aggravated assault (level 3). However, robbery is much more common than aggravated assault, at least in urban areas. In 2024, police services serving predominantly urban populations reported 22,655 incidents of robbery, representing a rate of 64 incidents per 100,000 population (Chart 14, Table 1). Robbery was thus the main factor contributing to the violent CSI in urban areas in 2024.
The robbery rate was also about three times higher in urban areas (64 incidents per 100,000 population) than in rural areas (21 incidents per 100,000 population). It is one of the few violent crimes that is more prevalent in urban areas than in rural areas. The police-reported rate of robbery in 2024 was higher in urban areas than in rural areas in all provinces (Table 6, Table 7). However, the gap has narrowed in recent years, as the rate of robbery in urban areas has declined by 4% since 2014, while it has increased by 30% in rural areas (Table 1).
There are several reasons why robberies are more common in urban areas. Compared with most other violent crimes, robberies are more likely to be committed by strangers, whereas crimes in rural areas are more often perpetrated by someone known to the victim (Perreault, 2023). Similarly, robberies are often committed in stores, on the street or in other public places, while violent crimes in rural areas are more likely to occur in private dwellings (Cotter, 2025).
In addition to robbery, offences in relation to sexual services (2.5 incidents per 100,000 population in urban areas and 1.0 incident per 100,000 population in rural areas) and extortion (32 incidents per 100,000 population in urban areas and 30 incidents per 100,000 population in rural areas) are the only other violent crimes for which rates were higher in urban areas than in rural areas.
Extortion is a crime that, in some respects, may resemble robbery. Both offences may include obtaining something by means of threats. Although both crimes are serious, in some ways, robbery can be considered an aggravated form of extortion, as it generally involves the use of violence, the threat of violence or the use of a weapon. Unlike robbery, extortion often takes place online. In 2024, the police reported 6,042 cyber-related extortion incidentsNote across the country (Statistics Canada, 2026). This online component could explain why, unlike robbery, extortion rates in rural areas are similar to those recorded in urban areas. Furthermore, the rate of extortion has more than quadrupled since 2014 in both rural and urban areas. It is the violent crime that has seen, by far, the biggest increase during this period (Table 1).
Start of text box 5
Text box 5
Home invasions in rural and urban areas
A home invasion is a violent crime where an intruder unlawfully enters a residential dwelling while occupants are present, often involving, assault, robbery, extortion, forcible confinement or threats. Unlike standard breaking and entering, it involves confrontation with victims. While home invasions are not unique to rural areas, the absence of witnesses (e.g., neighbours) who could alert emergency services, combined with long police response times, can increase fear of home invasions in these areas.
Home invasions are not a distinct offence category, meaning they are not defined as a separate offence under the Criminal Code, nor does such category exist in the Uniform Crime Reporting (UCR) Survey. Home invasions are still criminal, but they are treated according to different Criminal Code offences, and therefore recorded in the UCR Survey, depending on the circumstances. For example, police may record an incident as a robbery (section 343)Note with breaking and entering (section 348).Note
However, under section 348.1 of the Criminal Code, the court must consider as an aggravating circumstance that the dwelling was occupied at the time of the offence and that the person accused, in committing the offence,
- knew, or was reckless as to whether, the dwelling was occupied
- used violence or threats of violence against a person or property.
Because home invasions are not a distinct offence category, there are no regularly published statistics on them, nor is there an agreed-upon way to measure them. The latest statistics published on this subject by Statistics Canada date back to 2002 (Kowalski, 2002), when home invasions were defined in two ways:
- a robbery occurring in a private residence (narrow definition)
- a breaking and entering into a private residence accompanied by a violent crimeNote Note (broad definition).
These definitions are the ones used in this analysis. Not all incidents under these definitions necessarily constitute home invasions. For example, they may include breaking and entering where the offender believed the house to be unoccupied.
According to the narrow and broad definitions, home invasion rates are higher in rural areas than in urban areas, with rates rising in rural areas and falling in urban areas.
Chart 17 start

Data table for Chart 17
| Year | Breaking and entering with violence Data table for Chart 17 Note 1—urban areas | Breaking and entering with violence Data table for Chart 17 Note 1—rural areas | Residential robbery Data table for Chart 17 Note 2—urban areas | Residential robbery Data table for Chart 17 Note 2—rural areas |
|---|---|---|---|---|
| rate per 100,000 population | ||||
Source: Statistics Canada, Canadian Centre for Justice and Community Safety Statistics, Incident-based Uniform Crime Reporting Survey trend database. |
||||
| 2014 | 11.42 | 19.56 | 7.57 | 4.76 |
| 2015 | 12.14 | 20.50 | 8.12 | 4.95 |
| 2016 | 11.80 | 22.40 | 8.38 | 6.05 |
| 2017 | 12.17 | 22.38 | 8.84 | 5.92 |
| 2018 | 12.13 | 21.65 | 8.50 | 6.40 |
| 2019 | 12.16 | 21.89 | 8.53 | 7.00 |
| 2020 | 11.45 | 22.63 | 8.09 | 6.60 |
| 2021 | 11.93 | 22.13 | 7.70 | 6.79 |
| 2022 | 11.11 | 22.32 | 7.27 | 7.08 |
| 2023 | 11.39 | 24.12 | 7.45 | 8.03 |
| 2024 | 10.46 | 22.82 | 7.41 | 7.98 |
Chart 17 end
In 2024, police reported 22.8 incidents of breaking and entering into a residence with violence (broad definition) per 100,000 population in rural areas, compared with 10.5 incidents per 100,000 population in urban areas. The difference was less pronounced for robberies in a private residence (narrow definition): 8.0 incidents per 100,000 population in rural areas compared with 7.4 incidents per 100,000 population in urban areas. Moreover, it is only since 2022 that the rate of robberies in private residence has been higher in rural areas than in urban areas (Chart 17).
End of text box 5
Property crime
Property crimes were the main type of offence reported by police in both rural and urban areas. Several property crimes have been identified as important issues in rural areas, such as breaking and entering, theft, motor vehicle theft, and what could be described as “farm crime”, which may include crimes such as livestock theft, vandalism of agricultural machinery, illegal hunting or dumping waste on agricultural land (Canadian Municipal Network on Crime Prevention, 2020).
However, the difference between property crime rates in rural areas and in urban areas was smaller than for other crime categories, although the property crime rate has remained virtually unchanged in urban areas since 2014, meanwhile increasing 13% in rural areas (Table 1, Table 2, Table 3).
Overall, in 2024, the police-reported property crime rate was 20% higher in rural areas (3,694 incidents per 100,000 population) than in urban areas (3,085 incidents per 100,000 population) (Table 1, Table 2, Table 3). However, like violent crimes, the nature of the property crimes differed notably between urban and rural areas.
Mischief accounts for nearly one-quarter of Criminal Code offences in rural areas
Mischief is, by far, the offence most often reported by police in rural areas. In 2024, just over 96,000 incidents of mischief were reported by rural police services, representing 44% of all police-reported property crimes in rural areas, and 22% of Criminal Code (excluding traffic) offences. In urban areas, the police reported approximately twice as many incidents of mischief, but the urban population is approximately six times larger than the rural population. Thus, when considering population size, the rate of mischief in rural areas (1,627 incidents per 100,000 population) was approximately three times higher than that in urban areas (567 incidents per 100,000 population) in 2024 (Chart 18, Table 1).
Chart 18 start

Data table for Chart 18
| Type of offence | Urban areas | Rural areas |
|---|---|---|
| rate per 100,000 population | ||
Source: Statistics Canada, Canadian Centre for Justice Statistics, Uniform Crime Reporting Survey. |
||
| Theft of 5,000 dollars or under (non-motor vehicle) | 888 | 588 |
| Mischief Data table for Chart 18 Note 1 | 567 | 1,627 |
| Shoplifting of 5,000 dollars or under | 495 | 120 |
| Fraud Data table for Chart 18 Note 2 | 442 | 438 |
| Breaking and entering | 272 | 403 |
| Theft of motor vehicle | 236 | 255 |
| Theft over 5,000 dollars (non-motor vehicle) | 58 | 77 |
Chart 18 end
Although mischief can be a serious crime, some acts are less serious and can sometimes be dealt with through municipal by-laws rather than under the Criminal Code. In fact, only 6% of mischief incidents in the provinces in 2024 resulted in charges being laid or recommended. In cases where charges were laid, penalties were generally lenient, as reflected in the weight assigned to these offences in the calculation of the CSI, which is among the lowest of all offences.
Furthermore, mischief rates varied considerably across the country’s rural areas. For example, the highest rate, reported in rural Saskatchewan (5,863 incidents per 100,000 population), was 19 times higher than that reported in rural Quebec (304 incidents per 100,000 population) and 13 times higher than that reported in rural Ontario (450 incidents per 100,000 population), the two provinces with by far the lowest rates of mischief in rural areas (Table 6). As previously mentioned, differences in law enforcement practices may partly explain these gaps.
Breaking and entering is more common in rural areas
Breaking and entering is among the crimes that most negatively affect victims’ sense of safety (Perreault, 2017). It is also the most serious property crime.Note Under the Criminal Code, breaking and entering is punishable by life imprisonment when the offence is committed in a dwelling house. Furthermore, breaking and entering is more common in private residences in rural areas (65% of breaking and entering incidents in 2024) than in urban areas (54%).
Overall, police services serving predominantly rural populations reported nearly 24,000 breaking and entering incidents in 2024, corresponding to 403 incidents per 100,000 population. This rate was nearly 50% higher than that reported in urban areas (272 incidents per 100,000 population) (Chart 18, Table 1). In rural areas in the Provincial North, the rate was 790 incidents per 100,000 population.
Among the provinces, rural areas of Saskatchewan (879 incidents per 100,000 population) and Alberta (783 incidents per 100,000 population) had the highest rates of breaking and entering (Table 6), and Alberta had the widest gap between rural and urban areas (Table 6, Table 7).
Breaking and entering rates are trending downward in both rural and urban areas. Compared with 10 years earlier, the rate of police-reported breaking and entering in 2024 was down 24% in rural areas and 33% in urban areas (Table 1).
Criminals may perceive some characteristics of rural areas, including remoteness, long police response times or unoccupied dwellings (e.g., farm buildings or cottages) as opportunities. Residents of rural areas are also more likely to become the target of a break-in the days following another break-in within their neighbourhood (Chainey, 2021).
Fraud and identity theft are the fastest growing property crimes
With nearly 26,000 incidents reported by police in 2024, fraud was the third most common property crime in the rural areas of the provinces and is also the property crime that has seen the second-highest growth since 2014, after identity theft. The increase in the fraud rate was more pronounced in rural areas (+132%) than in urban areas (+85%), although cases of fraud also rose sharply in urban areas (Table 1). As for identify theft, the rate rose by 204% in rural areas and by 117% in urban areas from 2014 to 2024 (Table 1).
Following these increases, the fraud rate in rural areas (438 incidents per 100,000 population) reached a rate similar to that in urban areas (442 incidents per 100,000 population) in 2024 (Chart 18, Table 1). Like extortion, many types of fraud can occur online, which may explain why there is virtually no difference between rural and urban areas. In 2024, police services reported 46,301 cybercrime-related frauds nationwide (Statistics Canada, 2026). This is also the property crime for which there was the least variation across provinces. The lowest rate of fraud in rural areas was recorded in Newfoundland and Labrador (324 per 100,000 population), while the highest rate (551 incidents per 100,000 population) was recorded in Alberta (Table 6).
Decline in motor vehicle theft in 2024
The rise in motor vehicle theft in recent years has received considerable attention in both rural and urban areas (House of Commons, 2024; Public Safety Canada, 2024).
For a long time, the rate of motor vehicle theft was higher in rural areas than in urban areas, before the trend reversed in 2022 and 2023. The recent increase in motor vehicle theft has been more pronounced in urban areas, where the rate rose by 45% from 2020 to 2023. During this period, the rate of motor vehicle theft increased by 14% in rural areas (Chart 19).
The National Action Plan on Combatting Auto Theft, which aimed to dismantle and prosecute criminal groups involved in vehicle theft (Public Safety Canada, 2025b), was launched in May 2024. That year, motor vehicle theft declined considerably, with rates falling by 19% in urban areas and 5.3% in rural areas, compared with 2023. As a result, the rate of motor vehicle theft in urban areas has fallen back below the level observed in rural areas. In 2024, there were 255 police-reported motor vehicle thefts per 100,000 population in rural areas, compared with 236 per 100,000 population in urban areas (Chart 19, Table 1).
Chart 19 start

Data table for Chart 19
| Year | Urban areas | Rural areas |
|---|---|---|
| rate per 100,000 population | ||
| Note: Urban police services serve an area where the majority of the population lives within a census metropolitan area (CMA) or census agglomeration (CA). Rural police services serve an area where the majority of the population lives outside a CMA or CA. A CMA or a CA comprises one or more adjacent municipalities centred on a population centre (known as the core). A CMA must have a total population of at least 100,000, of which 50,000 or more must live in the core. A CA must have a core population of at least 10,000. To be included in the CMA or CA, adjacent municipalities must be highly integrated with the core, as measured by commuting flows derived from census data. A CMA or CA may be served by more than one police service. Rates are calculated per 100,000 population, and population counts are based on July 1 estimates from Statistics Canada’s Centre for Demography. Excludes data from the Royal Canadian Mounted Police’s Canadian Police Centre for Missing and Exploited Children, the British Columbia Integrated Child Exploitation Unit and the Canadian Forces Military Police Group.
Source: Statistics Canada, Canadian Centre for Justice and Community Safety Statistics, Uniform Crime Reporting Survey. |
||
| 2014 | 205 | 226 |
| 2015 | 215 | 250 |
| 2016 | 213 | 245 |
| 2017 | 226 | 269 |
| 2018 | 227 | 261 |
| 2019 | 225 | 266 |
| 2020 | 200 | 237 |
| 2021 | 215 | 232 |
| 2022 | 274 | 260 |
| 2023 | 290 | 270 |
| 2024 | 236 | 255 |
Chart 19 end
At the provincial level, rural areas of Saskatchewan (561 incidents per 100,000 population) and Alberta (546 incidents per 100,000 population) recorded the highest rates of motor vehicle theft (Table 6).
Theft is twice as likely to occur in urban areas as in rural areas
Theft is a source of concern in rural areas (Canadian Municipal Network on Crime Prevention, 2020). However, these are more common in urban areas than in rural areas. Overall, urban police services reported more than 500,000 thefts, other than motor vehicle thefts, in 2024. This corresponds to a rate of 1,441 incidents per 100,000 population, nearly double the rate recorded in rural areas (784 incidents per 100,000 population) (Table 1).
As with breaking and entering, thefts targeting commercial establishments are more likely to occur in urban areas. For example, the police-reported rate of shoplifting of $5,000 or under was 495 incidents per 100,000 population in urban areas, accounting for about one-third of all thefts in urban areas.Note By comparison, this rate was four times lower in rural areas: 120 incidents per 100,000 population, or 15% of thefts in rural areas (Table 1).
In addition, theft in rural areas was more likely to result in high-value losses. In both rural and urban areas, most of the stolen goods were valued at $5,000 or under. However, the rate of theft over $5,000 was 33% higher in rural areas (77 incidents per 100,000 population) than in urban areas (58 incidents per 100,000 population) (Table 1).
Other Criminal Code offences
The “other Criminal Code offences” category includes all Criminal Code offences, excluding traffic violations, that are neither violent crimes nor property crimes. These offences include many serious crimes,Note such as terrorism offences,Note weapons trafficking, and child sexual abuse and exploitation material (child pornography), as well as less serious violations, such as disturbing the peace and failure to appear in court. Although traffic violations (e.g., impaired driving) are not included in the calculation of the traditional crime rate or in the standard “other Criminal Code offences” category, they are still Criminal Code offences and will be analyzed in more detail in this section. Like the rates of violent crime, the rates for these crimes are notably higher in rural areas. However, important differences and variations were observed, based on the crime and the province.
Offences against the administration of justice account for approximately 1 in 10 Criminal Code offences
Offences against the administration of justice encompasses a group of criminal offences related to compliance with procedures and conditions imposed on an accused person by the justice system. Among other things, it includes offences such as failure to appear in court, escape from lawful custody, being unlawfully at large, failure to comply with a court order or breach of probation. These crimes most commonly involve someone coming into contact again with police after a prior offence, as they are generally committed when an individual does not follow a pre-trial condition or sentence imposed for another offence (Burczycka & Munch, 2015).
In 2024, police services serving predominantly rural populations reported nearly 43,000 offences against the administration of justice, a rate of 725 incidents per 100,000 population. This rate was nearly 40% higher than that recorded in urban areas (519 incidents per 100,000 population) (Chart 20, Table 1). In both rural and urban areas, this represented approximately 1 in 10 Criminal Code (excluding traffic) offences.
Chart 20 start

Data table for Chart 20
| Type of offence | Urban areas | Rural areas |
|---|---|---|
| rate per 100,000 population | ||
Source: Statistics Canada, Canadian Centre for Justice Statistics, Uniform Crime Reporting Survey. |
||
| Offences against the administration of justice | 519 | 725 |
| Disturbing the peace | 191 | 533 |
| Impaired drivingData table for Chart 20 Note 1 | 126 | 360 |
| Failure to stop or remain | 68 | 40 |
| Weapons violations | 51 | 84 |
| Dangerous operationData table for Chart 20 Note 2 | 40 | 107 |
| Child sexual abuse and exploitation material | 47 | 27 |
Chart 20 end
In the southern parts of the provinces in 2024, rates of offences against the administration of justice were relatively similar in rural areas (504 incidents per 100,000 population) and urban areas (501 incidents per 100,000 population). In the Provincial North, these rates stood at 987 incidents per 100,000 population in urban areas and 1,899 incidents per 100,000 population in rural areas. Considerable differences were seen across the provinces. For example, police services in rural areas of Prince Edward Island reported 297 offences against the administration of justice per 100,000 population, while those serving rural areas of Saskatchewan reported 2,717 offences per 100,000 population (Table 6).
Differences between rural and urban areas could be partly because of certain characteristics of rural areas, especially in the most remote areas or those in the Provincial North. For instance, access to various elements of the justice system may be limited, and it may be more difficult to comply with conditions such as prohibitions on a range of travel or no-contact orders, particularly in smaller or more isolated communities (Senate of Canada, 2016). Geographic isolation and lack of reliable transportation can also make it more difficult to attend court or participate in court-ordered programs (Aylwin & Moore, 2015). Indigenous people, who account for a greater share of the population in rural and northern regions of the provinces, are also overrepresented among those accused of offences against the administration of justice, partly for the reasons outlined above (Khorrami & Paquin-Marseille, 2025).
The rate of incidents of disturbing the peace is nearly 10 times higher in the rural North than in the urban South
Disturbing the peace is a common offence, but its severity is relatively low. The weight assigned to this offence in calculating the CSI is the lowest of all Criminal Code offences. Like mischief offences, most of these incidents do not lead to charges. In 2024, 0.9% of incidents of disturbing the peace in rural areas led to charges, compared with 1.6% in urban areas.
In 2024, police services in rural areas reported 31,570 incidents of disturbing the peace, a rate of 533 incidents per 100,000 population. This was more than twice the rate in urban areas (191 incidents per 100,000 population) (Chart 20, Table 1).
The rate of incidents of disturbing the peace was particularly high in the Provincial North, and more specifically in the rural North. In these areas, there were 1,613 incidents of disturbing the peace per 100,000 population in 2024, or nearly 10 times the rate in the urban South (176 incidents per 100,000 population).
Disturbing the peace is also one of the offences for which the greatest differences between the provinces were observed. For example, police services in rural areas of Manitoba reported a rate of 1,766 incidents per 100,000 population, which was 162 times higher than the rate in rural areas of Quebec (11 incidents per 100,000 population) (Table 6).
As with mischief, some incidents involving disturbing the peace may be dealt with through municipal by-laws rather than under the Criminal Code, especially in urban areas where such by-laws are in force and where they can be enforced by municipal by-law officers. For this reason, differences may be partly attributable to varying enforcement practices.
Non-violent weapons offences are more prevalent in rural areas
Analyses have shown that the rates and proportion of firearm-related violent crimes are higher in rural areas, particularly in the Provincial North (Conroy, 2025; Cotter, 2025; Perreault, 2026). However, not all firearm-related offences are violent in nature. Some are more administrative in nature, such as the unsafe storage of weapons or inadequate documentation. Weapons possession also falls under the category of non-violent weapons offences.
As with firearm-related violent crimes, rates of non-violent weapons offences are higher in rural areas than in urban areas. Overall, police services serving predominantly rural populations reported nearly 5,000 non-violent weapons offences in 2024, corresponding to 84 incidents per 100,000 population. In urban areas, this rate was 51 incidents per 100,000 population (Chart 20, Table 1).
As with several other offences, the highest rates of non-violent weapons offences were recorded in rural areas of Saskatchewan (262 incidents per 100,000 population) and Manitoba (226 incidents per 100,000 population) (Table 6). Similarly, in the Provincial North, this rate reached 221 incidents per 100,000 population in rural areas, compared with 85 incidents per 100,000 population in urban areas. In the southern parts of the provinces, the rate was 58 incidents per 100,000 population in rural areas and 50 incidents per 100,000 population in urban areas.
Impaired driving incidents are three times more common in rural areas than in urban areas.
Previous studies have revealed higher rates of impaired driving in rural areas or outside CMAs (Cotter, 2025; Perreault, 2023; Perreault, 2021). These differences persisted in 2024. Overall, police services serving predominantly rural populations reported 21,320 impaired driving incidents in 2024 (360 incidents per 100,000 population). By comparison, urban police services reported approximately twice as many incidents, but for a population size six times larger (44,226 incidents, or 126 incidents per 100,000 population) (Table 1).
When the most serious offences are taken into account, the difference between impaired driving rates in urban and rural areas is even more pronounced. In 2024, impaired driving causing bodily injury or death in rural areas occurred at nearly five times the rate in urban areas.
Among the provinces, Saskatchewan had the highest rate of impaired driving in rural areas (773 incidents per 100,000 population), followed by Manitoba (683) and Newfoundland and Labrador (524). The lowest rate was recorded in Ontario (207), followed by Quebec (236) (Table 6).
Impaired driving rates were also higher in rural areas in the Provincial North (678 incidents per 100,000 population) than in urban North (230 incidents per 100,000 population), the rural South (300 incidents per 100,000 population) and urban South (122 incidents per 100,000 population). Overall, the rate of impaired driving in rural areas has declined since 2014 (-9%), particularly because of substantial decreases in rural Alberta (-47%) and Saskatchewan (-23%). However, during the same period, the rate of impaired driving increased considerably in rural areas of Newfoundland and Labrador (+203%), Manitoba (+60%), Prince Edward Island (+40%), and New Brunswick (+29%).
Urban and rural areas differ greatly in terms of travel. In general, the further one is from city centres, the fewer alternatives there are to cars, and the greater the reliance on car use and distances travelled (Affordability Action Council, 2024; Laviolette, 2020; Robertson et al., 2016; Turcotte, 2008). Data from the 2019 General Social Survey – Canadians’ Safety also reveal differences in alcohol consumption habits. Residents of rural areas were slightly more likely than those in urban areas to report at least one episode of heavy drinking—defined as five or more drinks on a single occasion—in the month preceding the survey.
Start of text box 6
Text box 6
The rate of persons charged: Another measure of crime in rural areas
When an offence is reported to the police, the incident may remain unsolved, charges may be laid or recommended against the accused (i.e., the person charged), or the incident may be “cleared otherwise,” a term that encompasses all incidents that have been solved but for which the police do not or cannot lay charges against the accused person.Note
The higher crime rates in rural areas can be partly explained by elevated rates of certain relatively minor offences; these offences are often cleared otherwise. For example, 6% of mischief offences,Note which are very common in rural areas, were cleared by charge in 2024. Thus, the rate of persons charged, i.e., accused persons against whom charges have been laid or recommended, may provide another measure for comparing rural and urban areas.
In 2024, criminal incidentsNote were more likely to be cleared (solved) in rural areas (38%) than in urban areas (32%). However, among cleared incidents, a smaller proportion was cleared by charge in rural areas (53%) than in urban areas (68%). According to a previous study, incidents in rural areas were more often cleared otherwise because the victim has requested that no action be taken or because the police have exercised their discretion (Cotter, 2025).
Consequently, Criminal Code (excluding traffic) offences were equally likely to be cleared by charge in rural areas (23%) as in urban areas (23%). However, differences are observed by the type of offence. For example, 54% of “other Criminal Code offences” were cleared by charge in rural areas, compared with 36% in urban areas.
Overall, the rates of persons charged show a fairly similar pattern to that indicated by crime rates, that is rates are higher in rural areas compared to urban areas. However, differences emerge between the southern and northern parts of the provinces. For example, the gap between rural areas in the north and urban areas in the south is widening in Quebec, Ontario and British Columbia when comparing the rates of persons charged (Chart 21) to the gap observed using crime rates (Chart 9), whereas it is narrowing in other provinces. Likewise, in the southern parts of the provinces, rural areas had lower rates of persons charged than urban areas in almost all provinces (Chart 21), while this was true in half of the provinces when comparing crime rates (Chart 9).
Chart 21 start

Data table for Chart 21
| Urban southern region | Urban northern region | Rural southern region | Rural northern region | |
|---|---|---|---|---|
| rate per 100,000 population aged 12 years and older | ||||
Source: Statistics Canada, Canadian Centre for Justice and Community Safety Statistics, Uniform Crime Reporting Survey. |
||||
| Newfoundland and Labrador | 1,837 | ... not applicable | 926 | 3,970 |
| Prince Edward Island | 1,357 | ... not applicable | 672 | ... not applicable |
| Nova Scotia | 1,286 | ... not applicable | 1,076 | ... not applicable |
| New Brunswick | 1,329 | ... not applicable | 1,175 | ... not applicable |
| Quebec | 1,315 | 1,705 | 1,356 | 6,274 |
| Ontario | 1,153 | 2,438 | 1,053 | 4,364 |
| Manitoba | 1,911 | 12,410 | 1,916 | 8,197 |
| Saskatchewan | 4,062 | ... not applicable | 3,149 | 19,549 |
| Alberta | 1,900 | 3,042 | 1,408 | 3,290 |
| British Columbia | 713 | 2,011 | 815 | 2,097 |
| All provinces | 1,314 | 2,338 | 1,341 | 4,884 |
Chart 21 end
End of text box 6
Summary
In recent years, numerous studies have revealed higher crime rates in rural areas (areas outside CMAs or CAs) than in urban areas (CMAs or CAs) in Canada. In 2024, the rate of police-reported crime in all rural areas of the provinces (7,421 incidents per 100,000 population) was 42% higher than that in urban areas (5,235 incidents per 100,000 population). In addition, the gap between rural and urban areas has widened in recent years. Since 2014, the crime rate has increased by 21% in rural areas, while it has grown by 10% in urban areas.
However, rural areas are highly diverse—socioeconomically, demographically and geographically. Some rural areas do actually record very low crime rates. In 2024, proportionally three times more residents of rural areas (6.4%) than urban areas (2.0%) lived in an area with a very low crime rate (fewer than 2,000 incidents per 100,000 population). In contrast, they were also almost six times more likely (11%) than urban residents (2.0%) to live in an area with a very high crime rate (12,000 or more incidents per 100,000 population).
In rural areas (outside CMAs or CAs), crime rates were generally higher in small population centres (i.e., villages and small towns) (11,063 incidents per 100,000 population) than in the most rural areas (i.e., outside population centres) (6,522 incidents per 100,000 population). In urban areas (CMAs or CAs), crime rates were lower in rural fringes (i.e., outside urban cores and population centres).
Higher crime rates in rural areas largely reflect higher rates in the Provincial North, which is home to a larger proportion of the rural population than the urban population. Both rural areas (17,766 incidents per 100,000 population) and urban areas (8,603 incidents per 100,000 population) in the Provincial North recorded high crime rates. In the southern parts of the provinces, the crime rate recorded in rural areas (5,468 incidents per 100,000 population) was closer to that recorded in urban areas (5,106 incidents per 100,000 population).
Similarly, a larger proportion of the rural population lives in the Prairie provinces, where crime rates are generally higher than those in other provinces. Nevertheless, in all provinces except Prince Edward Island and Ontario, the rate of police-reported crime in 2024 was higher in rural areas than in urban areas.
Several analyses and studies have highlighted the issues of crime and violence resulting from colonization, marginalization and systemic discrimination against Indigenous people in Canada. Thus, these issues may be more likely to impact rural crime numbers, especially in the North, where they account for a larger share of the population. On the other hand, Indigenous communities are also more likely to provide culturally appropriate supports, which in turn may help to prevent crime. While the overall higher rates of violence and victimization among indigenous people may partly explain some of the differences observed between rural and urban areas, Indigenous police services (police services managed by an Indigenous community) serving rural areas also reported an overall crime rate approximately twice that of Indigenous police services serving predominantly urban populations.
Overall, the differences between rural and urban areas were more pronounced for certain crimes. For example, while rural areas accounted for 14% of the total population in the provinces in 2024, they accounted for 22% of violent crimes. The difference was particularly pronounced for aggravated sexual assaults or those causing bodily harm (levels 2 and 3), aggravated assaults (level 3), firearm-specific offences, uttering threats, and harassing or indecent communications. In 2024, there were 173 police-reported homicides in rural areas (2.92 homicides per 100,000 population), which is 70% higher than the rate in urban areas (605 homicides, or 1.72 homicides per 100,000 population).
The gap between rural and urban areas was much less pronounced for property crimes, 17% of which were recorded in rural areas. Rural areas saw a disproportionate number of mischief incidents, with 1,627 incidents per 100,000 population, compared with 567 incidents per 100,000 population in urban areas. These offences, which are often minor in nature, rarely lead to charges, and some can sometimes be dealt with outside the criminal justice system (e.g., by municipal by-law enforcement officers). In contrast, police services in urban areas reported much higher rates of theft of $5,000 or under and shoplifting. The rates of theft over $5,000 and breaking and entering were nevertheless higher in rural areas.
Incidents involving disturbing the peace, non-violent weapons offences (e.g., possession of a weapon, unsafe storage or documentation offences), and impaired driving were also among the offences with considerably higher rates in rural areas than in urban areas.
Detailed data tables
Table 1 Police-reported crimes, selected offences, urban and rural areas, provinces, 2024
Table 3 Police-reported crime rates by offence category and province, urban and rural areas, 2024
Table 4 Crime Severity Index by province, urban and rural areas, 2024
Table 5 Police-reported crime rates, capitals and non-capital communities, territories, 2024
Table 6 Police-reported crimes, selected offences, rural areas, by province, 2024
Table 7 Police-reported crimes, selected offences, urban areas, by province, 2024
Survey description
Uniform Crime Reporting Survey
The Uniform Crime Reporting (UCR) Survey was established in 1962 with the co-operation and assistance of the Canadian Association of Chiefs of Police. The UCR Survey measures criminal incidents that have been reported to federal, provincial or territorial, and municipal police services in Canada.
One incident can involve multiple offences. To ensure comparability, counts presented in this article are based on the most serious offence in the incident as determined by a standard classification rule used by all police services. Counts based on all violations are available upon request.
Data from the UCR are used to calculate both the traditional crime rate and the Crime Severity Index (CSI). The traditional crime rate and the CSI are based on the aggregate count of criminal incidents. A criminal incident involves one or more related offences that are committed during a single criminal event and have been reported to police. Where there are multiple victims within a single criminal event, a separate aggregate incident is counted for each victim. For example, a single incident involving an assault on three victims at the same time and location is counted in the aggregate statistics as three incidents of assault. For an incident to be counted in the crime statistics, it must be recorded as “founded” as opposed to “unfounded.” An incident is “founded” if, after police investigation, it has been determined that the reported offence did occur or was attempted or there is no credible evidence to confirm that the reported incident did not take place. This includes third-party reports that fit these criteria.
Homicide Survey
The Homicide Survey collects police-reported data on the characteristics of all homicide victims, accused persons and incidents in Canada. The Homicide Survey began collecting information on all homicides in 1961.
Whenever a homicide becomes known to police, the investigating police service completes the survey questionnaires, which are then sent to Statistics Canada. There are cases where homicides become known to police months or years after they occurred. These incidents are counted in the year in which they become known to police. Information on persons accused of homicide are only available for solved incidents (i.e., where at least one accused has been identified).
References
Affordability Action Council. (2024). Rural Recognition: Affordable and Safe Transportation Options for Remote Communities. Policy brief.
Aguiar, W. & Halseth, R. (2015). Aboriginal peoples and historic trauma: The processes of intergenerational transmission. National Collaborating Centre for Aboriginal Health.
Allen, M. (2020). Crime reported by police serving areas where the majority of the population is Indigenous, 2018. Juristat. Statistics Canada Catalogue no. 85-002-X.
Allen, M. & Perreault, S. (2015). Police-reported crime in Canada’s Provincial North and Territories, 2013. Juristat. Statistics Canada Catalogue no. 85-002-X.
Assembly of First Nations. (2025). Submission to the House of Commons Standing Committee on Indigenous and Northern Affairs. Study on Indigenous Policing and Public Safety. October 2025.
Assembly of First Nations. (2023). Assembly of First Nations Supports Indigenous Police Chiefs of Ontario Federal Court Motion. Press release, June 12, 2023.
Aylwin, N. & Moore, L. (2015). Rural and remote access to justice: A literature review. Canadian Forum on Civil Justice, 51.
Behrend, R. (2025). Overview of First Nations and Inuit police funding and spending. Office of the Parliamentary Budget Officer.
Bell, D. (2006). Variation on the rural idyll. In P. Cloke, T. Marsden et P. Mooney, Handbook of Rural Studies (149‐160). Sage.
Bombay, A., Matheson, K. & Anisman, H. (2014). The intergenerational effects of Indian Residential Schools: implications for the concept of historical trauma. Transcult Psychiatry, 51(3), 320-338.
Boyce, J. (2016). Victimization of Aboriginal people in Canada, 2014. Juristat. Statistics Canada Catalogue no. 85-002-X.
Burczycka, M. (2022). Women’s experiences of victimization in Canada’s remote communities. Juristat. Statistics Canada Catalogue no. 85-002-X.
Burczycka, M. (2021). Workers’ experiences of inappropriate sexualized behaviours, sexual assault and gender-based discrimination in the Canadian provinces, 2020. Juristat. Statistics Canada Catalogue no. 85-002-X.
Burczycka, M. (2020). Students’ experiences of unwanted sexualized behaviours and sexual assault at postsecondary schools in the Canadian provinces, 2019. Juristat. Statistics Canada Catalogue no. 85-002-X.
Burczycka, M. & Munch, C. (2015). Trends in offences against the administration of justice. Juristat. Statistics Canada Catalogue no. 85-002-X.
Canadian Municipal Network on Crime Prevention. (2020). Rural Crime Prevention. Topic Summary.
Ceccato, V. (2025). Rural Criminology: Unveiling Its Importance and the Path Forward. Annual Review of Criminology, 8(1), 377-401.
Ceccato, V. (2022). Rurality, crime and fear of crime. Rural Victims of Crime, 38-48.
Ceccato, V. & Abraham, J. (2022). Crime and safety in the rural: Lessons from research. Springer.
Chainey, S. P. (2021). A comparison of burglary near repeat victimization between rural and urban areas using a target-based assessment of criminal opportunity. International criminal justice review, 31(4), 405-419.
Comack, E. (2018). Corporate colonialism and the “crimes of the powerful” committed against the Indigenous peoples of Canada. Critical Criminology, 26(4), 455-471.
Conroy, S. (2025). Firearms and violent crime in Canada, 2023. Juristat. Statistics Canada Catalogue no. 85-002-X.
Conroy, S. (2024). Recent trends in police-reported clearance status of sexual assault and other violent crime in Canada, 2017 to 2022. Juristat. Statistics Canada Catalogue no. 85-002-X.
Conroy, S. (2021). Spousal violence in Canada, 2019. Juristat. Statistics Canada Catalogue no. 85-002-X.
Cotter, A. (2025). Characteristics of police-reported crime in rural areas in the Canadian provinces, 2023. Juristat. Statistics Canada Catalogue no. 85-002-X.
Cotter, A. (2021). Intimate partner violence in Canada: An overview. Juristat. Statistics Canada Catalogue no. 85-002-X.
Cotter, A. (2016). Canadians’ perceptions of neighbourhood disorder, 2014. Spotlight on Canadians: Results from the General Social Survey, Statistics Canada Catalogue no. 89-652-X.
Cotter, A. & Burczycka, M. (2026). Gender differences in experiences of violence and unwanted sexual behaviour in Canada, 2025. Juristat. Statistics Canada Catalogue no. 85-002-X.
Cotter, A. & Savage, L. (2019). Gender-based violence and unwanted sexual behaviour in Canada, 2018: Initial findings from the Survey of Safety in Public and Private Spaces. Juristat. Statistics Canada Catalogue no. 85-002-X.
David, J. D. (2023). Rethinking perceptions of crime and safety in rural and remote communities. The British Journal of Criminology, 63(2), 511-528.
DeKeseredy, W. S. (2020). Woman abuse in rural places. Routledge.
Department of Justice Canada. (2025). Understanding the Overrepresentation of Indigenous People - State of the Criminal Justice System Dashboard.
Donnermeyer, J. F. & DeKeseredy, W. S. (2008). Toward a rural critical criminology. Journal of Rural Social Sciences, 23(2), 2.
Farrall, S.D., Jackson, J., & Gray, E. (2009). Social order and the fear of crime in contemporary times. Oxford University Press.
Fitzgerald, R. (2008). Fear of Crime and the Neighbourhood Context in Canadian Cities. Crime and Justice Research Paper Series, Statistics Canada Catalogue no. 85-561.
Gallent, N. & Gkartzios, M. (2019). Defining rurality and the scope of rural planning, 17-27. London: Routledge.
Hale, R., Harkness, A., & Mulrooney, K.J.D. (2023). Measuring and researching rural victimization. Dans R. Hale & A. Harkness (dirs.), Rural Victims of Crime: Representations, Realities and Responses. New York. Routledge.
Halfacree, K. (2006). Rural space: constructing a three-fold architecture. Handbook of rural studies, 44, 62.
House of Commons Canada. (2024). Fighting the phenomenon of vehicle thefts in Canada: Report of the Standing Committee on Public Safety and National Security.
House of Commons Canada. (2019). Study on crime in rural areas in Canada: Report of the Standing Committee on Public Safety and National Security.
Kahnawà:ke Mohawk Peacekeepers. (2025). Indigenous Policing:Canada’s Untapped National Security Asset. Brief submitted to the Standing Committee on Indigenous and Northern Affairs. Study on Indigenous Policing and Public Safety. October 2025.
Khorrami, M. & Paquin-Marseille. (2025). Disparities in decision and sentencing outcomes between Indigenous accused and White accused in adult criminal court, 2016/2017 to 2020/2021. Juristat. Statistics Canada Catalogue no. 85-002-X.
Kitchen, P. (2006). Exploring the Link between Crime and Socio-Economic Status in Ottawa and Saskatoon: A Small-Area Geographical Analysis. Department of Justice Canada, Research and Statistics Division.
Kowalski, M. (2002). Home Invasions. Bulletin - Canadian Centre for Justice Statistics, Statistics Canada Catalogue no. 85F0027-X.
Krausz, M., Strehlau, V., Choi, F., Bhugra, D., Ventriglio, A. & Castaldelli-Maia, J. M. (2019). Urbanization and marginalization.Urban mental health, 96.
Laviolette, J. (2020). L’état de l’automobile au Québec : constats, tendances et conséquences. Rapport final de recherche – partie 1. David Suzuki Foundation.
Letourneau, N., McBride, D.L., Barton, S.S., & Griggs, K. (2023). Service providers’ perspectives: Reducing intimate partner violence in rural and northern regions of Canada. Canadian Journal of Nursing Research, 55(2), 165-175.
Lithopoulos, S. (2016). Lifecycle of First Nation Administered Police Services in Canada. Public Safety Canada.
Little, J., Panelli, R. & Kraack, A. (2005). Women's fear of crime: A rural perspective. Journal of Rural Studies, 21(2), 151-163.
Lockie, S. & Bourke, L. (2001). Rurality Bites: The social and environmental transformation of rural Australia. Pluto.
Lupton, D. (1999). Dangerous places and the unpredictable stranger: Constructions of fear of crime. Australian & New Zealand Journal of Criminology, 32(1), 1-15.
Marshall, B., & Johnson, S. (2005). Crime in rural areas: A review of the literature for the rural evidence research centre. Jill Dando Institute of Crime Science, University College, London.
Milligan, S. (2011). Criminal harassment in Canada, 2009. Juristat Bulletin. Statistics Canada Catalogue no. 85-005-X.
Moreau, G. (2021). Police-reported crime statistics in Canada, 2021. Juristat. Statistics Canada Catalogue no. 85-002-X.
Moreau, G. (2019). Police-reported crime statistics in Canada, 2018. Juristat. Statistics Canada Catalogue no. 85-002-X.
Murdock, L. (2024). The health of Indigenous people residing in urban centres. National Collaborating Centre for Indigenous Health.
Nishnawbe Aski Police Service. (2025). About - Nishnawbe Aski Police Service. Accessed on December 7, 2025.
Nunavik Police Service. (2025). About Us - Nunavik Police Service. Accessed on December 7, 2025.
Office of the Auditor General of Canada. (2024). Report 3—First Nations and Inuit Policing Program. Reports of the Auditor General of Canada to the Parliament of Canada. Independent Auditor’s Report.
Pekuakamiulnuatsh Takuhikan. (2025). Sous-financement des services policiers autochtones : le Canada débouté devant la Cour d’appel fédérale (in French only). Press release. February 6, 2025.
Perreault, S. (2026). Firearms and violent crime in Canada, 2024. Juristat. Statistics Canada Catalogue no. 85-002-X.
Perreault, S. (2023). Police-reported crime in rural and urban areas in the Canadian provinces, 2021. Juristat. Statistics Canada Catalogue no. 85-002-X.
Perreault, S. (2022). Victimization of First Nations people, Métis and Inuit in Canada. Juristat. Statistics Canada Catalogue no. 85-002-X.
Perreault, S. (2021). Impaired driving in Canada, 2019. Juristat. Statistics Canada Catalogue no. 85-002-X.
Perreault, S. (2020). Gender-based violence: Sexual and physical assault in Canada’s territories, 2018. Juristat. Statistics Canada Catalogue no. 85-002-X.
Perreault, S. (2019). Police-reported crime in rural and urban areas in the Canadian provinces, 2017. Juristat. Statistics Canada Catalogue no. 85-002-X.
Perreault, S. (2017). Canadians’ perceptions of personal safety and crime, 2014. Juristat. Statistics Canada Catalogue no. 85-002-X.
Public Safety Canada. (2025a). Rural Crime. Parliamentary Committee Notes. Accessed on December 7, 2025.
Public Safety Canada. (2025b). National Action Plan on Combatting Auto Theft. Accessed on December 7, 2025.
Public Safety Canada. (2024). Government of Canada hosts National Summit on Combatting Auto Theft - Canada.ca. Press release, February 8, 2024.
Public Safety Canada. (2022). First Nations and Inuit Policing Program. Accessed on December 7, 2025.
Robertson, R. D., Wicklund, C., Holmes, E. & Biderman, P. (2016). Impaired driving in rural jurisdictions: Problems and solutions. Traffic Injury Research Foundation.
Rotenberg, C. & Cotter, A. (2018). Police-reported sexual assaults in Canada before and after #MeToo, 2016 and 2017. Juristat. Statistics Canada Catalogue no. 85-002-X.
Royal Canadian Mounted Police. (2025). First Nations and Inuit Policing Program. Accessed on December 7, 2025.
Ruddell, R., & Lithopoulos, S. (2013). Aboriginal policing in rural Canada: Establishing a research agenda. International Journal of Rural Criminology, 2(1), 101-125.
Ruddell, R. & O’Connor, C. (2022). What do the rural folks think? Perceptions of police performance. Policing: a journal of policy and practice, 16(1), 107-121.
Sapp, K. (2023). Exploring the Offending Puzzle: Unveiling the Characteristics of the Offending Populations. In Understanding Offending Populations and the Power of Correctional Psychotherapy: Unlocking Insights, 17-27. Cham: Springer International Publishing.
Savage, L. (2025). Patterns of re-offending among accused persons living in rural areas of the Canadian provinces, 2014 to 2023. Juristat. Statistics Canada Catalogue no. 85-002-X.
Savage, L., Maxwell, A., Burczycka, M., Heidinger, L. & Mansour, M. (2025). Characteristics of police-reported crime in rural areas, 2023: Provincial fact sheets. Juristat. Statistics Canada Catalogue no. 85-002-X.
Scott, H. (2003). Stranger Danger: Explaining Women's Fear of Crime. Western criminology review, 4(3)
Senate of Canada. (2016). Delaying justice is denying justice. An urgent need to address lengthy court delays in Canada. Report of the Standing Senate Committee on Legal and Constitutional Affairs.
Supreme Court of Canada. (2024). Quebec (Attorney General) v. Pekuakamiulnuatsh Takuhikan. Supreme Court Judgments. November 27, 2024.
Statistics Canada. (2026). Police-reported cybercrime, by cyber-related violation, Canada (selected police services). Data table 35-10-0001-01.
Statistics Canada. (2025). Police-reported crime statistics in Canada, 2024. The Daily, July 22, 2025.
Statistics Canada. (2022). Definitions, Data Sources and Methods — Statistical Classifications: North and South — Variant of Standard Geographical Classification (SGC) 2021.
Subedi, R., Greenberg, T. L. & Roshanafshar, S. (2019). Does geography matter in mortality? An analysis of potentially avoidable mortality by remoteness index in Canada. Health Reports. Statistics Canada Catalogue no. 82-003-X
Sutton, D. (2023). Gender-related homicide of women and girls in Canada. Juristat. Statistics Canada Catalogue no. 85-002-X.
Truth and Reconciliation Commission of Canada. (2015). Honouring the truth, reconciling for the future: summary of the final report of the Truth and Reconciliation Commission of Canada. Winnipeg, Manitoba.
Turcotte, M. (2008). Dependence on cars in urban neighbourhoods. Canadian Social Trends. Statistics Canada Catalogue no. 11-008-X.
Ukert, B., Wiebe, D. J. et Humphreys, D. K. (2018). Regional differences in the impact of the “Stand Your Ground” law in Florida. Preventive Medicine, 115, 68-75.
Wilson, C. R., Rourke, J., Oandasan, I. F. &t Bosco, C. (2020). Progress made on access to rural health care in Canada. Canadian Family Physician, 66(1), 31-36.
Wood, K., Giesbrecht, C. J., Brooks, C. & Arisman, K. (2025). “I couldn’t leave the farm”: rural women's experiences of intimate partner violence and coercive control. Violence Against Women, 31(12-13), 3330-3354.
Youngson, N., Saxton, M., Jaffe, P.G., Chiodo, D., Dawson, M., & Straatman, A.-L. (2021). Challenges in risk assessment with rural domestic violence victims: Implications for practice. Journal of Family Violence, 36(5), 537-550.
- Date modified: