
Future contacts with the criminal justice system in Saskatchewan: A microsimulation study

Archived Content
Information identified as archived is provided for reference, research or recordkeeping purposes. It is not subject to the Government of Canada Web Standards and has not been altered or updated since it was archived. Please "contact us" to request a format other than those available.
by Yvan Clermont, Youssouf Azmi, Shana Conroy, Lynn Barr-Telford, Jean-Dominique Morency and Laurent Martel
Executive summary
The Canadian Centre for Justice Statistics and the Demography Division’s microsimulation team at Statistics Canada have collaborated on a pilot study that aims to take advantage of Demosim—a microsimulation model that can project a large number of demographic characteristics of the population—to develop population projections of individuals who come into contact with the criminal justice system (i.e., the police) as persons accused of committing crime in Saskatchewan. The likelihood of coming into contact with police was estimated using a set of demographic characteristics (age, sex, Indigenous identity, visible minority status, place of birth, place of residence, marital status and highest level of education) in the census database that are projected into the future in Demosim.
This microsimulation model also allowed for the production of population projections based on hypothetical scenarios. Specifically, how would increasing the educational attainment of certain vulnerable populations—in this case, Indigenous people—affect the number of people who come into contact with the criminal justice system in Saskatchewan as persons accused of crime?
Given the nature of this pilot study, results should be interpreted with caution. It is important to note that the probabilistic model used to establish the projections has some limitations because of the limited range of variables that were available. The projections derived by the microsimulation model are dependent on the criminal justice system’s general response to delinquency; here, an assumption is made that this response remains the same over time (per 2011 conditions). Likewise, the impact of the variables on the likelihood of coming into contact with police is assumed to remain the same over the course of the projection. Despite these limitations, these projections offer an innovative way to get a sense of the evolution of the demand on the criminal justice system and a tool to analyze its future sensitivity to other factors.
This pilot study is an initial attempt by Statistics Canada to take advantage of the large-scale integration of data from various areas to simulate the impact of different social integration scenarios—for example, in education—on the pressure placed on the criminal justice system. This study does not identify methods for improving the educational attainment of Indigenous people. It only evaluates the possible impacts—including the value of intervention to attain this objective—to reduce the pressure of current conditions on the criminal justice system in Saskatchewan. With these factors in mind, this pilot study has produced a set of innovative and relevant results that are summarized below.
Summary of results
Crime remains a major challenge in Saskatchewan where, in 2018, the police-reported crime rate was more than double the national overall crime rate. This difference has remained consistent over time. The overrepresentation of Indigenous people in the criminal justice system in Saskatchewan also represents a major challenge. While Indigenous people represented 16% of the Saskatchewan population in 2016, 74% of adult admissions to custody in 2017/2018 were Indigenous offenders.
Between 2011 and 2036, the Saskatchewan population is projected to increase 16% (according to a medium growth scenario). Population growth varies greatly by Indigenous identity: while the non-Indigenous population in the province is projected to grow by 10%, the Indigenous population is projected to grow by 46%.
Taking into account the projected evolution of the Saskatchewan population—and the relationship between the demographic characteristics of the population and the probability of coming into contact with the criminal justice system as a person accused of committing a crime—the number of people aged 12 and older who come into contact with police between 2011 and 2036 is projected to increase by 27%. Therefore, in relative terms, it is expected that the number of individuals who have contact with the criminal justice system will greatly exceed population growth.
The projected growth in the number of contacts would come from an increase in the number of Indigenous people who come into contact with police in Saskatchewan. As the Indigenous population is projected to grow by 46%, the number of Indigenous people who come into contact with police would increase by 58%. In contrast, the number of non-Indigenous people who come into contact with police would decrease by 14%.
The large discrepancy between the projected numbers of Indigenous and non-Indigenous people who come into contact with police is likely attributable to many factors. One of the most important is the projected increase of young Indigenous people in the population. Involvement in crime is highly related to age, which is a compounding factor for projected conditions for Indigenous people. In contrast, aging among the non-Indigenous population acts as a contributing factor in their projected decrease for involvement in crime.
This microsimulation study also helped to quantify, according to various scenarios, the potential impact that a reduction in the educational attainment gap between Indigenous and non-Indigenous people could have on the number of contacts with police for those accused of committing crime—and thus their contacts with the criminal justice system—in the years to come.
If improvements were made for the educational attainment of Indigenous people in Saskatchewan, different scenarios could materialize. For example, if there had been a 100% instant reduction in the educational attainment gap between Indigenous and non-Indigenous people (meaning educational attainment for Indigenous people had been comparable to that of non-Indigenous people at the beginning of the projection period in 2011), the number of people who come into contact with police is projected to increase 7% by 2036. As mentioned, it is projected that the population in Saskatchewan would grow by 16% during that same time period. Since a reduction in the educational attainment gap can only be achieved in the future, it is more realistic to consider scenarios where improvements to educational attainment are achieved over time.
That being said, if there was a 25% progressive reduction in the educational attainment gap over the course of the projection period, the number of people who have contact with police is projected to increase by 25% between 2011 and 2036. Further, a 50% progressive reduction in the gap is projected to result in a 22% increase in the number of people who have contact with police while a 100% progressive reduction is projected to result in a 17% increase. These scenarios represent an improvement over the projected scenario where there is no reduction in the gap (27% increase in the number of contacts). Thus, reducing the educational attainment gap between Indigenous and non-Indigenous people could decrease the number of people who come into contact with the criminal justice system in Saskatchewan in the years to come.
In Canada, IndigenousNote people—that is, those who are First Nations, Métis and Inuit—are overrepresented among those accused of committing crime (Beattie et al. 2018; Brennan and Matarazzo 2016; Malakieh 2019) and they have higher rates of victimization compared to the non-Indigenous population (Boyce 2016; Perreault 2015). In terms of those accused of crime, the overrepresentation of Indigenous people is one consequence of Canada’s colonial history (Cesaroni et al. 2019; Corrado et al. 2014; Nielsen and Robyn 2003; Rudin 2005). The Supreme Court of Canada has called the overrepresentation of Indigenous people “a crisis in the Canadian criminal justice system” (R. v. Gladue 1999). In Saskatchewan specifically, a province with one of the largest proportions of Indigenous people, the overrepresentation of Indigenous people among those accused of crime is particularly glaring.
Criminal justice statistics are often descriptive in nature, summarizing current issues or analyzing past trends; however, this study examines future conditions to explore how to reduce the number of individuals who come into contact with the criminal justice system (i.e., the police) as persons accused of committing crime. By taking a forward-thinking and long-term view of the criminal justice system while considering societal factors more broadly, targeted strategies can be used to improve outcomes for individuals, and reduce offending and the resulting personal and societal costs.
This Juristat article provides information from several data sources to explore current conditions in Saskatchewan and the province’s criminal justice system. Projections, created through Statistics Canada’s Demosim microsimulation model, are presented to demonstrate how positive outcomes can be reached through possible education-related intervention; however, methods for improving educational attainment are not explored in this study. Educational attainment was selected for analysis as research has often explored the link between education and criminal behaviour (Dennison and Swisher 2019; Groot and van den Brink 2010; Hjalmarsson et al. 2014; Perreault 2009; Rubin et al. 2006), and the data were readily available. As this microsimulation study is a pilot project, results should be interpreted with caution.
Statistics Canada has been actively working on increasing the relevance and timeliness of the information it provides, while building stronger and more collaborative partnerships with key stakeholders. Statistics Canada continues to innovate its approach to data collection and analysis. This microsimulation study is one such effort and it has benefited from the contributions of many. The Canadian Centre for Justice Statistics and the Demography Division at Statistics Canada would like to acknowledge the province of Saskatchewan and, in particular, the Ministry of Corrections and Policing in Saskatchewan.
Start of text box 1
Text box 1
The Indigenous population in Canada
The Indigenous population faces historical and present-day conditions unique from other groups in Canada. The negative impacts of colonization and assimilation practices on Indigenous people and their communities have been well-documented. These include—but are not limited to—intergenerational trauma, displacement, poverty, social exclusion and a loss of identity, language and tradition (Cooke and McWhirter 2011; Cornell and Jorgensen 2019; Kendall 2001; Kirmayer et al. 2014; Nutton and Fast 2015; Sinclair 2007; Wesley-Esquimax and Smolewski 2004).
The residential school system—a devastating example of colonialism in Canada—resulted in a “cultural genocide” among the Indigenous population (Truth and Reconciliation Commission of Canada 2015a). In 2015, the Truth and Reconciliation Commission of Canada released 94 calls to action to “redress the legacy of residential schools and advance the process of Canadian reconciliation” (Truth and Reconciliation Commission of Canada 2015b). The calls to action included eliminating the education gap between Indigenous and non-Indigenous people and—under the theme of justice—eliminating the overrepresentation of Indigenous people in custody.
It is important to note that while this study discusses deficits related to social and economic factors—including educational attainment—and the criminal justice system, it does not intend to portray the Indigenous population as somehow “less than.” While a deficit approach “situates responsibility for problems with the affected individuals or communities, overlooking the larger socio-economic structures in which they are embedded,” a strengths-based approach includes themes such as cultural appropriateness, resilience and empowerment (Fogarty et al. 2018). The deficits outlined in this article are greatly impacted by systemic barriers that are largely the result of Canada’s history of colonization and the compounding impacts on Indigenous people.
While this study does not explore methods for reducing the educational attainment gap, research has established that any measures should be culturally appropriate—respecting Indigenous cultures, languages and traditions—and support self-determination among the Indigenous population. For more information on issues related to Indigenous education, see Council of Ministers of Education, Canada 2012, Gallop and Bastien 2016, Korpal and Wong 2015, Miller 2018, Munroe et al. 2013, Nguyen 2011 and Preston 2016.
End of text box 1
Current conditions in Saskatchewan
According to the latest Census of Population, there were 1,673,780 Indigenous people in Canada in 2016, representing approximately 5% of the population (Statistics Canada 2019e). In comparison, Saskatchewan represented 3% of the Canadian population and had 10% of the Indigenous population. As such, among the provinces, Saskatchewan had one of the largest proportions of Indigenous people (16% of its population), second only to Manitoba (18%).Note
In Canada, the Indigenous population is younger than the non-Indigenous population. For instance, while similar proportions of the non-Indigenous population were aged 14 and younger or 65 and older (both 16%) in 2016, 27% of Indigenous people were 14 and younger while 7% were aged 65 and older (Table 1).Note This variation was even larger among the Indigenous population in Saskatchewan as one in three (33%) was aged 14 or younger while one in twenty (5%) was aged 65 or older.
The pace at which the population grows differs among regions and among sub-populations. While the Canadian population grew by 11% between 2008 and 2018, the Saskatchewan population grew by 14% (Statistics Canada 2019f). It is projected that by 2036, Indigenous people in Saskatchewan would represent between 18% to 23% of the provincial population by 2036 (Morency et al. 2015). Among the youngest census cohort—those aged 14 and younger—the projected growth is even more pronounced: Indigenous people would represent 23% to 35% of that age group in Saskatchewan. One such factor that contributes to this growth is a higher fertility rate among Indigenous women than their non-Indigenous counterparts in Canada (2.2 versus 1.6 children per woman in 2011).
Education plays an important role in future employment outcomes, and previous studies have shown that employment rates and median total income increase with education (Kelly-Scott 2016; Kelly-Scott and Smith 2015). When it comes to educational attainment,Note three in ten (29%) Indigenous people in Saskatchewan had no certificate, diploma or degree in 2016 (Table 1). This was higher than both the overall Indigenous population in Canada (26%) and non-Indigenous people in Saskatchewan (10%). In terms of labour force status,Note Indigenous people in Saskatchewan had a higher unemployment rate (18.6) than their non-Indigenous counterparts in the province (5.6) and Indigenous people in Canada more broadly (15.2).
The health of individuals also plays a pivotal role in their living conditions. According to the Aboriginal Peoples Survey and the Canadian Community Health Survey, Indigenous people living off-reserve in Saskatchewan were less likely than those who were non-Indigenous to state that their overall healthNote was excellent or very good (54% versus 59%) (Kelly-Scott 2016). Similarly, Indigenous people in Canada were less likely than those who were non-Indigenous to state that their overall health was excellent or very good (52% versus 60%) (Kelly-Scott and Smith 2015). Among those living off-reserve in Saskatchewan, 63% of Indigenous people stated that their mental healthNote was excellent or very good, while 69% of non-Indigenous people said the same. Nationally, 61% of Indigenous people stated that their mental health was excellent or very good, while 72% of non-Indigenous people said the same.
In 2016, more than one-quarter (28%) of Indigenous people in Saskatchewan lived in housing that was considered not suitable—meaning that they lived in dwellings that did not have enough bedrooms for the size and composition of the household (Table 1). This compared to 6% of their non-Indigenous counterparts in the province and 18% of Indigenous people in Canada overall. While about one in four (24%) Indigenous people in Saskatchewan lived in a dwelling requiring major repairs—such as defective plumbing or electrical wiring, or structural damage to walls, floors or ceilings—it was less common for non-Indigenous people in the province (7%) and Indigenous people in Canada overall (19%).
Compared to provincial-territorial and local governments overall, provincial and local governments in Saskatchewan spent more per capita in 2017 in certain areas such as education (+32%), public order and safety (+23%) and health (+6%) (Statistics Canada 2018a). In Saskatchewan, spending related to social protection—including sickness and disability, unemployment, housing and social exclusion, among others—was also 22% higher than elsewhere in the country. These expenditures—in combination with the social conditions—may create challenges for Saskatchewan in terms of sustainability (Statistics Canada 2018b).
The criminal justice system in Saskatchewan
Policing
The police are the first point of contact when someone is accused of a crime and, as such, the police are the point of entry for the criminal justice system. It is important to note that not all crimes come to the attention of police and, of those that do, not all result in charges.
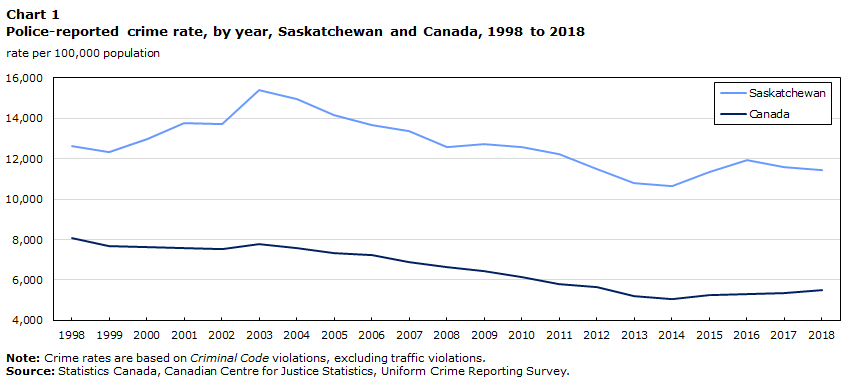
Crime remains a major challenge in Saskatchewan where, in 2018, the police-reported crime rate was 11,461 incidents per 100,000 population (Chart 1). This was more than double the national overall crime rate of 5,488, and this difference has remained consistent over time. While the crime rate decreased by 9% in Saskatchewan over the last two decades (1998 to 2018), it decreased by a larger extent in Canada overall (-32%).
Chart 1 start
Data table for Chart 1
| Year | Saskatchewan | Canada |
|---|---|---|
| rate per 100,000 population | ||
| 1998 | 12,637 | 8,092 |
| 1999 | 12,354 | 7,694 |
| 2000 | 12,996 | 7,607 |
| 2001 | 13,766 | 7,587 |
| 2002 | 13,691 | 7,512 |
| 2003 | 15,417 | 7,770 |
| 2004 | 14,971 | 7,600 |
| 2005 | 14,141 | 7,325 |
| 2006 | 13,656 | 7,245 |
| 2007 | 13,370 | 6,908 |
| 2008 | 12,570 | 6,631 |
| 2009 | 12,709 | 6,461 |
| 2010 | 12,577 | 6,159 |
| 2011 | 12,228 | 5,780 |
| 2012 | 11,489 | 5,638 |
| 2013 | 10,778 | 5,206 |
| 2014 | 10,641 | 5,061 |
| 2015 | 11,364 | 5,232 |
| 2016 | 11,926 | 5,297 |
| 2017 | 11,572 | 5,375 |
| 2018 | 11,461 | 5,488 |
|
Note: Crime rates are based on Criminal Code violations, excluding traffic violations. Source: Statistics Canada, Canadian Centre for Justice Statistics, Uniform Crime Reporting Survey. |
||
Chart 1 end
Among the provinces in 2018, Saskatchewan had the highest police-reported crime rate, and crime was more serious overall (Moreau 2019).Note Further, Regina and Saskatoon were among the three census metropolitan areas (CMAs)Note with the highest crime rates (9,521 and 8,795 per 100,000 population, respectively),Note and they were among the four CMAs with the most serious crime.Note
The police-reported crime rate in northern Saskatchewan was much higher than southern Saskatchewan (60,497 versus 9,858 per 100,000 population).Note In the north, higher rates of crime were driven by relatively minor offences such as mischief (24,556 per 100,000 population), offences related to the administration of justice (7,689), disturbing the peace (7,133) and common assault (6,982).Note Further, the rural crime rate in Saskatchewan overall was 35% higher than the urban crime rate in Saskatchewan (13,930 versus 10,302).Note This rural-urban difference was, however, largely attributed to the north-south difference in rural rates, which was driven by crime in northern rural Saskatchewan.Note
Corrections
Corrections data highlight the issue of Indigenous overrepresentation in the criminal justice system. While Indigenous people represented approximately 5% of the Canadian population in 2016, in 2017/2018, Indigenous adults aged 18 and older were overrepresented among admissions to federalNote (29%) and provincial/territorialNote (30%) custody, including sentenced custody, remandNote and other temporary detention (Malakieh 2019).Note During the same time period, Indigenous offenders accounted for 43% of admissions to corrections for youth aged 12 to 17.
The degree to which Indigenous people are overrepresented among those admitted to custody has grown over time in Canada. While, in 2017/2018, about three in ten adult admissions to federal (29%) and provincial/territorial (30%) custody were Indigenous offenders, Indigenous adults accounted for 20% of federal admissions and 21% of provincial/territorial admissions in 2007/2008.
Indigenous overrepresentation in custody also varies across the country. For instance, in Ontario, Quebec and British Columbia—the three provinces with the largest populations overall—3%, 2% and 6% of their respective populations were Indigenous in 2016. Meanwhile, in these provinces, Indigenous offenders accounted for 12%, 5% and 32% of all adult admissions in 2017/2018, respectively. In Saskatchewan—where Indigenous people represented 16% of the population—74% of adult admissions to custody were Indigenous offenders. More specifically, while Indigenous males represented 73% of male admissions to adult custody, Indigenous females represented 82% of female admissions.
In general, Saskatchewan has high rates of adults (including both Indigenous and non-Indigenous offenders) in remand, in sentenced custody and on probation. Among the provinces in 2017/2018, Saskatchewan had the highest rate for sentenced custody (107 per 100,000 population), and it had the second highest rate for remand and the third highest rate for probation (100 and 558 per 100,000 population, respectively). Average daily counts also highlight the issue of Indigenous overrepresentation in the Saskatchewan correctional system. For instance, on any given day in 2016/2017, there were 1,244 Indigenous adult males incarcerated in a provincial institution in Saskatchewan (Statistics Canada 2018b). This represented 2% of all Indigenous men in the province. In comparison, there were 403 non-Indigenous adult males incarcerated, or 0.1% of all non-Indigenous men in the province.
Start of text box 2
Text box 2
Marginalization among offenders in Saskatchewan
Using the Canadian Marginalization Index (Can-Marg)—which focuses on education, employment, income and housing—Boyce et al. (2018) analyzed marginalization among offenders in Saskatchewan.Note In the province, the proportion of offenders who were classified as being the most materially deprived was more than double the proportion of the general population (42% versus 17%). Further, according to Can-Marg, 53% of Indigenous offenders in Saskatchewan were classified as the most materially deprived compared to 23% of their non-Indigenous counterparts (Statistics Canada 2019g).
Offenders in Saskatchewan were more likely to be unmarried, considered low-income and reliant on government transfers (Boyce et al. 2018).Note The median after-tax income of offenders was significantly lower—approximately half—that of the general population in Saskatchewan. In the province, the Economic Dependency RatioNote was nearly double for offenders than the general population (29.35 versus 15.70). This, however, varied as it was 18.23 for one-time offenders,Note 39.30 for repeat offendersNote and 61.95 for chronic offenders.Note Thus, the issue of offending is not limited to the criminal justice system, but the social system as a whole.
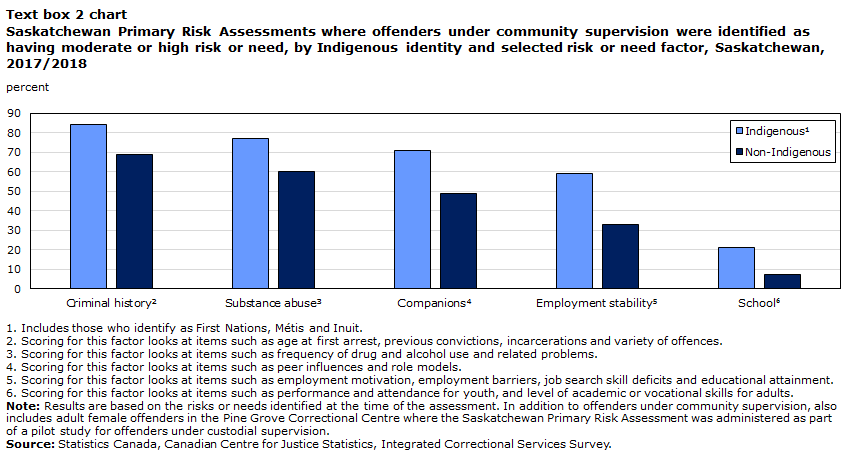
The Canadian Correctional Services Survey (CCSS) gathers information about the circumstances of those under correctional supervision in Saskatchewan. One component of the CCSS is a needs assessment, which aims to measure the risk of reoffending and the dynamic needs for rehabilitation. Using the Saskatchewan Primary Risk Assessment for offenders under community supervisionNote in 2017/2018, a significant proportion of this population were identified as having a moderate or high risk or need associated with various factors at the time of their assessment (Text box 2 chart).
Text box 2 chart start
Data table for Text box 2 chart
| Risk or need | IndigenousData table Note 1 | Non-Indigenous |
|---|---|---|
| percent | ||
| Criminal historyData table Note 2 | 84 | 69 |
| Substance abuseData table Note 3 | 77 | 60 |
| CompanionsData table Note 4 | 71 | 49 |
| Employment stabilityData table Note 5 | 59 | 33 |
| SchoolData table Note 6 | 21 | 7 |
Source: Statistics Canada, Canadian Centre for Justice Statistics, Integrated Correctional Services Survey. |
||
Text box 2 chart end
While Can-Marg highlights increased marginalization among offenders in Saskatchewan, results from the Saskatchewan Primary Risk Assessment indicate that Indigenous offenders face even higher levels of marginalization when compared to non-Indigenous offenders.
End of text box 2
Re-contact
Not everyone who comes into contact with the criminal justice system (i.e., the police) as a person accused of a crime has a pathway that takes them into the court and correctional systems. Some may come into contact with police only, while some may progress from police to courts to corrections. Further, repeated contacts—or re-contacts—with police have a significant impact on the criminal justice system’s capacity and resources. A better understanding of the pathways people follow in the criminal justice system provides some insight into the so-called “revolving door of justice.”
In 2016, Statistics Canada released a study on re-contact with the criminal justice system in Saskatchewan, which followed a cohort of 37,054 individuals who had come into contact at least once with police as someone accused of a crime in 2009/2010 (Brennan and Matarazzo 2016). The re-contact project—which integrated data from police, courts and corrections—determined if those who had police contact ended up in court and if they were subsequently placed under correctional supervision. Further, the study also looked at those who had additional contacts (i.e., re-contacts) with police for new crimes within the three-year reference period (2009/2010 to 2011/2012).
The study found that, among the Saskatchewan cohort, more than half (58%) had contact with only the police in relation to the original criminal incident, meaning their pathway through the criminal justice system did not lead them through to courts or corrections. Approximately one-quarter (24%) ended their pathway with courts, while the remaining one-fifth (19%) moved through the entire system, from police to courts to corrections.
It was significantly more common for Indigenous people than their non-Indigenous counterparts to have a re-contact with police following their correctional involvement (80% versus 57%). Among Indigenous youth specifically, 90% had a re-contact (compared to 79% of non-Indigenous youth) (Statistics Canada 2019g).
While the re-contact study answers important questions about pathways in the criminal justice system, it provides little detail about those who come into contact with police and the circumstances that may have led them there in the first place. Further analysis—not just of the criminal justice system but other interconnected factors—will contribute to addressing this data gap.
Microsimulation and the criminal justice system in Saskatchewan
Thus far, this article has described current conditions in Saskatchewan, its criminal justice system and those individuals who are caught within this system. The following analysis builds on this contextual information by estimating how demographic, behavioural, policy and program changes could affect outcomes.
Statistics Canada’s microsimulation model, Demosim, is a useful tool to conduct sensitivity analysis (“what if” scenarios). For instance, it allows for a measure of the impact of various assumptions (and scenarios) about the future evolution of demographic and non-demographic components on the future composition of the population. This model helps to inform how changes—in an integrated fashion—may impact outcomes. For this study, the microsimulation model was used to project the population that has a contact with the criminal justice system in Saskatchewan between 2011 and 2036. The seven scenarios selected for this study differ only by their assumption about the educational attainment of the Indigenous population (see Text box 3 for details about other assumptions).
For this study, the educational attainment gap refers to the gap in the probability for Indigenous people—compared with non-Indigenous people—to obtain a high school diploma, or a postsecondary certificate, diploma or degree. The following are the seven scenarios and their assumptions:
- Scenario 1 (no reduction in the educational attainment gap): the educational attainment gap between Indigenous and non-Indigenous people remains constant at the 2011 level;
- Scenario 2 (25% progressive reduction in the educational attainment gap): the educational attainment gap between Indigenous and non-Indigenous people is progressively reduced by 25% over a 25-year period between 2011 and 2036;
- Scenario 3 (50% progressive reduction in the educational attainment gap): the educational attainment gap between Indigenous and non-Indigenous people is progressively reduced by 50% over a 25-year period between 2011 and 2036;
- Scenario 4 (100% progressive reduction in the educational attainment gap, complete elimination): the educational attainment gap between Indigenous and non-Indigenous people is progressively reduced by 100% over a 25-year period between 2011 and 2036;
- Scenario 5 (25% instant reduction in the educational attainment gap): the educational attainment gap between Indigenous and non-Indigenous people is reduced by 25% from 2011 and remains the same over the projection period;
- Scenario 6 (50% instant reduction in the educational attainment gap): the educational attainment gap between Indigenous and non-Indigenous people is reduced by 50% from 2011 and remains the same over the projection period; and,
- Scenario 7 (100% instant reduction in the educational attainment gap, complete elimination): the educational attainment gap between Indigenous and non-Indigenous people is reduced by 100% in 2011 and remains the same over the projection period.
Parameters: “Contact with the criminal justice system” module
In order to have a projection of the population in Saskatchewan who come into contact with the criminal justice system in Demosim, some parameters had to be computed to create a “contact with the criminal justice system” module. This module is external to Demosim and allows for a derived projection of the number of annual contacts with the criminal justice system (the information is imputed once a year on a fixed date). The advantage of using Demosim is that it projects some characteristics of the population relevant for this study (including, most notably, Indigenous identity and highest level of education) that are not usually projected by other models.
The data used to derive the parameters for this module were obtained from a data linkage between the Saskatchewan re-contact cohort and the 2011 National Household Survey (see Methodology). These parameters were obtained by using logistic regression models. The choice of covariates for the regression models was based on what was indicated in the literature and, above all, on the variables available in Demosim. The variables selected for the regression models were age, sex, Indigenous identity, visible minority status, place of birth, place of residence, marital status and highest level of education.
Among Indigenous people aged 12 and older, the risk of coming into contact with the criminal justice system (i.e., the police) as persons accused of committing crime was approximately six times greater than it was for non-Indigenous people, when controlling for standard demographic variables such as age, sex and highest level of education. When other factors—such as income, housing and overcrowding—were included, however, that relative risk (odds ratio) of coming into contact with police dropped to four.
It is important to note that contact with the criminal justice system—regardless of Indigenous identity—is a complex and multidimensional issue. Normally, access to other types of background information—such as mental health status and substance use history—would inform the likelihood of coming into contact with police as persons accused of committing crime. The risk model described here was used primarily for classification purposes and served to determine the likelihood that individuals come into contact with police. The model showed a right classification rateNote of 89%. To that end, the parameters of the risk model can reliably be used for the microsimulation model and its projections; however, caution should be used when making associations between these factors and the likelihood of coming into contact with police.
Start of text box 3
Text box 3
Projection assumptions, scenarios and data limitations
All scenarios presented in this article share the same demographic and non-demographic assumptions as those developed for the reference scenario in the publication, Projections of the Aboriginal Population and Households in Canada, 2011 to 2036 (Morency et al. 2015). The reference scenario supposes a medium growthNote of the population, a progressive and complete gap reduction of the fertility levels of Indigenous and non-Indigenous people, and a continuation of the recent trends for intragenerational ethnic mobility (people who change their self-reported Indigenous identity over time). The seven scenarios discussed in this article only differ by their assumption related to the educational attainment of the Indigenous population.
The relevance, quality and plausibility of the projection assumptions determine the value of the projection results. Designing projection assumptions is complex, so a committee of experts was consulted to enhance Statistics Canada’s ability to model such phenomena. The scenarios presented in this article demonstrate the potential impact of various realistic and theoretical scenarios on the growth rate of contact with the criminal justice system in Saskatchewan.
Scenarios that assume a progressive reduction over a 25-year period of the gap in educational attainment between Indigenous and non-Indigenous people (Scenario 2, Scenario 3 and Scenario 4) were projected to highlight the potential impact of interventions—that aim to progressively reduce the gap in educational attainment between Indigenous and non-Indigenous people—over time on the number of contacts with police (compared to Scenario 1). As for the scenarios that assume an instant reduction in the educational attainment gap (Scenario 5, Scenario 6 and Scenario 7), they were projected to show how the number of contacts with police would have been reduced (compared to Scenario 1) if, by 2011, some of the gap had been reduced (by 25%, 50% or 100%).
It is important to note that some variables that could impact the probability of coming into contact with the criminal justice system could not be accounted for in the parameters. The most important one is recidivism. Of those in the base population used for the projections, it is impossible to know who previously had a contact with the criminal justice system. Further, without this information, the model was unable to account for the unique demographic behaviours of those who had a previous contact with the criminal justice system (for example, they might have a shorter life expectancy or a lower chance of advancing their education).
End of text box 3
Start of text box 4
Text box 4
Reducing the educational attainment gap: A complex issue
It is not possible to propose well-informed and perfectly plausible assumptions to deal with a gap reduction in the educational attainment of Indigenous and non-Indigenous people. The impact of two factors is therefore examined: the degree to which the gap is reduced and the time required to achieve it. This provides useful information for consideration when developing policies and programs.
Research has explored how the education level of children correlates to that of their parents (Kaushal 2014; Latif 2018; Sen and Clemente 2010; Turcotte 2011). Ideally, the education level of parents would be considered when projecting the education of a simulated individual, but that is not currently possible in Demosim. It is, however, possible to imagine scenarios that propose a progressive increase in educational attainment over time that would reflect the fact that changes in educational attainment from one generation to another are gradual and slow (and not instant and quick). While an instant reduction in the educational attainment gap is improbable, results from such projections are included in this article to highlight the potential impact of education-related intervention had progress already been made as of the beginning of the projection period. The actions for overcoming barriers to higher education levels are associated with a multitude of cultural and structural factors that are more or less well understood and more or less easy to change. In addition, barriers to a university education may be more difficult to overcome than barriers to secondary education. The issue is complex.
Policies that propose investment in education may be considered as failures if the short-term expectations are unrealistic, though they might have positive long-term effects. For example, consider that “[w]hile the impact of educational improvements on the future labour force is significant, the change is found to be a slow and gradual process, as successive young school-age cohorts have yet to enter the labour market and renew the workforce” (Spielauer 2014). The strength and realism of demographic projections may reveal how various mechanisms operate over time.
End of text box 4
Projection results
It is projected that the population in Saskatchewan would grow by 16%Note between 2011 and 2036.Note The projected growth varies greatly by Indigenous identity: while the non-Indigenous population in the province is projected to grow by 10%, the Indigenous population is projected to grow by 46%.
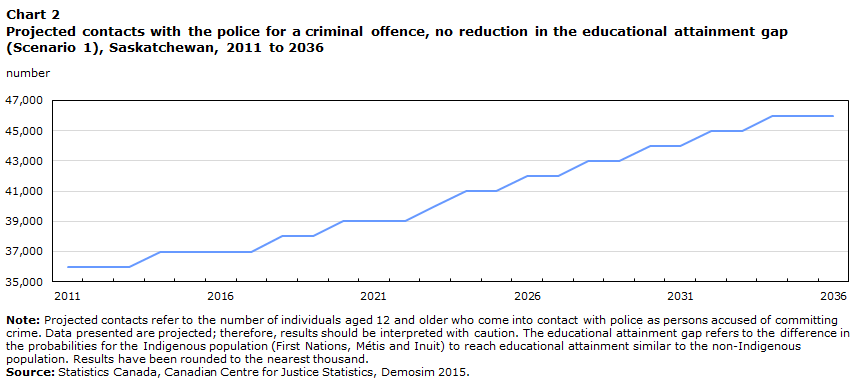
It should be noted that the projections derived by the microsimulation model are dependent on the criminal justice system’s general response to delinquency; here, an assumption is made that this response remains the same over time (per 2011 conditions). Likewise, the impact of the variables on the likelihood of coming into contact with police is assumed to remain the same over the course of the projection. With these factors in mind, it is projected that the overall number of people aged 12 and older who come into contact with police as persons accused of committing crime in Saskatchewan would increase from 36,000 in 2011 to 46,000 in 2036, an increase of 27% (Chart 2).
Chart 2 start
Data table for Chart 2
| Year | Projected contacts |
|---|---|
| number | |
| 2011 | 36,000 |
| 2012 | 36,000 |
| 2013 | 36,000 |
| 2014 | 37,000 |
| 2015 | 37,000 |
| 2016 | 37,000 |
| 2017 | 37,000 |
| 2018 | 38,000 |
| 2019 | 38,000 |
| 2020 | 39,000 |
| 2021 | 39,000 |
| 2022 | 39,000 |
| 2023 | 40,000 |
| 2024 | 41,000 |
| 2025 | 41,000 |
| 2026 | 42,000 |
| 2027 | 42,000 |
| 2028 | 43,000 |
| 2029 | 43,000 |
| 2030 | 44,000 |
| 2031 | 44,000 |
| 2032 | 45,000 |
| 2033 | 45,000 |
| 2034 | 46,000 |
| 2035 | 46,000 |
| 2036 | 46,000 |
|
Note: Projected contacts refer to the number of individuals aged 12 and older who come into contact with police as persons accused of committing crime. Data presented are projected; therefore, results should be interpreted with caution. The educational attainment gap refers to the difference in the probabilities for the Indigenous population (First Nations, Métis and Inuit) to reach educational attainment similar to the non-Indigenous population. Results have been rounded to the nearest thousand. Source: Statistics Canada, Canadian Centre for Justice Statistics, Demosim 2015. |
|
Chart 2 end
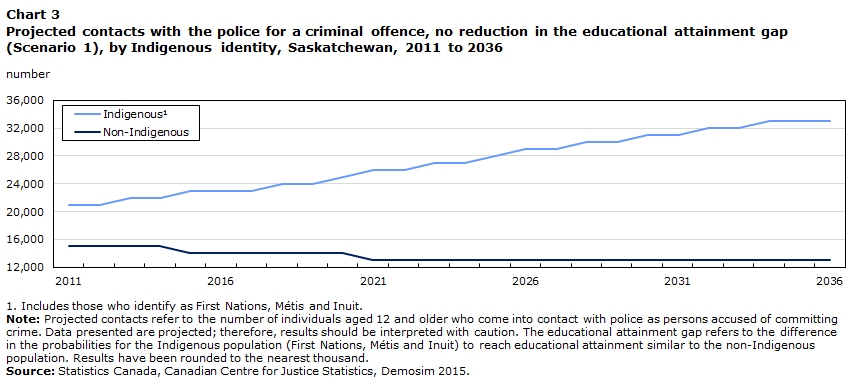
This projected growth would come from an increase in the number of Indigenous people who come into contact with police in Saskatchewan. As the Indigenous population is projected to grow by 46%, the number of people who come into contact with police would increase from 21,000 in 2011 to 33,000 in 2036, representing an increase of 58% (Chart 3). In comparison, the number of non-Indigenous people who come into contact with police would decrease by 14% (from 15,000 in 2011 to 13,000 in 2036) as the non-Indigenous population is projected to grow by 10%.
Chart 3 start
Data table for Chart 3
| Year | IndigenousData table Note 1 | Non-Indigenous |
|---|---|---|
| number | ||
| 2011 | 21,000 | 15,000 |
| 2012 | 21,000 | 15,000 |
| 2013 | 22,000 | 15,000 |
| 2014 | 22,000 | 15,000 |
| 2015 | 23,000 | 14,000 |
| 2016 | 23,000 | 14,000 |
| 2017 | 23,000 | 14,000 |
| 2018 | 24,000 | 14,000 |
| 2019 | 24,000 | 14,000 |
| 2020 | 25,000 | 14,000 |
| 2021 | 26,000 | 13,000 |
| 2022 | 26,000 | 13,000 |
| 2023 | 27,000 | 13,000 |
| 2024 | 27,000 | 13,000 |
| 2025 | 28,000 | 13,000 |
| 2026 | 29,000 | 13,000 |
| 2027 | 29,000 | 13,000 |
| 2028 | 30,000 | 13,000 |
| 2029 | 30,000 | 13,000 |
| 2030 | 31,000 | 13,000 |
| 2031 | 31,000 | 13,000 |
| 2032 | 32,000 | 13,000 |
| 2033 | 32,000 | 13,000 |
| 2034 | 33,000 | 13,000 |
| 2035 | 33,000 | 13,000 |
| 2036 | 33,000 | 13,000 |
Source: Statistics Canada, Canadian Centre for Justice Statistics, Demosim 2015. |
||
Chart 3 end
The large discrepancy between projected numbers of Indigenous and non-Indigenous people who come into contact with police is likely attributable to many factors. One of the most important is the projected increase of young Indigenous people in the population (Morency et al. 2015). Involvement in crime is highly related to age (Allen 2016; Allen and Superle 2016), which is a compounding factor for projected conditions for Indigenous people. In contrast, aging among the non-Indigenous population acts as a contributing factor in their projected decrease for involvement in crime.
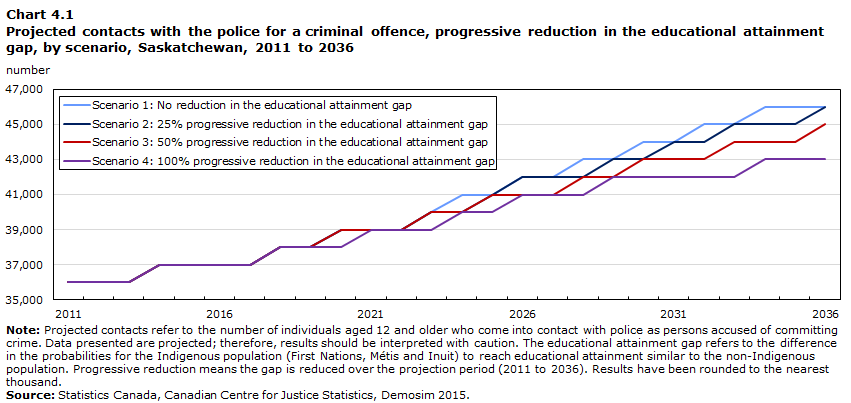
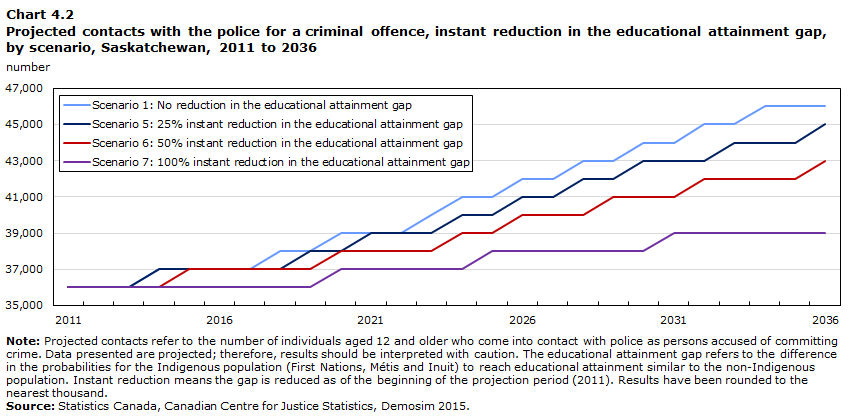
Demosim scenarios highlight how enhancing educational attainment among Indigenous people in Saskatchewan could lead to more positive outcomes through reducing the number of contacts with police. Projections for the number of contacts with police—based on the seven scenarios detailed previously—are shown below (Chart 4.1; Chart 4.2).
Chart 4.1 start
Data table for Chart 4.1
| Year | Scenario 1: No reduction in the educational attainment gap | Scenario 2: 25% progressive reduction in the educational attainment gap | Scenario 3: 50% progressive reduction in the educational attainment gap | Scenario 4: 100% progressive reduction in the educational attainment gap |
|---|---|---|---|---|
| number | ||||
| 2011 | 36,000 | 36,000 | 36,000 | 36,000 |
| 2012 | 36,000 | 36,000 | 36,000 | 36,000 |
| 2013 | 36,000 | 36,000 | 36,000 | 36,000 |
| 2014 | 37,000 | 37,000 | 37,000 | 37,000 |
| 2015 | 37,000 | 37,000 | 37,000 | 37,000 |
| 2016 | 37,000 | 37,000 | 37,000 | 37,000 |
| 2017 | 37,000 | 37,000 | 37,000 | 37,000 |
| 2018 | 38,000 | 38,000 | 38,000 | 38,000 |
| 2019 | 38,000 | 38,000 | 38,000 | 38,000 |
| 2020 | 39,000 | 39,000 | 39,000 | 38,000 |
| 2021 | 39,000 | 39,000 | 39,000 | 39,000 |
| 2022 | 39,000 | 39,000 | 39,000 | 39,000 |
| 2023 | 40,000 | 40,000 | 40,000 | 39,000 |
| 2024 | 41,000 | 40,000 | 40,000 | 40,000 |
| 2025 | 41,000 | 41,000 | 41,000 | 40,000 |
| 2026 | 42,000 | 42,000 | 41,000 | 41,000 |
| 2027 | 42,000 | 42,000 | 41,000 | 41,000 |
| 2028 | 43,000 | 42,000 | 42,000 | 41,000 |
| 2029 | 43,000 | 43,000 | 42,000 | 42,000 |
| 2030 | 44,000 | 43,000 | 43,000 | 42,000 |
| 2031 | 44,000 | 44,000 | 43,000 | 42,000 |
| 2032 | 45,000 | 44,000 | 43,000 | 42,000 |
| 2033 | 45,000 | 45,000 | 44,000 | 42,000 |
| 2034 | 46,000 | 45,000 | 44,000 | 43,000 |
| 2035 | 46,000 | 45,000 | 44,000 | 43,000 |
| 2036 | 46,000 | 46,000 | 45,000 | 43,000 |
|
Note: Projected contacts refer to the number of individuals aged 12 and older who come into contact with police as persons accused of committing crime. Data presented are projected; therefore, results should be interpreted with caution. The educational attainment gap refers to the difference in the probabilities for the Indigenous population (First Nations, Métis and Inuit) to reach educational attainment similar to the non-Indigenous population. Progressive reduction means the gap is reduced over the projection period (2011 to 2036). Results have been rounded to the nearest thousand. Source: Statistics Canada, Canadian Centre for Justice Statistics, Demosim 2015. |
||||
Chart 4.1 end
Chart 4.2 start
Data table for Chart 4.2
| Year | Scenario 1: No reduction in the educational attainment gap | Scenario 5: 25% instant reduction in the educational attainment gap | Scenario 6: 50% instant reduction in the educational attainment gap | Scenario 7: 100% instant reduction in the educational attainment gap |
|---|---|---|---|---|
| number | ||||
| 2011 | 36,000 | 36,000 | 36,000 | 36,000 |
| 2012 | 36,000 | 36,000 | 36,000 | 36,000 |
| 2013 | 36,000 | 36,000 | 36,000 | 36,000 |
| 2014 | 37,000 | 37,000 | 36,000 | 36,000 |
| 2015 | 37,000 | 37,000 | 37,000 | 36,000 |
| 2016 | 37,000 | 37,000 | 37,000 | 36,000 |
| 2017 | 37,000 | 37,000 | 37,000 | 36,000 |
| 2018 | 38,000 | 37,000 | 37,000 | 36,000 |
| 2019 | 38,000 | 38,000 | 37,000 | 36,000 |
| 2020 | 39,000 | 38,000 | 38,000 | 37,000 |
| 2021 | 39,000 | 39,000 | 38,000 | 37,000 |
| 2022 | 39,000 | 39,000 | 38,000 | 37,000 |
| 2023 | 40,000 | 39,000 | 38,000 | 37,000 |
| 2024 | 41,000 | 40,000 | 39,000 | 37,000 |
| 2025 | 41,000 | 40,000 | 39,000 | 38,000 |
| 2026 | 42,000 | 41,000 | 40,000 | 38,000 |
| 2027 | 42,000 | 41,000 | 40,000 | 38,000 |
| 2028 | 43,000 | 42,000 | 40,000 | 38,000 |
| 2029 | 43,000 | 42,000 | 41,000 | 38,000 |
| 2030 | 44,000 | 43,000 | 41,000 | 38,000 |
| 2031 | 44,000 | 43,000 | 41,000 | 39,000 |
| 2032 | 45,000 | 43,000 | 42,000 | 39,000 |
| 2033 | 45,000 | 44,000 | 42,000 | 39,000 |
| 2034 | 46,000 | 44,000 | 42,000 | 39,000 |
| 2035 | 46,000 | 44,000 | 42,000 | 39,000 |
| 2036 | 46,000 | 45,000 | 43,000 | 39,000 |
|
Note: Projected contacts refer to the number of individuals aged 12 and older who come into contact with police as persons accused of committing crime. Data presented are projected; therefore, results should be interpreted with caution. The educational attainment gap refers to the difference in the probabilities for the Indigenous population (First Nations, Métis and Inuit) to reach educational attainment similar to the non-Indigenous population. Instant reduction means the gap is reduced as of the beginning of the projection period (2011). Results have been rounded to the nearest thousand. Source: Statistics Canada, Canadian Centre for Justice Statistics, Demosim 2015. |
||||
Chart 4.2 end
Reducing the educational attainment gap between Indigenous and non-Indigenous people in Saskatchewan could have an impact on the criminal justice system in the years to come. It is projected that, if the educational gap was progressively reduced by 25% (Scenario 2), 46,000 people—including both Indigenous and non-Indigenous people—would come into contact with police in 2036 (+25% from 2011) while a 50% progressive reduction in the educational gap (Scenario 3) would mean 45,000 people come into contact with police (+22% from 2011).
Finally, if the educational attainment gap was progressively reduced by 100% by 2036 (Scenario 4)—that is, the educational attainment of Indigenous and non-Indigenous people is equal at all levels—it is projected that there would be 43,000 people who come into contact with police in 2036 (+17% from 2011). During that same period, the overall population in Saskatchewan is projected to grow by 16%. If the educational attainment gap had been reduced as of the beginning of the projection period in 2011 (instant reduction), it is projected that the number of people who come into contact with police would increase by either 23% (Scenario 5), 17% (Scenario 6) or 7% (Scenario 7) by 2036.
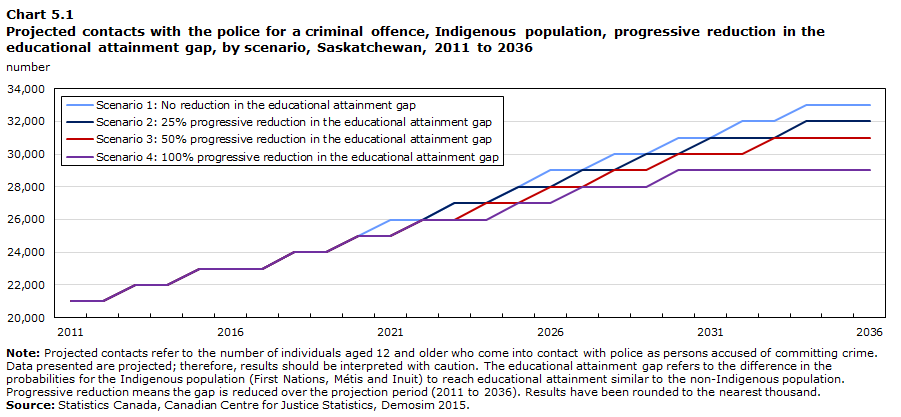
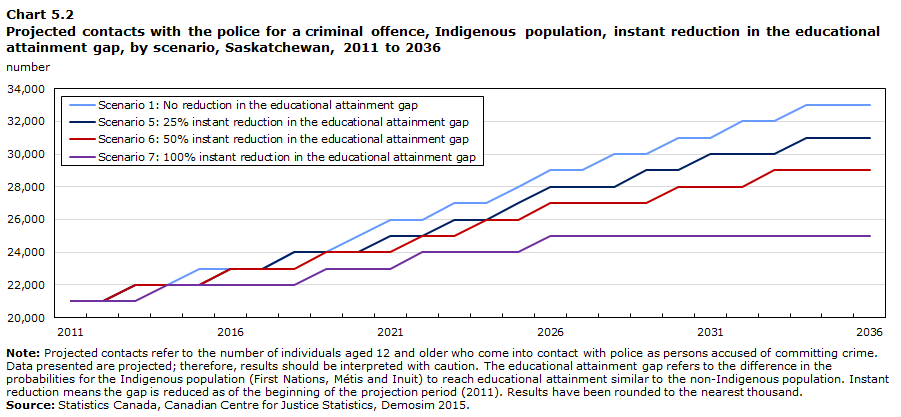
Among Indigenous people specifically, enhancing educational attainment could have a pronounced impact on the number of contacts with police. As mentioned, with no reduction in the educational attainment gap (Scenario 1), it is projected that the number of Indigenous people who come into contact with police would increase by 58% between 2011 and 2036 (Chart 5.1; Chart 5.2). In contrast, with a progressive reduction of the educational attainment gap, it is projected that the number of contacts with police would increase by either 53% (Scenario 2), 49% (Scenario 3) or 40% (Scenario 4) during that same time period. Meanwhile, if the educational attainment gap had been reduced as of the beginning of the projection period in 2011 (instant reduction), the number of contacts with police would increase by either 49% (Scenario 5), 39% (Scenario 6) or 21% (Scenario 7) by 2036.
Chart 5.1 start
Data table for Chart 5.1
| Year | Scenario 1: No reduction in the educational attainment gap | Scenario 2: 25% progressive reduction in the educational attainment gap | Scenario 3: 50% progressive reduction in the educational attainment gap | Scenario 4: 100% progressive reduction in the educational attainment gap |
|---|---|---|---|---|
| number | ||||
| 2011 | 21,000 | 21,000 | 21,000 | 21,000 |
| 2012 | 21,000 | 21,000 | 21,000 | 21,000 |
| 2013 | 22,000 | 22,000 | 22,000 | 22,000 |
| 2014 | 22,000 | 22,000 | 22,000 | 22,000 |
| 2015 | 23,000 | 23,000 | 23,000 | 23,000 |
| 2016 | 23,000 | 23,000 | 23,000 | 23,000 |
| 2017 | 23,000 | 23,000 | 23,000 | 23,000 |
| 2018 | 24,000 | 24,000 | 24,000 | 24,000 |
| 2019 | 24,000 | 24,000 | 24,000 | 24,000 |
| 2020 | 25,000 | 25,000 | 25,000 | 25,000 |
| 2021 | 26,000 | 25,000 | 25,000 | 25,000 |
| 2022 | 26,000 | 26,000 | 26,000 | 26,000 |
| 2023 | 27,000 | 27,000 | 26,000 | 26,000 |
| 2024 | 27,000 | 27,000 | 27,000 | 26,000 |
| 2025 | 28,000 | 28,000 | 27,000 | 27,000 |
| 2026 | 29,000 | 28,000 | 28,000 | 27,000 |
| 2027 | 29,000 | 29,000 | 28,000 | 28,000 |
| 2028 | 30,000 | 29,000 | 29,000 | 28,000 |
| 2029 | 30,000 | 30,000 | 29,000 | 28,000 |
| 2030 | 31,000 | 30,000 | 30,000 | 29,000 |
| 2031 | 31,000 | 31,000 | 30,000 | 29,000 |
| 2032 | 32,000 | 31,000 | 30,000 | 29,000 |
| 2033 | 32,000 | 31,000 | 31,000 | 29,000 |
| 2034 | 33,000 | 32,000 | 31,000 | 29,000 |
| 2035 | 33,000 | 32,000 | 31,000 | 29,000 |
| 2036 | 33,000 | 32,000 | 31,000 | 29,000 |
|
Note: Projected contacts refer to the number of individuals aged 12 and older who come into contact with police as persons accused of committing crime. Data presented are projected; therefore, results should be interpreted with caution. The educational attainment gap refers to the difference in the probabilities for the Indigenous population (First Nations, Métis and Inuit) to reach educational attainment similar to the non-Indigenous population. Progressive reduction means the gap is reduced over the projection period (2011 to 2036). Results have been rounded to the nearest thousand. Source: Statistics Canada, Canadian Centre for Justice Statistics, Demosim 2015. |
||||
Chart 5.1 end
Chart 5.2 start
Data table for Chart 5.2
| Year | Scenario 1: No reduction in the educational attainment gap | Scenario 5: 25% instant reduction in the educational attainment gap | Scenario 6: 50% instant reduction in the educational attainment gap | Scenario 7: 100% instant reduction in the educational attainment gap |
|---|---|---|---|---|
| number | ||||
| 2011 | 21,000 | 21,000 | 21,000 | 21,000 |
| 2012 | 21,000 | 21,000 | 21,000 | 21,000 |
| 2013 | 22,000 | 22,000 | 22,000 | 21,000 |
| 2014 | 22,000 | 22,000 | 22,000 | 22,000 |
| 2015 | 23,000 | 22,000 | 22,000 | 22,000 |
| 2016 | 23,000 | 23,000 | 23,000 | 22,000 |
| 2017 | 23,000 | 23,000 | 23,000 | 22,000 |
| 2018 | 24,000 | 24,000 | 23,000 | 22,000 |
| 2019 | 24,000 | 24,000 | 24,000 | 23,000 |
| 2020 | 25,000 | 24,000 | 24,000 | 23,000 |
| 2021 | 26,000 | 25,000 | 24,000 | 23,000 |
| 2022 | 26,000 | 25,000 | 25,000 | 24,000 |
| 2023 | 27,000 | 26,000 | 25,000 | 24,000 |
| 2024 | 27,000 | 26,000 | 26,000 | 24,000 |
| 2025 | 28,000 | 27,000 | 26,000 | 24,000 |
| 2026 | 29,000 | 28,000 | 27,000 | 25,000 |
| 2027 | 29,000 | 28,000 | 27,000 | 25,000 |
| 2028 | 30,000 | 28,000 | 27,000 | 25,000 |
| 2029 | 30,000 | 29,000 | 27,000 | 25,000 |
| 2030 | 31,000 | 29,000 | 28,000 | 25,000 |
| 2031 | 31,000 | 30,000 | 28,000 | 25,000 |
| 2032 | 32,000 | 30,000 | 28,000 | 25,000 |
| 2033 | 32,000 | 30,000 | 29,000 | 25,000 |
| 2034 | 33,000 | 31,000 | 29,000 | 25,000 |
| 2035 | 33,000 | 31,000 | 29,000 | 25,000 |
| 2036 | 33,000 | 31,000 | 29,000 | 25,000 |
|
Note: Projected contacts refer to the number of individuals aged 12 and older who come into contact with police as persons accused of committing crime. Data presented are projected; therefore, results should be interpreted with caution. The educational attainment gap refers to the difference in the probabilities for the Indigenous population (First Nations, Métis and Inuit) to reach educational attainment similar to the non-Indigenous population. Instant reduction means the gap is reduced as of the beginning of the projection period (2011). Results have been rounded to the nearest thousand. Source: Statistics Canada, Canadian Centre for Justice Statistics, Demosim 2015. |
||||
Chart 5.2 end
Regina and Saskatoon, Saskatchewan’s two CMAs, had similar results as the provincial-level projections. With no reduction to the educational attainment gap, it is projected that the number of contacts with police would increase by 20% and 17%, respectively, between 2011 and 2036.Note With the gap progressively reduced by 100%, there would be a 14% and 12% increase, respectively, in the number of contacts with police over the same time period.
Outside of the province’s CMAs, a 100% progressive reduction of the educational attainment gap would have a larger impact on-reserve: with no reduction to the educational attainment gap between 2011 and 2036, the number of contacts on-reserve would increase by 68%. Meanwhile, with the gap progressively reduced by 100%, contacts with police on-reserve would increase by 47%. In comparison, the number of contacts with police off-reserve (outside of CMAs) is projected to decrease by 2% even with no reduction to the educational attainment gap; however, the decrease would be larger (-7%) if the gap was progressively reduced by 100% over the projection period.
Summary
Statistics Canada’s research on criminal behaviour in Canada has, to date, focused on providing descriptive indicators to highlight trends and patterns of offending. In contrast, this pilot study used Statistics Canada’s Demosim microsimulation model to produce alternative scenarios for the period between 2011 and 2036 that focus on reducing the educational attainment gap between Indigenous and non-Indigenous people in Saskatchewan. This was done to quantify the potential impact that a reduction in the educational attainment gap could have on the number of contacts with police for those accused of committing crime—and thus involvement in the criminal justice system—in the years to come.
Results noted that if the current educational attainment gap between Indigenous and non-Indigenous people in Saskatchewan, and the probability of coming into contact with police, remain the same (per 2011 conditions), the number of contacts with police in the province would increase by 27%. This projected growth would come from a 58% increase in the number of Indigenous people who come into contact with police. Meanwhile, for the non-Indigenous population, there would be a 14% decrease in the number of contacts.
On the other hand, if improvements can be made for the educational attainment of Indigenous people in Saskatchewan, different scenarios could materialize. For instance, a 25% progressive reduction in the gap between 2011 and 2036 was projected to result in a 25% increase in the number of people who come into contact with police, while a 50% progressive reduction was projected to result in a 22% increase and a 100% progressive reduction was projected to result in a 17% increase. Thus, reducing the educational attainment gap between Indigenous and non-Indigenous people could have a notable impact on the number of people who come into contact with the criminal justice system in Saskatchewan.
By integrating data from the criminal justice system with other types of social data, interactions with the criminal justice system can be contextualized in terms of other critical areas such as education, labour and health. The type of analysis in this study could help stakeholders from various domains to target limited resources in order to work toward developing integrated and multi-disciplinary solutions that improve outcomes for marginalized populations that are at-risk for involvement in the criminal justice system.
Detailed data tables
Table 1 Social and economic factors, by Indigenous identity, Saskatchewan and Canada, 2016
Methodology
This study used data from the Saskatchewan re-contact cohort, which includes individuals who had a contact with the Saskatchewan justice system (i.e., contact with police as persons accused of committing crime) in 2009/2010. Administrative data related to the cohort provided limited information on the characteristics of these individuals, so additional data were obtained through linkage to the 2011 National Household Survey (NHS).
The NHS is a sample survey, meaning results from the NHS must be generalized to represent the composition of the 2009/2010 Saskatchewan population, for both those who came into contact with the criminal justice system versus those who did not. The NHS microdata file includes survey weights—generated by census methodologists—to account for generalizing results to the overall (i.e., total) Saskatchewan population. Some individuals in the Saskatchewan re-contact cohort were linked to the NHS, while others were not. To account for this, the weights were adjusted for those who were linked to that they represented the total Saskatchewan re-contact cohort. The Canadian Centre for Justice Statistics generated the adjusted weights and they were verified by methodologists.
Microsimulation projections were used to study the impact of educational attainment on contact with the criminal justice system in Saskatchewan. Microsimulation estimates how demographic, behavioural, policy and program changes could affect outcomes through the simulation of “what if” scenarios.
Demosim—a microsimulation model developed by Statistics Canada—was used to conduct the microsimulation for this study. Demosim projects individuals in the population one at a time, rather than projecting the population on the basis of aggregate data. Demosim simulates the life of each person in its base population, as well as newborns and immigrants who are added to the population during the simulation. The individuals advance through time and are subject to the likelihood of “experiencing” various events during the simulated process (for example, birth of a child, death, change in education level, change in knowledge of official language). The likelihood of experiencing such events accounts for the characteristics of each individual in the simulation. For example, the likelihood of a simulated woman to give birth to a child will vary according to her age, Indigenous identity and immigrant status, highest level of education and place of residence. For more information on Demosim, see Caron-Malenfant and Coulombe 2015.
Demosim does not include a module related to the criminal justice system. Therefore, a probabilistic model using logistic regression was developed. The model was implemented in Demosim to project, through microsimulation, the number of people who come into contact with the criminal justice system in a given year, knowing their age, sex, Indigenous identity, visible minority status, place of birth, place of residence, marital status and highest level of education.
First, a base scenario (Scenario 1) was developed for the purpose of comparison with the “what if” scenarios. The base scenario was run in Demosim and projected the population in Saskatchewan who would come into contact with the criminal justice system over a 25-year period (from 2011 to 2036) per 2011 conditions. Next, the “what if” scenarios (Scenario 2, Scenario 3, Scenario 4, Scenario 5, Scenario 6 and Scenario 7) were run in Demosim. All scenarios were crossed with some demographic assumptions such as Indigenous fertility rates, ethnic mobility and migration.
The projections presented in this article are not predictions. To avoid giving a false impression of accuracy, the results for projected numbers are rounded to the nearest thousand; however, projected percent changes are calculated using unrounded numbers.
References
Allen, M. 2016. “Young adult offenders in Canada, 2014.” Juristat. Statistics Canada Catalogue no. 85-002-X.
Allen, M. and S. Perreault. 2015. “Police-reported crime in Canada’s provincial north and territories, 2013.” Juristat. Statistics Canada Catalogue no. 85-002-X.
Allen, M. and T. Superle. 2016. “Youth crime in Canada, 2014.” Juristat. Statistics Canada Catalogue no. 85-002-X.
Beattie, S., David, J.-D. and J. Roy. 2018. “Homicide in Canada, 2017.” Juristat. Statistics Canada Catalogue no. 85-002-X.
Boyce, J. 2016. “Victimization of Aboriginal people in Canada, 2014.” Juristat. Statistics Canada Catalogue no. 85-002-X.
Boyce, J., Te, S. and S. Brennan. 2018. “Economic profiles of offenders in Saskatchewan.” Juristat. Statistics Canada Catalogue no. 85-002-X.
Brennan, S. and A. Matarazzo. 2016. “Re-contact with the Saskatchewan justice system.” Juristat. Statistics Canada Catalogue no. 85-002-X.
Caron-Malenfant, É. and S. Coulombe. 2015. Demosim: An Overview of Methods and Data Sources. Statistics Canada Catalogue no. 91-621-X.
Cesaroni, C., Grol, C. and K. Fredericks. 2019. “Overrepresentation of Indigenous youth in Canada’s criminal justice system: Perspectives of Indigenous young people.” Australian & New Zealand Journal of Criminology. Vol. 52, no. 1. p. 111-128.
Cooke, M. and J. McWhirter. 2011. “Public policy and Aboriginal peoples in Canada: Taking a life-course perspective.” Canadian Public Policy. Vol. 37, suppl. 15-31.
Cornell, S. and M. Jorgensen. 2019. “What are the limits of social inclusion? Indigenous peoples and Indigenous governance in Canada and the United States.” American Review of Canadian Studies. Vol. 49, no. 2. p. 283-300.
Corrado, R. R., Kuehn, S. and I. Margaritescu. 2014. “Policy issues regarding the over-representation of incarcerated Aboriginal young offenders in a Canadian context.” Youth Justice. Vol. 14, no. 1. p. 40-62.
Council of Ministers of Education, Canada. 2012. Key Policy Issues in Aboriginal Education: An Evidence-based Approach.
Dennison, C. R. and R. R. Swisher. 2019. “Postsecondary education, neighborhood disadvantage, and crime: An examination of life course relative deprivation.” Crime & Delinquency. Vol. 65, no. 2. p. 215-238.
Fogarty, W., Lovell, M., Langenberg, J. and M.-J. Heron. 2018. Deficit Discourse and Strengths-based Approaches: Changing the Narrative of Aboriginal and Torres Strait Islander Health and Wellbeing.
Gallop, C. J. and N. Bastien. 2016. “Supporting success: Aboriginal students in higher education.” Canadian Journal of Higher Education. Vol. 46, no. 2. p. 206-224.
Groot, W. and H. M. van den Brink. 2010. “The effects of education on crime.” Applied Economics. Vol. 42, no. 3. p. 279-289.
Hjalmarsson, R., Holmlund, H. and M. J. Lindquist. 2014. “The effect of education on criminal convictions and incarceration: Causal evidence from micro-data.” The Economic Journal. Vol. 125, no. 587. p. 1290-1326.
Kaushal, N. 2014. “Intergenerational payoffs of education.” The Future of Children. Vol. 24, no. 1. p. 61-78.
Kelly-Scott, K. 2016. Aboriginal Peoples: Fact Sheet for Saskatchewan. Statistics Canada Catalogue no. 89-656-X.
Kelly-Scott, K. and K. Smith. 2015. Aboriginal Peoples: Fact Sheet for Canada. Statistics Canada Catalogue no. 89-656-X.
Kendall, J. 2001. “Circles of disadvantage: Aboriginal poverty and underdevelopment in Canada.” American Review of Canadian Studies. Vol. 31, no. 1-2. p. 43-59.
Kirmayer, L. J., Gone, J. P. and J. Moses. 2014. “Rethinking historical trauma.” Transcultural Psychiatry. Vol. 51, no. 2. p. 299-319.
Korpal, D. and A. Wong. 2015. “Education and the health of First Nations people of Canada.” AlterNative. Vol. 11, no. 2. p. 132-146.
Latif, E. 2018. “Trends in intergenerational educational mobility in Canada.” The Australian Economic Review. Vol. 52, no. 1. p. 61-75.
Malakieh, J. 2019. “Adult and youth correctional statistics in Canada, 2017/2018.” Juristat. Statistics Canada Catalogue no. 85-002-X.
Matheson, F. I., Dunn, J. R., Smith, K. L. W., Moineddin, R. and R. H. Glazier. 2012. “Development of the Canadian Marginalization Index: A new tool for the study of inequality.” Canadian Journal of Public Health. Vol. 103, suppl. 12-16.
Miller, T. 2018. “Measures of Indigenous achievement in Canada.” Diaspora, Indigenous, and Minority Education. Vol. 12, no. 4. p. 182-200.
Moreau, G. 2019. “Police-reported crime statistics, 2018.” Juristat. Statistics Canada Catalogue no. 85-002-X.
Morency, J.-D., Caron-Malenfant, É., Coulombe, S. and S. Langlois. 2015. Projections of the Aboriginal Population and Households in Canada, 2011 to 2036. Statistics Canada Catalogue no. 91-552-X.
Munroe, E. A., Lunney Borden, L., Murray Orr, A., Toney, D. and J. Meader. 2013. “Decolonizing Aboriginal education in the 21st century.” McGill Journal of Education. Vol. 48, no. 2. p. 317-337.
Nguyen, M. 2011. “Closing the education gap: A case for Aboriginal early childhood education in Canada, a look at the Aboriginal Head Start Program.” Canadian Journal of Education. Vol. 34, no. 3. p. 229-248.
Nielsen, M. O. and L. Robyn. 2003. “Colonialism and criminal justice for Indigenous peoples in Australia, Canada, New Zealand and the United States of America.” Indigenous Nations Journal. Vol. 4, no. 1. p. 29-45.
Nutton, J. and E. Fast. 2015. “Historical trauma, substance use, and Indigenous peoples: Seven generations of harm from a ‘big event.’” Substance Use & Misuse. Vol. 50, no. 7. p. 839-847.
Perreault, S. 2019. “Police-reported crime in rural and urban areas in the Canadian provinces, 2017.” Juristat. Statistics Canada Catalogue no. 85-002-X.
Perreault, S. 2015. “Criminal victimization in Canada, 2014.” Juristat. Statistics Canada Catalogue no. 85-002-X.
Perreault, S. 2009. “The incarceration of Aboriginal people in adult correctional services.” Juristat. Statistics Canada Catalogue no. 85-002-X.
Preston, J. P. 2016. “Education for Aboriginal peoples in Canada: An overview of four realms of success.” Diaspora, Indigenous, and Minority Education. Vol. 10, no. 1. p. 14-27.
R. v. Gladue. 1999. 1 S.C.R. 688.
Rubin, J., Rabinovich, L., Hallsworth, M. and E. Nason. 2006. Interventions to Reduce Anti-social Behaviour and Crime: A Review of Effectiveness and Costs.
Rudin, J. 2005. Aboriginal Peoples and the Criminal Justice System.
Sen, A. and A. Clemente. 2010. “Intergenerational correlations in educational attainment: Birth order and family size effects using Canadian data.” Economics of Education Review. Vol. 29, no. 1. p. 147-155.
Sinclair, R. 2007. “Identity lost and found: Lessons from the Sixties Scoop.” First Peoples Child & Family Review. Vol. 3, no. 1. p. 65-82.
Spielauer, M. 2014. “The relation between education and labour force participation of Aboriginal peoples: A simulation analysis using the Demosim population projection model.” Canadian Studies in Population. Vol. 41, no. 1-2. p. 144-164.
Statistics Canada. 2019a. 2016 Census of Population. Statistics Canada Catalogue no. 98-400-X2016164.
Statistics Canada. 2019b. 2016 Census of Population. Statistics Canada Catalogue no. 98-400-X2016165.
Statistics Canada. 2019c. 2016 Census of Population. Statistics Canada Catalogue no. 98-400-X2016176.
Statistics Canada. 2019d. 2016 Census of Population. Statistics Canada Catalogue no. 98-400-X2016178.
Statistics Canada. 2019e. Aboriginal Peoples Highlights Tables, 2016 Census. Statistics Canada Catalogue no. 98-402-X2016009.
Statistics Canada. 2019f. Population Estimates on July 1st, by Age and Sex. Statistics Canada Catalogue no. 17-10-0005-01.
Statistics Canada. 2019g. Re-contact, the Criminal Justice System and Beyond [PowerPoint slides].
Statistics Canada. 2018a. “Canadian Classification of Functions of Government, 2017.” The Daily. Statistics Canada Catalogue no. 11-001-X.
Statistics Canada. 2018b. Presentation by the Chief Statistician of Canada to the Deputy Minister Council, Saskatchewan [PowerPoint slides].
Truth and Reconciliation Commission of Canada. 2015a. Honouring the Truth, Reconciling for the Future: Summary of the Final Report of the Truth and Reconciliation Commission of Canada.
Truth and Reconciliation Commission of Canada. 2015b. Truth and Reconciliation Commission of Canada: Calls to Action.
Turcotte, M. 2011. “Intergenerational education mobility: University completion in relation to parents’ education level.” Canadian Social Trends. Statistics Canada Catalogue no. 11-008-X.
Wesley-Esquimaux, C. C. and M. Smolewski. 2004. “Historic trauma and Aboriginal healing.” The Aboriginal Healing Foundation Research Series.
- Date modified: