
Youth court statistics in Canada, 2014/2015

Archived Content
Information identified as archived is provided for reference, research or recordkeeping purposes. It is not subject to the Government of Canada Web Standards and has not been altered or updated since it was archived. Please "contact us" to request a format other than those available.
by Zoran Miladinovic
In Canada, youth aged 12 to 17 years accused of a crime are processed through youth courts.Note 1 Youth courts operate under the provisions of the Youth Criminal Justice Act (YCJA) separate from adult criminal courts. The YCJA preamble contains significant statements from Parliament about the values upon which the legislation is based. One of these statements mentions that accurate information about youth crime, the youth justice system, and effective measures should be publicly available (Department of Justice Canada 2013). Statistics from court administrative databases represent a useful information source in monitoring the effectiveness of the youth court system.
Using data from the Integrated Criminal Court Survey (ICCS), this article presents information on youth court cases completed in Canada in 2014/2015. It highlights key youth court indicators such as the number of completed charges and cases, case decisions, sentencing outcomes, and case processing times. This article also presents trends over time and some characteristics of youth who appear in court.
Completed youth court cases in 2014/2015 at a glance
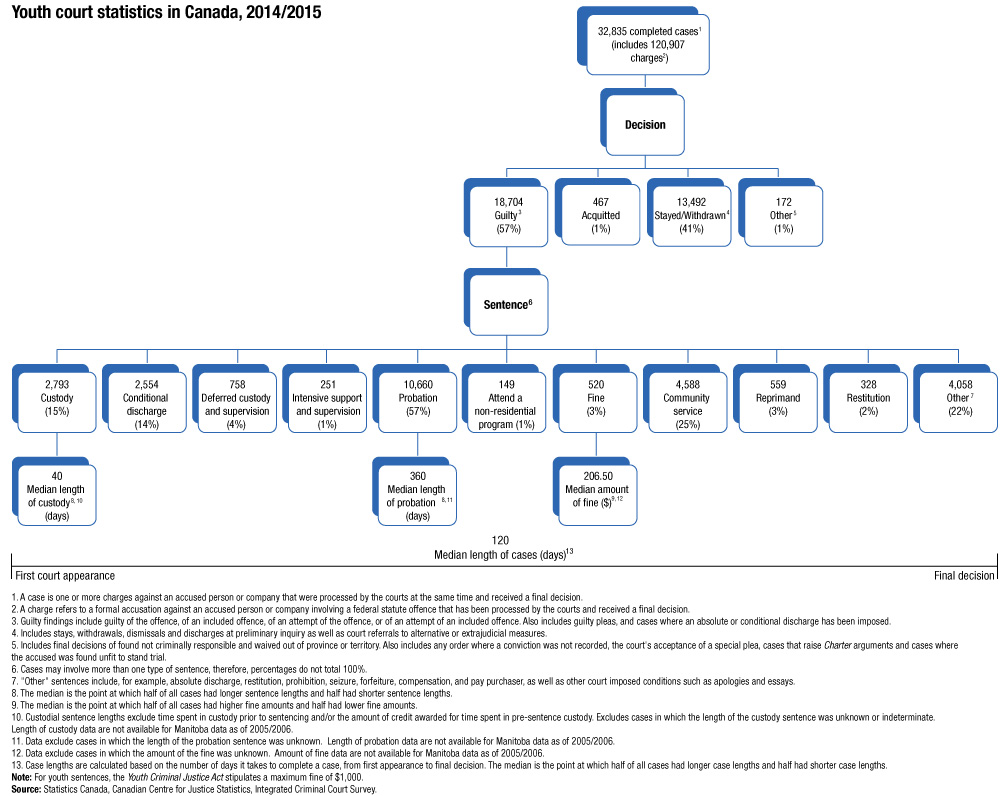
Description for Youth court statistics in Canada, 2014/2015
- 32,835 completed casesFlow Chart Note 1(includes 120,907 chargesFlow Chart Note 2)
- Decision
- 18,704 GuiltyFlow Chart Note 3(57%)
- SentenceFlow Chart Note 6
- 2,793 Custody (15%)
- 40 Median length of custodyFlow Chart Note 8Flow Chart Note 10 (days)
- 2,554 Conditional discharge (14%)
- 758 Deferred custody and supervision (4%)
- 251 Intensive support and supervision (1%)
- 10,660 Probation (57%)
- 360 Median length of probationFlow Chart Note 8Flow Chart Note 11(days)
- 149 Attend a non-residential program (1%)
- 520 Fine (3%)
- 206.50 Median amount of fine ($)Flow Chart Note 9Flow Chart Note 12
- 4,588 Community service (25%)
- 559 Reprimand (3%)
- 328 Restitution (2%)
- 4,058 OtherFlow Chart Note 7(22%)
- 2,793 Custody (15%)
- SentenceFlow Chart Note 6
- 467 Acquitted (1%)
- 13,492 Stayed/withdrawnFlow Chart Note 4(41%)
- 172 OtherFlow Chart Note 5(1%)
- 18,704 GuiltyFlow Chart Note 3(57%)
- 120 Median length of cases (days)Flow Chart Note 13
- Decision
Note: For youth sentences, the Youth Criminal Justice Act stipulates a maximum fine of $1,000.
Source: Statistics Canada, Canadian Centre for Justice Statistics, Integrated Criminal Court Survey.
Decrease in completed cases in youth court in 2014/2015
- In 2014/2015, Canada’s youth courts completed 32,835 cases involving 120,907 charges related to Criminal Code and other federal statute offences, including offences related to the YCJA (Table 1). The number of completed youth court cases declined by 19% from the previous year, which represents the sixth consecutive annual decline, as well as the lowest number of completed youth court cases since these data were first collected by Statistics Canada in 1991/1992 (Chart 1).
- Decreases in the number of completed youth court cases occurred in all provinces and territories, with the exception of Nova Scotia, which reported a 2% increase. Ontario, which reported the largest number of youth cases among the provinces and territories, had the largest absolute decrease in the number of cases (-3,340). This corresponds to 23% fewer completed youth cases in 2014/2015 compared to the previous year in Ontario. The Northwest Territories reported the largest percentage decline in the country, with a 40% decrease in the number of completed youth cases. Newfoundland and Labrador and Alberta reported the next largest decrease (-29% each) from the previous year (Table 2).Note 2
Description for Chart 1
| Year | Number of cases |
|---|---|
| 1991/1992 | 94,728 |
| 1992/1993 | 90,561 |
| 1993/1994 | 90,333 |
| 1994/1995 | 86,044 |
| 1995/1996 | 85,882 |
| 1996/1997 | 85,634 |
| 1997/1998 | 86,904 |
| 1998/1999 | 82,578 |
| 1999/2000 | 77,969 |
| 2000/2001 | 77,859 |
| 2001/2002 | 77,869 |
| 2002/2003 | 76,204 |
| 2003/2004 | 64,029 |
| 2004/2005 | 57,675 |
| 2005/2006 | 57,467 |
| 2006/2007 | 57,482 |
| 2007/2008 | 58,710 |
| 2008/2009 | 58,968 |
| 2009/2010 | 56,859 |
| 2010/2011 | 53,494 |
| 2011/2012 | 48,952 |
| 2012/2013 | 45,441 |
| 2013/2014 | 40,374 |
| 2014/2015 | 32,835 |
|
Note: A case is one or more charges against an accused person or company that were processed by the courts at the same time and received a final decision. Source: Statistics Canada, Canadian Centre for Justice Statistics, Integrated Criminal Court Survey. |
|
Almost all types of completed youth court cases decreased in 2014/2015
- Most youth court cases in 2014/2015 involved non-violent offences, representing 70% of all completed cases.Note 3 This trend has been consistent over time, and reflects what is also seen in police-reported youth crime statistics where most criminal offences are non-violent (Allen and Superle 2016).
- There was a decrease in the number of youth court cases for almost all offence types in 2014/2015 compared with 2013/2014 (Table 3). Property offences had the largest absolute decline (-2,791), followed by violent offences (-2,140), and administration of justice offences (-816). Proportionally, property offences had the largest decline (-21%), followed by administration of justice offences (-19%) and violent offences (-18%).
- Five Criminal Code offence types made up 40% of all completed cases in youth court. These five offences were: theft (11%),Note 4 common assault (8%), break and enter (8%), failure to comply with an order (7%), and mischief (6%) (Chart 2).These five offences have been the most frequent offence types in youth court cases for the past decade.
- Among individual offences, the largest decreases in the number of completed cases were observed for theft (-1,106), common assault (-894), and break and enter (-616). The largest proportional decreases were observed for breach of probation (-31%), disturbing the peace (-29%), and other crimes against persons (-25%).
- Only two offences showed an increase in the number of completed cases in 2014/2015: prostitution (+5) and attempted murder (+2), but combined these offences represented less than 1% of completed youth court cases for the year.
Description for Chart 2
| Type of cases | Percent of total cases |
|---|---|
| Robbery | 4.4 |
| Uttering threats | 5.3 |
| Drug possession | 5.4 |
| Possess stolen property | 5.7 |
| Major assaultChart 2 Note 2 | 6.3 |
| Mischief | 6.4 |
| Fail to comply with order | 7.0 |
| Break and enter | 7.7 |
| Common assault | 8.4 |
| TheftChart 2 Note 1 | 10.9 |
Source: Statistics Canada, Canadian Centre for Justice Statistics, Integrated Criminal Court Survey. |
|
Three-quarters of accused in youth court cases are male
- In 2014/2015, more than three-quarters of accused persons in youth court cases were male (77%) (Chart 3). The proportion of youth accused that are male has consistently ranged between 77 to 78% for the past fifteen years; it decreased from a high of 82% in 1991/1992, the first year for which data are available. Although females accounted for 23% of cases overall, they had a higher representation in cases involving non-violent offences, with prostitution (44%) and failure to appear (39%) the most common offence types among female youth accused. Cases with the lowest representation of females as accused were those involving sexual assault (3%) and other sexual offences (4%).
- Generally, individuals accused of having committed an offence when aged 16 to 17 years old, regardless of sex, made up the largest proportion of accused in youth court in 2014/2015 (63% of male youth accused and 59% of female youth accused). There were, however, some exceptions among particular offence types. For example, males accused of having committed an offence when aged 12 to 15 years old represented a higher proportion of accused for sexual assault and other sexual offences (61% and 65%, respectively) in comparison to their 16 to 17 year old counterparts. Among females, 12- to 15-year-olds were also more often accused of sexual assault and other sexual offences (71% of females accused of each of these offences) compared to their 16 to 17 year old counterparts (Table 4).
Description for Chart 3
| Age group (years) | Male accused | Female accused | Total |
|---|---|---|---|
| number of cases | |||
| 12 to 15 years of age | 7,980 | 2,626 | 10,606 |
| 16 to 17 years of age | 13,827 | 3,717 | 17,544 |
|
Note: Includes information on accused persons aged 12 to 17 years of age at the time of the offence. Excludes cases in which the age and/or the sex of the accused was unknown. A case is one or more charges against an accused person or company that were processed by the courts at the same time and received a final decision. Information on the sex of the accused is not available from Manitoba as of 2005/2006. Source: Statistics Canada, Canadian Centre for Justice Statistics, Integrated Criminal Court Survey. |
|||
More than half of completed youth cases result in guilty finding
- In 2014/2015, 57% of youth court cases resulted in a guilty finding, a disposition which includes both guilty pleas as well as findings of guilt by the courts. The proportion of guilty cases in youth court has been decreasing slowly over time, from a high of about 70% in the late 1990s (Chart 4).
- Acquittals are infrequent in youth court cases, accounting for slightly more than 1% of cases in 2014/2015 and this proportion has remained stable since data collection began in 1991/1992.
- Stays accounted for 20% of all cases in 2014/2015, where 3% were stayed specifically due to Crown cautions or extrajudicial sanctionsNote 5 and 17% were stayed for other reasons. The proportion of stayed youth cases where Crown cautions or extrajudicial sanctions measures were imposed steadily increased from 2% in 2003/2004 to a peak of 8% in 2010/2011, but has since been decreasing.
- Guilty findings in youth court cases vary across the country.Note 6 In 2014/2015, New Brunswick reported the highest proportion of guilty findings in youth court cases at 79%. Manitoba (73%) and British Columbia (70%) reported the next highest proportions. Yukon (40%), Ontario (44%), and Saskatchewan (55%) reported the lowest proportion of guilty findings (Chart 5).
- Guilty findings also vary by type of offence. In 2014/2015, cases involving being unlawfully at large (92%) and impaired driving (83%) had the highest percentage of guilty decisions among offence types. Cases involving drug possession (38%) and failure to appear (39%) had the lowest percentage of guilty decisions (Table 5).
- While there has been a declining proportion of guilty cases over time, this decrease has been mirrored by an increase in stayed cases (Chart 4). This trend is seen among cases involving four of the five most common youth offences in 2014/2015: theft, common assault, break and enter, and mischief. For cases involving theft and mischief, the proportion of stayed cases has in recent years converged to approach the proportion of guilty cases. The proportion of withdrawn cases has remained fairly stable, ranging from 19% to 26% between 1991/1992 and 2014/2015 (Chart 4).
Description for Chart 4
| Years | Stayed | Withdrawn | Guilty | Acquitted |
|---|---|---|---|---|
| percent | ||||
| 1991/1992 | 7.0 | 26.0 | 65.3 | 1.5 |
| 1992/1993 | 6.7 | 23.1 | 68.3 | 1.6 |
| 1993/1994 | 6.2 | 23.2 | 68.7 | 1.6 |
| 1994/1995 | 6.9 | 22.5 | 68.6 | 1.7 |
| 1995/1996 | 11.5 | 20.0 | 66.7 | 1.5 |
| 1996/1997 | 10.7 | 19.1 | 68.4 | 1.6 |
| 1997/1998 | 11.1 | 19.1 | 67.9 | 1.6 |
| 1998/1999 | 9.6 | 18.9 | 69.8 | 1.4 |
| 1999/2000 | 9.8 | 19.4 | 69.0 | 1.3 |
| 2000/2001 | 10.1 | 20.6 | 67.4 | 1.4 |
| 2001/2002 | 10.4 | 22.1 | 65.8 | 1.3 |
| 2002/2003 | 10.6 | 23.2 | 64.5 | 1.3 |
| 2003/2004 | 12.3 | 24.5 | 61.4 | 1.4 |
| 2004/2005 | 11.9 | 23.7 | 62.3 | 1.5 |
| 2005/2006 | 15.5 | 20.5 | 62.0 | 1.4 |
| 2006/2007 | 15.9 | 21.4 | 60.8 | 1.3 |
| 2007/2008 | 17.1 | 21.2 | 59.9 | 1.2 |
| 2008/2009 | 18.5 | 20.6 | 59.1 | 1.1 |
| 2009/2010 | 19.4 | 20.9 | 57.7 | 1.2 |
| 2010/2011 | 21.6 | 20.1 | 56.5 | 1.2 |
| 2011/2012 | 20.7 | 20.8 | 56.6 | 1.4 |
| 2012/2013 | 21.3 | 19.5 | 57.4 | 1.3 |
| 2013/2014 | 21.3 | 20.2 | 56.4 | 1.7 |
| 2014/2015 | 20.5 | 20.6 | 57.0 | 1.4 |
|
Note: A case is one or more charges against an accused person or company that were processed by the courts at the same time and received a final decision. There are many factors that may influence variations between jurisdictions, therefore, comparisons should be made with caution. Source: Statistics Canada, Canadian Centre for Justice Statistics, Integrated Criminal Court Survey. |
||||
Description for Chart 5
| Province and territory |
Percent of total cases |
|---|---|
| Nunavut | 61.7 |
| Northwest Territories | 64.3 |
| Yukon | 39.7 |
| British Columbia | 69.6 |
| Alberta | 57.1 |
| Saskatchewan | 55.3 |
| Manitoba | 72.9 |
| Ontario | 44.1 |
| Quebec | 66.5 |
| New Brunswick | 78.6 |
| Nova Scotia | 58.6 |
| Prince Edward Island | 68.2 |
| Newfoundland and Labrador | 67.7 |
| Canada | 57.0 |
|
Note: A case is one or more charges against an accused person or company that were processed by the courts at the same time and received a final decision. There are many factors that may influence variations between jurisdictions, therefore, comparisons should be made with caution. Source: Statistics Canada, Canadian Centre for Justice Statistics, Integrated Criminal Court Survey. |
|
About one in seven guilty youth court cases received a custodial sentence
- In 2014/2015, custodial sentences were imposed in 15% of guilty youth court cases (Table 6). A custody sentence was most often imposed in attempted murder cases (100%) and cases involving being unlawfully at large (65%).
- The proportion of guilty cases involving homicide (including first-degree murder, second-degree murder, manslaughter, and infanticide) that received custodial sentences in 2014/2015 (47%) was substantially lower than in 2013/2014, when 81% of guilty cases received custody. It is important to note that a custodial sentence is only mandated in the case of first- or second-degree murder. The proportion of guilty homicide cases that received custody over the 10-year period from 2005/2006 to 2014/2015 has varied from a low of 32% (2008/2009) to a high of 81% (2013/2014).Note 7 A custodial sentence was typically the most frequent type of sentence handed down for homicide over this time period. “Other”Note 8 sentences were also frequently handed down, as was probation. In 2014/2015, 53% of guilty homicide cases received an “other” sentence and 20% received probation.
- In 2014/2015, the use of custody sentences was the lowest for cases involving disturbing the peace (0%) and drug possession (2%).
- Overall, the median length of a custodial sentence in 2014/2015 was 40 days.Note 9 The median length of custody was longest for violent offences (90 days), with attempted murder having the longest median custody length of all offences at 585 days, and shortest for cases involving administration of justice offences (20 days). About 44% of cases receiving custodial sentences had a custody length of 1 month or less in 2014/2015. Very few cases received custody sentences longer than 1 year (2%) (Chart 6).
- The proportion of youth court cases sentenced to custody varies across the provinces and territories.Note 10 For the third consecutive year, the proportion of guilty cases with custody sentences was highest in Yukon (48%) and lowest in Quebec (9%) (Chart 7).
- For four of the five most common offences in youth court in 2014/2015 (theft, break and enter, failure to comply with an order, and mischief), the proportion of guilty cases sentenced to custody has decreased over the past ten years. For common assault, the proportion of guilty cases receiving custodial sentences has remained fairly stable. In 2014/2015, 7% of guilty cases involving common assault received a custody sentence, the lowest proportion of the five most common offences. In contrast, 16% of guilty cases involving failure to comply with an order received a custody sentence.
- Following the implementation of the YCJA in 2003, the proportion of youth court cases resulting in a custodial sentence decreased steadily until 2009/2010 but has been stable in recent years (Chart 8). For example, in 2002/2003, 27% of guilty youth cases received a custodial sentence; in 2003/2004, 22% of guilty youth cases received a custodial sentence, while in 2014/2015, 15% did. The deferred custody and supervision sentence, introduced in 2003 under the YCJA, is considered an alternative to custody. This type of sentence is served in the community under a set of strict conditions which, if violated, can result in the young person being sent to custody to serve the balance of the sentence (Department of Justice Canada 2013). The proportion of guilty cases receiving this type of sentence has increased from about 2% in 2003/2004 to about 5% in 2014/2015 (Chart 8).Note 11
- Other sentences created with the introduction of the YCJA are used relatively infrequently. More specifically, intensive support and supervisionNote 12 was ordered in about 1% of guilty youth cases in 2014/2015. Likewise, the sentence to attend a non-residential programNote 13 was ordered in less than 1% of guilty cases. ReprimandsNote 14 were given somewhat more often, in 3% of guilty youth cases in 2014/2015.
Description for Chart 6
| Length of custody sentenceChart 6 Note 1 | Percent of cases sentenced to custody |
|---|---|
| 1 month or less | 44.1 |
| Greater than 1 month to 3 months | 26.6 |
| Greater than 3 months to 6 months | 19.1 |
| Greater than 6 months to 12 months | 7.9 |
| Greater than 12 months to less than 2 years | 1.8 |
| 2 years or more | 0.4 |
Source: Statistics Canada, Canadian Centre for Justice Statistics, Integrated Criminal Court Survey. |
|
Description for Chart 7
| Province and territory |
Percent of guilty cases |
|---|---|
| Nunavut | 10.3 |
| Northwest Territories | 13.0 |
| Yukon | 48.0 |
| British Columbia | 18.1 |
| Alberta | 16.6 |
| Saskatchewan | 14.1 |
| Manitoba | 13.5 |
| Ontario | 19.0 |
| Quebec | 9.3 |
| New Brunswick | 14.6 |
| Nova Scotia | 14.4 |
| Prince Edward Island | 25.7 |
| Newfoundland and Labrador | 10.4 |
| Canada | 14.9 |
|
Note: A case is one or more charges against an accused person or company that were processed by the courts at the same time and received a final decision. There are many factors that may influence variations between jurisdictions, therefore, comparisons should be made with caution. Source: Statistics Canada, Canadian Centre for Justice Statistics, Integrated Criminal Court Survey. |
|
Description for Chart 8
| Years | Custody | Deferred custody and supervisionChart 8 Note 1 |
|---|---|---|
| percent | ||
| 1991/1992 | 24.3 | |
| 1992/1993 | 25.7 | |
| 1993/1994 | 27.5 | |
| 1994/1995 | 28.6 | |
| 1995/1996 | 27.7 | |
| 1996/1997 | 27.8 | |
| 1997/1998 | 29.4 | |
| 1998/1999 | 29.2 | |
| 1999/2000 | 28.2 | |
| 2000/2001 | 28.7 | |
| 2001/2002 | 27.1 | |
| 2002/2003 | 26.9 | |
| 2003/2004 | 21.9 | 1.5 |
| 2004/2005 | 21.1 | 3.3 |
| 2005/2006 | 18.4 | 3.8 |
| 2006/2007 | 16.6 | 3.5 |
| 2007/2008 | 15.9 | 4.0 |
| 2008/2009 | 15.4 | 4.2 |
| 2009/2010 | 14.8 | 5.0 |
| 2010/2011 | 15.6 | 5.2 |
| 2011/2012 | 15.2 | 5.1 |
| 2012/2013 | 14.9 | 5.1 |
| 2013/2014 | 14.9 | 5.2 |
| 2014/2015 | 14.9 | 4.5 |
Source: Statistics Canada, Canadian Centre for Justice Statistics, Integrated Criminal Court Survey. |
||
Probation remains the most common sentence imposed in youth court
- In 2014/2015, as has been the pattern since the data was first collected in 1991/1992, probation was the most common type of sentence imposed in youth court cases, either on its own or in combination with another type of sentence, at 57% of all guilty cases (Chart 9). Moreover, probation was the most serious sentenceNote 15 in half (51%) of guilty cases in youth court in 2014/2015, a finding that has remained consistent since data collection began in 1991/1992, ranging from 43% of guilty cases in 1992/1993 to 57% in 2002/2003.
- The median length of probation in 2014/2015 was about a year (360 days) for all case types (Table 6).Note 16 The median length of probation was similar among cases involving violent offences, property offences, administration of justice offences, other Criminal Code offences, and Criminal Code traffic offences. Among guilty cases, the median length of probation for sexual assault cases was the longest, at 540 days.
Description for Chart 9
| Type of sentence | Percent of guilty cases |
|---|---|
| Probation | 57.0 |
| Community service | 24.5 |
| Custody | 14.9 |
| Conditional discharge | 13.7 |
| Deferred custody and supervision | 4.1 |
| Reprimand | 3.0 |
| Fine | 2.8 |
| OtherChart 9 Note 1 | 21.7 |
Source: Statistics Canada, Canadian Centre for Justice Statistics, Integrated Criminal Court Survey. |
|
One quarter of youth court cases received a community service order
- A community service order was the second most common type of sentence imposed in youth court cases (25%), either on its own or in combination with another type of sentence. These orders require a youth to perform unpaid work.
- “Other” sentences include sanctions such as absolute and conditional discharges, restitution, and compensation. Among these, a conditional dischargeNote 17 was the most frequently ordered sentence. In 2014/2015, it was ordered in about 14% of guilty cases overall.
- Guilty cases may receive more than one sentence type. Probation is frequently associated with other sentences. Among guilty cases sentenced to custody in 2014/2015, probation was also ordered in 41% of cases. Probation was also ordered in 13% of cases receiving a fine, 14% of cases receiving a conditional sentence, and 68% of cases receiving restitution. “Other” sentences are also frequently associated with cases that receive a fine (66%), conditional sentence (50%), and restitution (100%).
Half of all youth court cases are completed within 3 months or less
- In 2014/2015, the median length of time taken to complete a youth court case, from first appearance to final decision, was 120 days, the same as in 2013/2014. Over the past decade, the time to decision has shown an alternating trend of rising and falling. For instance, in 2005/2006 the median was 106 days, which increased to 119 days in 2008/2009. It subsequently fell to 113 days in 2010/2011, before again beginning to increase.
- In 2014/2015, Prince Edward Island had the shortest median case processing time (about 29 days) while Newfoundland and Labrador had the longest (163 days) (Chart 10).Note 18
- Cases involving violent offences often take longer than others to complete (median of 169 days for violent offences in 2014/2015; 117 days for property offences, 84 days for administration of justice offences). In 2014/2015, homicide cases took the longest and were the only offence type with a median length greater than one year (420 days). The median length of time to complete homicide cases has decreased since 2013/2014, when it was reported as 611 days; however, it has generally been increasing for the last decade. Sexual assault cases followed homicide cases in length of time to complete the case (median of 260 days), followed by cases involving other sexual offences (median of 239 days) (Table 3).
- Cases involving administration of justice offences had some of the shortest median case processing times, at 84 days in 2014/2015. In particular, cases involving being unlawfully at large had the shortest median processing time among all offences at 5 days (Table 3).
Description for Chart 10
| Province and territory |
Median length of cases (days) |
|---|---|
| Nunavut | 72 |
| Northwest Territories | 68 |
| Yukon | 129 |
| British Columbia | 117 |
| Alberta | 125 |
| Saskatchewan | 64 |
| Manitoba | 141 |
| Ontario | 122 |
| Quebec | 141 |
| New Brunswick | 79 |
| Nova Scotia | 127 |
| Prince Edward Island | 29 |
| Newfoundland and Labrador | 163 |
| Canada | 120 |
|
Note: Case lengths are calculated based on the number of days it takes to complete a case, from first appearance to final decision. The median is the point at which half of all cases had longer case lengths and half had shorter case lengths. A case is one or more charges against an accused person or company that were processed by the courts at the same time and received a final decision. There are many factors that may influence variations between jurisdictions, therefore, comparisons should be made with caution. Source: Statistics Canada, Canadian Centre for Justice Statistics, Integrated Criminal Court Survey. |
|
Survey description
The Integrated Criminal Court Survey (ICCS) is administered by the Canadian Centre for Justice Statistics (Statistics Canada) in collaboration with provincial and territorial government departments responsible for criminal courts in Canada. The survey collects statistical information on adult and youth court cases involving Criminal Code and other federal statute charges. Data contained in this article represent the youth court portion of the survey. The individuals involved are persons aged 12 to 17 years (up to the 18th birthday) at the time of the offence. All youth courts in Canada have reported data to the youth component of the survey since the 1991/1992 fiscal year.
The primary unit of analysis is a case. A case is defined as one or more charges against an accused person or company that were processed by the courts at the same time and received a final decision. A case combines all charges against the same person having one or more key overlapping dates (date of offence, date of initiation, date of first appearance, date of decision, or date of sentencing) into a single case.
A case that has more than one charge is represented by the charge with the "most serious offence" (MSO). The most serious offence is selected using the following rules. First, court decisions are considered and the charge with the “most serious decision” (MSD) is selected. Court decisions for each charge in a case are ranked from most to least serious as follows: 1) guilty, 2) guilty of a lesser offence, 3) acquitted, 4) stay of proceeding, 5) withdrawn, dismissed and discharged, 6) not criminally responsible, 7) other, and 8) transfer of court jurisdiction.
Second, in cases where two or more charges result in the same MSD (e.g., guilty), Criminal Code sentences are considered. The charge with the most serious offence type is selected according to an offence seriousness scale, based on actual sentences handed down by courts in Canada.Note 19 Each offence type is ranked by looking at (a) the proportion of guilty charges where custody was imposed and (b) the average (mean) length of custody for the specific type of offence. These values are multiplied together to arrive at the final seriousness ranking for each type of offence. If, after looking at the offence seriousness scale, two or more charges remain tied then information about the sentence type and duration of the sentence are considered (e.g., custody and length of custody, then probation and length of probation, etc.).
Cases are counted according to the fiscal year in which they are completed. Each year, the ICCS database is considered final at the end of March for the production of court statistics pertaining to the preceding fiscal year. However, these counts do not include cases that were pending an outcome at the end of the reference period. If a pending outcome is reached in the next fiscal year, then these cases are included in the completed case counts for that fiscal year. However, if a one-year period of inactivity elapses, then these cases are deemed complete and the originally published counts for the previous fiscal year are subsequently updated and reported in the next year’s release of the data. Historically, updates to a previous year’s counts have resulted in an increase of about 2%.
Detailed data tables
Table 1 Charges and cases completed in youth court, Canada, 2005/2006 to 2014/2015
Table 2 Cases completed in youth court, by province and territory, 2013/2014 and 2014/2015
Table 3 Cases completed in youth court, by type of offence, Canada, 2013/2014 and 2014/2015
Table 5 Cases completed in youth court, by type of offence and decision, Canada, 2014/2015
References
Allen, M. and T. Superle. 2016. “Youth crime in Canada, 2014.” Juristat. Statistics Canada Catalogue no. 85-002-X.
Bala, N. 2003. Youth Criminal Justice Law. Toronto. Irwin Law. p. 431.
Department of Justice Canada. 2013. The Youth Criminal Justice Act: Summary and Background. Ottawa. (accessed May 19, 2016).
Youth Criminal Justice Act, S.C. 2002, c.1.Notes
- Date modified: