
Statistics Canada
www.statcan.gc.ca
Common menu bar links
Youth Crime in Canada, 2006

Archived Content
Information identified as archived is provided for reference, research or recordkeeping purposes. It is not subject to the Government of Canada Web Standards and has not been altered or updated since it was archived. Please "contact us" to request a format other than those available.
by Andrea Taylor-Butts and Angela Bressan
Introduction
Data sources
Detailed data tables
References
Endnotes
Introduction
In 2006, the national crime rate was down 3% over the previous year and was the lowest it had been in more than 25 years. However, the youth crime rate, which includes youth (12 to 17 years of age) formally charged or recommended to the Crown for charging by police as well as youth cleared by means other than the laying of a charge, was up 3% from a year earlier. Moreover, since 1961 when statistics were first available, the rate of homicides committed by young people under the age of 18 was at an all-time high. Still, the youth crime rate in 2006 was substantially lower than in the early 1990s. Additionally, the replacement of the Young Offenders Act (YOA) with the Youth Criminal Justice Act (YCJA) in 2003 has brought significant changes to how the criminal justice system in Canada responds to youth involved in criminal activities (see Text box 1, The YCJA: A summary).
This Juristat presents a picture of youth crime in Canada, as reported to police and examines trends in the youth crime rate since its peak in 1991 as well as recent trends in crimes committed by youth, with particular reference to the period following the implementation of the YCJA.
Text box 1
The YCJA: A summary
In 1998, the Department of Justice Canada introduced a “Strategy for Youth Justice” that approached youth justice with an inclusive framework, including crime prevention, education, child welfare, child mental health, family and the community. One aspect of the “Strategy for Youth Justice” was the Youth Criminal Justice Act (YCJA), which was first introduced into Parliament in March 1999 and came into force on April 1, 2003 (Department of Justice Canada. 2003).
Building on the strengths of the Young Offenders Act (YOA), the YCJA also addresses the weaknesses of the previous legislation and provides the legislative framework for a fairer and more effective youth justice system. Among the chief objectives of the YCJA are: clear and coherent principles to improve decision-making in the youth justice system; more appropriate use of the courts, fairness in sentencing, and reduced use of custody so that the most serious interventions are reserved for the most serious crimes; clear distinctions between serious violent offences and less serious offences; and effective reintegration of youth (Department of Justice Canada. 2003:20).
One of the main features of the YCJA is the diversion of youth who have committed non-violent and minor crimes away from the formal court system by encouraging the use of extrajudicial measures. These measures are meant to provide timely and meaningful consequences and allow the community to participate in developing community-based responses to youth crime. Extrajudicial measures include taking no further action, informal police warnings, referrals to community programs, formal police cautions, Crown cautions and extrajudicial sanctions programs (Department of Justice Canada. 2003).
Trends in youth crime rates1
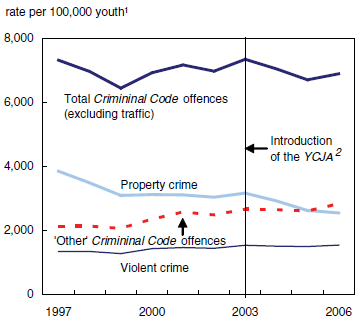
After peaking in 1991 (9,126 per 100,000 youth), the youth crime rate, following a pattern similar to the national crime rate, decreased throughout the 1990s. More recently, youth crime has fluctuated; generally increasing from 1999 to 2003 then decreasing until 2006. Despite the 3% increase in 2006, youth crime was 6% below the rate a decade earlier and 25% below the 1991 peak. In 2006, almost 180,000 youth were implicated in a violation of the Criminal Code (excluding traffic), bringing the youth crime rate to 6,885 per 100,000 youth (Table 1).
Across Canada the rate of youth crime varied considerably, with provincial crime rates ranging from a low of 3,765 per 100,000 youth in Quebec to a high of 19,939 in Saskatchewan (Table 2). All provinces except Quebec reported an annual increase in their youth crime rate in 2006,2 with Prince Edward Island (+38%), Newfoundland and Labrador (+22%), Nova Scotia (+17%), and Manitoba (+14%) recording the largest increases.
Following the national trend, British Columbia (-49%), Alberta (-41%), Ontario (-34%) and Quebec (-25%) were the only provinces to experience declines in their youth crime rates between the 1991 peak in youth crime and 2006. In the other six provinces, particularly New Brunswick (+40%), Nova Scotia (+35%), Saskatchewan (+34%), and Newfoundland and Labrador (+25%), youth crime rates were up between 1991 and 2006.
Violent crimes make up a larger share of youth crime
The last 10 years have seen a shift in the distribution of the types of crimes for which youth are apprehended with increases in both violent offences and ‘other’ Criminal Code offences. While the proportion of youth involved in property crimes has decreased over this time period, still youth involved in these types of offences accounted for about 4 in 10 youth accused of crimes in Canada in 2006 (Chart 1).
In the 10 years between 1997 and 2006, the overall violent crime rate in Canada declined 4%. However, the violent crime rate among youth has risen 12% in the last 10 years and has climbed 30% since 1991. By 2006, youth accused of violent offences accounted for nearly a quarter of youth crime; up from one in five 10 years earlier. Much of this increase in the rate of youth violent crime has been driven by an increase in youth involvement in assault. Youth accused of assault represented nearly 80% of those apprehended for a violent crime in 2006, with those accused of common assault constituting about 60% of all youth involved in violent offences (Table 1).
Chart 1
Youth violent crimes and ‘other’ Criminal Code offences
increase while property crimes drop over the last decade
1. Youth aged 12 to 17.
2. Youth Criminal Justice Act (YCJA).
Source: Statistics Canada, Canadian Centre for Justice Statistics,
Uniform Crime Reporting Survey.
In 2006, both the number and rate of youth aged 12 to 17 years accused of homicide reached their highest point since data were first collected in 1961. However, just 5 years prior, the youth homicide rate was at a 30-year low. Thus, while one of the largest growths in the youth crime rate in the past decade has been in the rate of youth accused of homicide (+41%), it is important to note that the rate of youth-perpetrated homicide can vary greatly from year-to-year due to the relatively small number of youth who commit homicide.
In total, 84 youth3 (72 male and 12 female), representing less than 0.1% of all young offenders, were implicated in 54 homicides in 2006 (Li, Geoff. 2007). Moreover, about half (52%) of homicides where the accused was a youth involved multiple perpetrators versus a single accused; this compared to just 15% of homicides involving an adult accused (Li, Geoff. 2007). In addition, evidence of gang involvement was reported by police in 22% of homicides with a youth accused (versus 9% of homicides where adults were accused) (Li, Geoff. 2007).
About 5% of all youth crimes in 2006 involved a weapon.4 Considering youth violent crime alone, weapons were present in about 20% of cases, a figure that has remained stable since 2004 but represents a decline from previous years. Between 1998 and 2003, weapons were present in about 25% of violent crimes among youth.5 Knives and other cutting instruments were the weapons most commonly involved in youth violent crimes, accounting for about one-third of the weapons in 2006. Another 15% of weapons were blunt objects such as clubs or bats, 14% were firearms,6 and other types of weapons made up the remainder. Typically, it was older youth (i.e., aged 15 to 17) who were involved in violent offences where weapons were present.
In 2006, nearly 7 in 10 (69%) youth violent offences involving weapons were assaults. Homicides constituted a very small percentage (0.05%) of youth crime and represented less than 1% of all violent crimes where a weapon was present in 2006. However, 44% of homicides committed by youth involved a knife and 17% a firearm (Li, Geoff. 2007).
In addition to the growth in youth violent crime rates, youth involvement in ‘other’ Criminal Code offences such as mischief, bail violations, disturbing the peace, offensive weapons7 and counterfeiting have increased considerably over the last 10 years (+34%) (Table 1). In particular, rates for mischief (+46%), which accounts for one-third of ‘other’ Criminal Code offences, bail violations (+33%) and offensive weapons (+44%) have shown notable increases from 10 years earlier.
Drops in minor theft and break and enter drive continuing decline in youth property crime rates
Opposite the trend in violent crime rates, the youth property crime rate fell to a third of what it had been 10 years earlier, putting it at its lowest point in a decade. Much of the decline in the rate of property crime in 2006 can be explained by substantial decreases in rates for break and enters (-47%) and minor theft (-33%), the criminal offence in which youth were most commonly implicated. Together, youth accused of these crimes represented more than two-thirds of the youth apprehended for property offences. Motor vehicle theft rates also declined in 2006, down 41% from 10 years ago (Table 1).
By 2006, the rate of break-ins among youth in Canada had dropped to its lowest level in a decade. The large reduction in the rate of break-ins may be related, in part, to innovative police crime prevention programs targeting break-ins in specific neighbourhoods.8 Another contributing factor may be an increase in the use of home security devices by Canadians. The General Social Survey (GSS) reported that more than twice as many Canadians had burglar alarms or motion detectors in 2004 (31%) than in 1993 (15%) (Gannon, 2005). Also, one third of Canadians reported in 2004 that they had installed new locks or security bars in their home.
Increase in cocaine and other drugs
In 2006, close to 18,000 youth, or 693 youth per 100,000 population, were accused of drug-related offences (Table 1). Drug-related crimes among youth have climbed dramatically over the last 10 years, with a rate of drug offences among youth in 2006 that was nearly double (+97%) that of 10 years earlier (Table 1). While the vast majority of drug-related offences involved cannabis (84%), the proportion of youth accused of cocaine and other drug offences has grown, more than doubling over the last 10 years.
This growth follows the introduction of the Controlled Drugs and Substances Act (CDSA) in May 1997. Replacing the Narcotic Control Act, the CDSA strengthened law enforcement powers and broadened the range of illegal substances covered by the drug legislation to include substances such as amphetamines, LSD and anabolic steroids. Other explanations for the increased rates of other drugs may reside in the growing popularity of certain drugs, such as ecstasy and crystal methamphetamines (Gannon, 2005; Silver 2007). For example, in a report discussing the drug culture in Ontario, it is indicated that methamphetamine labs, which produce ‘crystal meth’, have increased significantly throughout the province, particularly between 2001 and 2004.9
Youth crimes at school10
Continued concerns over bullying and violence in schools makes youth crime committed on school grounds a topic of ongoing interest. About one-tenth (13%) of Criminal Code (excluding traffic) and drug violations by youth occurred on school property in 2006. About three-quarters (73%) of youth criminal incidents taking place on school grounds that came to the attention of the police occurred during the hours of supervised school activities—about a quarter of policereported youth crime occurred after school. However, with the absence of students, teachers and other school staff outside regular school hours, crimes occurring at these times would be more likely to go undetected and unreported than those taking place during school hours. In addition, ‘zero tolerance’ policies may increase the likelihood that violent offences that have taken place during school hours will be reported to police.
Assaults, particularly common assault, represented about 30% of all violations committed by youth on school property and uttering threats constituted another 8%. Nearly 20% of crimes committed at school were drug offences, whereas 5% of youth crimes committed elsewhere were drug-related. Youth drug offences taking place on school grounds usually involved the possession (78%) or trafficking of cannabis (10%).
Rates of youth crime occurring on school property have shown some fluctuations over the last few years. However, generally, youth crime rates at school have risen. According to policereported data, the rate for youth committing Criminal Code and drug offences on school grounds was up 27% in 2006 over 1998.11 This increase was due in part to an 18% rise in youth crime rates for Criminal Code offences committed at school, as well as a 66% rise in drug offences.
Weapons were not present in most crimes occurring on school property, either during or after supervised hours. About 7% of all youth crimes committed on school grounds involved weapons and less than 1% of all school crimes in Canada involved firearms. Moreover, police-reported data from 1998 to 2006 indicate that these figures are consistent with previous years.12 When a weapon was present, it was most often a knife or blunt object. Among those school incidents where a weapon was known to be present, 36% involved a knife or some other cutting instrument, 14% a club or other blunt instrument and 9% a gun. In the remaining incidents, some other type of weapon was used.
Measures other than charges used to handle the majority of youth crimes
Once a young person accused of a crime is apprehended by police, he or she may be formally charged, recommended to the Crown for charging by police, or dealt with through other means. Police-reported data13 show that charges were laid or recommended against 42% of youth accused of a Criminal Code offence in 2006, while 58% of youth accused were given a warning, caution, referral to a community or extrajudicial program or handled through some other means in lieu of formal charges (Table 3). In total, about 74,000 youth, or 2,862 per 100,000, were charged14 with a crime and about 104,000 (4,023 per 100,000) were cleared using other measures (Table 1).
The proportion of youth charged varied across Canada. In 2006, the proportion of apprehended youth charged was smallest in the territories (26% overall), followed by British Columbia (29%) and the Atlantic provinces (35% overall); while Ontario (47%), Saskatchewan (46%) and Manitoba (45%) had higher proportions charged (Table 3). It is important to note, however, that differences in the mix of offences committed by youth across the provinces and territories could account for some of the inter-jurisdictional variations in the proportions of youth charged. While generally similar, the specific make-up of youth crime is distinctive for each province and territory. For instance, youth apprehended for violent crime constitute a smaller proportion of the youth accused of crimes in Yukon (18%), Northwest Territories (17%) and Nunavut (18%) than in provinces such as Ontario and Manitoba, where about onequarter of apprehended youth are accused of violent offences. Additionally, jurisdictional differences may be, in part, a reflection of the differences in the administration of youth justice across Canada, as well as inter-jurisdictional variations in the availability of extrajudicial programs and recording practices surrounding their usage.
Warnings and cautions accounted for 44% of the alternatives to formal charges employed by police, referrals to community and extrajudicial programs made up 9%, and other means15 made up the remaining 47%.16 Overall, warnings and cautions were most commonly issued to youth implicated in property offences (30%) such as minor theft, rather than violent crimes (19%) or ‘other’ Criminal Code violations (20%). Among violent offences, common assaults were most likely to result in a warning or caution, as were violations for disturbing the peace among ‘other’ Criminal Code offences. Referrals to community and extrajudicial programs were also more likely among youth involved in property offences (7%) compared to youth accused of violent offences (4%) and ‘other’ Criminal Code offences (1%).
Measures other than formal charges were used to handle just over half (55%) of male youth implicated in a crime, whereas alternate means were used for close to two-thirds (64%) of female youth accused of an offence. Formal charges were also more likely to be laid against older youth, namely those aged 15 to 17, than against youth under the age of 15; more than half of 16- and 17-year-olds and just under half of 15-year-olds were charged, compared to 40% of youth aged 14, 31% aged 13 and 19% of 12-year-olds.
Differences in the proportion of male and female youth charged may be related to the types of offences for which each group tends to be implicated. However, when the type of offence (e.g., robbery and break and enter) was considered in conjunction with the sex of the accused, male youth were still more likely to be charged in some cases. Overall, the proportion of male youth involved in property (38%) and violent (49%) crimes who were formally charged rather than dealt with through other means was greater than for female youth apprehended for these types of offences (28% and 41%, respectively). In particular, the proportion of male youth accused of robbery and break and enter who faced charges for these offences was about twice that of female youth apprehended for these crimes.
Further examination of the circumstances surrounding the offences, such as the presence of a weapon, or whether or not the apprehended youth was accused of more than one offence, may offer insight into the differential charging of male and female youth for certain crimes. For example, policereported data reveal that compared to female youth (24%), higher proportions of male youth were involved in robberies where a weapon was present (41%). As well, male youth (45%) charged with robbery were more likely than female youth (36%) charged with this crime to be accused of three or more offences in addition to the robbery. Such was not the case, however, for male and female youth charged with break and enters, where 29% of female youth so charged were also accused of other offences as were 24% of male youth.17
The proportion of accused youth cleared by means other than charges increased following the introduction of the YCJA
One of the primary objectives of the YCJA is to divert more youth involved in minor, non-violent crimes from the formal justice system. Furthermore, the YCJA “…formalizes and structures the police use of discretion…” (Carrington and Schulenberg, 2005: 5) providing police with specific legislative guidance to encourage the use of extrajudicial measures and sanctions for youth accused of less serious offences. Thus, the subsequent increase in the proportion of youth processed through means other than charges following the introduction of the YCJA is not unexpected. Moreover, research assessing the preliminary impact of the YCJA on police use of measures other than charges shows that, at least initially, these practices changed to coincide with the implementation of the YCJA (Carrington and Schulenberg, 2005).
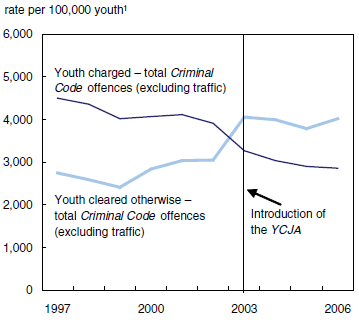
Hence, despite a 3% year-over-year increase in the total youth crime rate in 2006, the rate of youth charged dropped 1% from the previous year and 27% since 2002, the year prior to the enactment of the YCJA. Accordingly, this decrease in the youth charge rate was accompanied by a corresponding rise in the rate of accused youth dealt with through other means. In 2006, the rate of accused youth not charged was up 6% over the previous year and was 32% above the 2002 rate (Chart 2).
Chart 2
Rates of youth formally charged down while those cleared otherwise up since introduction of the Youth Criminal Justice Act (YCJA)
1. Youth aged 12 to 17.
Source: Statistics Canada, Canadian Centre for Justice Statistics,
Uniform Crime Reporting Survey.
Over the last decade, the proportion of youth apprehended by police but not formally charged or recommended for charging has generally been on the rise (Chart 3). Until 2002, this upward trend was gradual. However, in the period immediately following the introduction of the YCJA, the relative number of cases where youth were handled through means other than charges climbed sharply. Over the six-year period from 1997 to 2002, the proportion of youth accused of a Criminal Code offence but not charged ranged from 37% to 44%. However, over the one-year period from 2002 to 2003, this proportion climbed to 55%. Since the YCJA came into force in 2003, the proportion of accused youth cleared otherwise18 has remained relatively stable with measures other than charges used in almost 60% of youth crimes in 2006.
Chart 3
Proportion of accused youth cleared by means other than formal charges has grown across all major Criminal Code offence categories

1. Youth Criminal Justice Act (YCJA).
Source: Statistics Canada, Canadian Centre for Justice Statistics, Uniform Crime Reporting Survey.
Subsequent to the implementation of the YCJA, the proportion of accused youth who were cleared by means other than a charge increased for virtually all offences (Table 4). Despite this change, the crimes that were most likely to result in charges prior to the YCJA remained as such after the new legislation came into force. For example, after the introduction of the YCJA, charges continued to be the norm for offences associated with the most severe penalties, such as homicide, attempted murder and aggravated assault. Correspondingly, offences carrying less serious penalties, such as disturbing the peace, mischief of $5,000 and under and minor theft, were still among those least likely to result in charges.
Text box 2
Decline in the proportion charged after the YCJA
greater for female youth
Following a longstanding trend, the majority (77%) of youth charged with a criminal offence in 2006 were male, with male youth charged with an offence at three times the rate of female youth (4,285 per 100,000 males compared to 1,366 females). In the 10 years between 1997 and 2006, police charges declined for both male (-38%) and female (-34%) youth. However, since 2002 and the introduction of the YCJA, decreases in charge rates have been more pronounced for female youth (-31%) than for male youth (-25%). This difference is likely related to the different types of offences that each group typically commits. For example, the proportion of female youth charged with minor theft was nearly twice that of young males. Minor, non-violent offences, such as theft of $5,000 and under, are more likely to be targeted for diversion under the YCJA.
Changes in the proportion of youth charged since the YCJA are especially notable for certain Criminal Code offences
Since the YCJA came into effect, there have been pervasive changes in the use of means other than charges to handle youth crime, particularly for youth accused of certain offences (Table 3). For example, in 2006, the proportions of youth cleared otherwise for possession of stolen goods and bail violations were more than double what they had been in the year prior to the YCJA’s implementation. As well, just over a third (38%) of youth fraud offences were cleared by means other than charges in 2002. However after the YCJA came into force, more than half (54% in 2006) of youth accused of fraud offences were cleared otherwise. Even among offences where historically a majority of the accused were cleared otherwise, following the implementation of the YCJA, there were increases in the proportion of youth handled through means other than charges (Table 3). For instance, about 80% of youth accused of minor mischief offences were cleared otherwise in 2006, up from two-thirds in 2002. Similarly, in 2006, three-quarters of minor thefts resulted in the accused youth being cleared by means other than charges compared to 56% in 2002. And while just under half (48%) of youth accused of common assault were cleared otherwise prior to the YCJA, in 2006 the figure was up to just over 60%.
Greater use of warnings and cautions
Detailed information on how youth cleared by means other than by charges are handled is not available through the UCR Survey prior to 2003. However, since that time, the use of warnings and cautions has generally increased among the extrajudicial means used to process youth accused of a crime. For example, a third of youth cleared by means other than charges were issued a warning or caution in 2003. By 2006, this figure was up to more than 4 in 10 youth cleared otherwise. Meanwhile, there has been little change in the extent to which referrals are used, and the use of means not otherwise classified has shown a slight decline. Furthermore, this usage pattern among the various types of diversion used for youth accused of crime was generally similar across the major offence categories.
Changes also seen in youth courts and correctional services post-YCJA implementation
Coinciding with reductions in the use of charging by police to handle youth accused of a crime and commensurate with the objectives of the new legislation, the number of cases coming to youth courts has dropped noticeably since the YCJA came into force. Furthermore, since the introduction of the YCJA, there has been a marked decline in the use of custody for youth found guilty.
Between 2002/2003 and 2003/2004, the years immediately preceding and following the introduction of the YCJA, there was an unprecedented annual drop in the number of cases completed in youth courts (Thomas, 2005). By 2005/2006, the youth court caseload was down 26% over 2002/2003 (Statistics Canada, 2007). Caseload declines were greatest for cases involving property-related crimes such as theft, break and enter, and fraud — offences for which there were also notable increases in the use of measures other than charges by police. In the first year of the YCJA, the number of cases for property offences dropped 19% over 2002/2003, while the caseload for violent crimes was down 9%. By 2005/2006, caseloads for property-related and violent offences were down 31% and 18%, respectively, from 2002/2003.
In addition to diverting youth accused of minor, non-violent offences from the formal justice system, the YCJA also aims to reduce reliance on remand and sentenced custody and ensure that custodial sentences are not overused. Consistent with this objective, the proportion of guilty cases sentenced to custody has decreased from about 27% prior to the new legislation to about 18% in 2005/2006 (Statistics Canada, 2007). Decreases in the use of custody varied by offence but, overall, declines were recorded for virtually all types of youth crime.
Not unexpectedly, changes were also seen in youth correctional services after the YCJA was implemented. Within the first year following the introduction of the YCJA, the incarceration rate19 for youth fell 38% from 15 per 10,000 youth to 9, the largest drop in about a decade. In 2004/2005, the incarceration rate remained stable then declined further to 8 per 10,000 youth in 2005/2006.
Admissions to custody were gradually decreasing prior to the introduction of the YCJA in 2003. However, a year after the legislation was implemented, total custodial admissions were down markedly, dropping 25% between 2002/2003 and 2003/2004. Two years after the enactment of the YCJA, admissions to custody were down 30% compared to 2002/2003 (Calverley, 2006; 2007).
Reductions in admissions to both secure and open sentenced custody were larger than decreases in remand (pre-trial detention) admissions. By 2004/2005, sentenced custody20 admissions were nearly half of what they were in 2002/2003 (i.e., secure custody was down 48% and open custody was down 45%), whereas remand admissions were lower by 20%. Under the YCJA, the provisions for remanding high-risk offenders remain the same as under the YOA, which in turn, may offer some explanation for why the magnitude of change is smaller for remand admissions compared to admissions to sentenced custody (Calverley, 2006).
It is likely that the implementation of the YCJA has also contributed to a decrease in the use of probation. Under the former YOA, youth found guilty and sentenced to custody were often ordered to probation as well to ensure supervision and integration into the community after custodial sentences had been served. However, under the YCJA, mandatory community supervision upon release from custody is automatically built into youth custody sentences. Accordingly, the percentage of guilty cases sentenced to probation fell from 70% to 60% between 2002/2003 and 2005/2006 (Statistics Canada, 2007). Moreover, from 2002/2003 to 2003/2004, probation admissions dropped 34% and continued to decline, but less dramatically in the following year. In 2004/2005, probation admissions were down 20% over the previous year and were 43% lower than 2002/2003 figures (Calverley, 2007).
The YCJA has also offered courts new sentencing options such as deferred custody and supervision orders, intensive support and supervision, and orders to attend a non-residential program. Of these new sentencing options, deferred custody and supervision orders were most frequently issued, representing 3% of guilty cases in 2005/2006 (Statistics Canada, 2007). Community portions of custody and supervision orders (CPCS), as well as deferred custody and supervision orders, two of the new community sentence options made available through the YCJA, represented almost one-tenth (9%) of correctional services admissions in 2004/2005. While 2004/2005 admissions to CPCS were stable over the previous year, admissions to deferred custody and supervision increased 16% in its second year of usage (Calverley, 2007).
Summarizing youth crime in 2006
In 2006, the youth crime rate was 3% higher than the previous year, but 6% lower than the rate 10 years earlier. The overall decline in youth crime rates between 1997 and 2006 was driven by decreases in rates of youth property offences such as minor theft and break and enter. In contrast, youth violent crime rates, particularly for assault, increased, as did rates for ‘other’ Criminal Code offences such as mischief and disturbing the peace.
Involvement in drug-related crimes was also up among youth in 2006. Crime rates for youth accused of cannabis-related offences, which constituted 84% of youth drug crimes, were nearly twice what they had been 10 years prior, while rates for cocaine and other drug violations had more than doubled. In 2006, almost 60% of youth implicated in an offence did not face charges but were dealt with through alternate means such as warnings, cautions, community programs and extrajudicial programs. Since the introduction of the YCJA in 2003, the use of these alternate measures to handle youth accused of a crime has increased for almost all Criminal Code offences. Despite this overall decline in charging among accused youth, those implicated in more serious crimes were still among the most likely to face charges, while youth apprehended for less serious offences continued to be among the least likely to be formally charged or recommended for charging.
Text box 3
Key terminology and definitions
Youth crime rate includes youth, aged 12 to 17, accused of a criminal offence and formally charged, recommended to the Crown for charging by police or cleared by means other than the laying of a charge. Rates are calculated on the basis of 100,000 youth aged 12 to 17 in the population.
Violent offences involve the use or threatened use of violence against a person, including homicide, attempted murder, assault, sexual assault and robbery. Robbery is considered a violent offence because, unlike other theft offences, it involves the use or threat of violence.
- Homicide, the most serious of all criminal acts, includes first and
second degree murder, manslaughter and infanticide.
- Assault is classified into three levels: level 1 or common assault, the
least serious form including behaviours such as pushing, slapping,
punching and face-to-face threats; level 2 assault, defined as assault
with a weapon or causing bodily harm; and level 3 aggravated assault,
defined as assault that wounds, maims, disfigures or endangers the
life of the victim.
- Sexual assault is classified into one of three levels according to the seriousness of the incident: level 1, the category of least physical injury to the victim; level 2, sexual assault with a weapon, threats to use a weapon, or causing bodily harm; and level 3, sexual assault that wounds, maims, disfigures or endangers the life of the victim.
Property offences involve unlawful acts to gain property, but do not involve the use or threat of violence against the person. They include offences such as break and enter, theft and fraud.
‘Other’ Criminal Code offences include crimes such as mischief, disturbing the peace, arson, offensive weapon use, bail violations, prostitution and counterfeiting currency.
Drug-related offences include offences under the Controlled Drugs and Substances Act such as importation, exportation, trafficking, production and possession of drugs or narcotics. Examples include cannabis/marijuana, cocaine, heroin, and other drugs such as crystal meth, PCP, LSD and ecstasy.
Data sources
The Uniform Crime Reporting (UCR) Survey
The UCR Survey was developed in 1962 with the cooperation and assistance of the Canadian Association of Chiefs of Police. UCR Survey data reflects reported crime that has been substantiated through police investigation from all separate federal, provincial and municipal police services in Canada. There are currently two versions of the UCR Survey: aggregate and incident-based microdata.
Aggregate UCR Survey
The Aggregate UCR Survey includes the number of reported offences, actual offences, offences cleared by charge or cleared otherwise, persons charged (by sex and by adult/youth breakdown) and those not charged. It does not include victim or incident characteristics. Coverage of the UCR Survey in 2006 was at 99.9% of the caseload of all police services in Canada. Unless otherwise mentioned, all analysis in this report is based on Aggregate Survey counts. The overall “youth crime rate” includes all Criminal Code offences except traffic violations for youth aged 12 to 17. It does not include other federal statutes such as drug offences.
Incident-based Uniform Crime Reporting (UCR2) Survey
The Incident-based UCR2 Survey captures detailed information on individual criminal incidents reported to police, including characteristics of victims, accused persons and incidents. Police services switch over from the Aggregate to the Incident-based Survey as their records management systems become capable of providing this level of detail. Coverage of the UCR2 Survey for 2006 represented 90% of the population in Canada.
The Uniform Crime Reporting (UCR2) Trend Database
The UCR2 Trend Database contains historical data, which permits the analysis of trends in the characteristics of the incidents, accused and victims, such as weapon use and accused-victim relationships. This database currently includes 63 police services in 6 provinces who have supplied data to the UCR2 Survey for the complete years from 1998 to 2006. These respondents accounted for 52.8% of the population of Canada in 2006. This list of respondents will remain unchanged until large police services such as the RCMP and OPP have provided at least five years of data to the UCR2 Survey, at which point they will become part of this Trend Database. The coverage provided by these services in the Trend Database is distributed as follows: 44.1% from Quebec, 38.5% from Ontario, 10.6% from Alberta, 3.4% from British Columbia, 2.6% from Saskatchewan, and 0.7% from New Brunswick.
For more detailed information on the UCR and UCR2 Surveys, please refer to:
/cgi-bin/imdb/p2SV.pl?Function=getSurvey&SDDS=3302&lang=en&db=imdb&adm=8&dis=2.
Homicide Survey
The Homicide Survey collects police-reported data on the characteristics of all homicide incidents, victims and accused persons in Canada.
Detailed data tables
References
AuCoin, Kathy. 2005. “Children and youth as victims of violent crime”. Juristat. Vol. 25, no. 1. Statistics Canada Catalogue no. 85-002-XIE. Ottawa.
Calverley, Donna. 2006. “Youth custody and community services in Canada, 2003/04”. Juristat. Vol. 26, no. 2. Statistics Canada Catalogue no. 85-002-XIE. Ottawa.
Calverley, Donna. 2007. “Youth custody and community services in Canada, 2004/2005”. Juristat. Vol. 27, no. 2. Statistics Canada Catalogue no. 85-002-XIE. Ottawa.
Carrington, Peter and Jennifer Schulenberg. 2005. The Impact
of the Youth Criminal Carrington Act on Police Charging Practices
with Young Persons: A Preliminary Statistical Assessment.
Ottawa: Department of Justice Canada.
http://canada.justice.gc.ca/eng/pi/yj-jj/res-rech/prelimin/s1.html (accessed on April 3, 2008).
Department of Justice Canada. 2003. The Youth Criminal Justice Act: Summary and Background. Ottawa.
http://canada.justice.gc.ca/eng/pi/yj-jj/ycja-lsjpa/back-hist.html (accessed on April 3, 2008).
Gannon, Maire. 2005. General Social Survey on Victimization, Cycle 18: An Overview of Findings. Statistics Canada Catalogue no. 85-565-XIE. Ottawa.
Gannon, Maire. 2006. “Crime statistics in Canada, 2005”. Juristat. Vol. 26, no. 4. Statistics Canada Catalogue no. 85-002-XIE. Ottawa.
Li, Geoff. 2007. “Homicide in Canada, 2006”. Juristat. Vol. 27, no. 8. Statistics Canada Catalogue no. 85-002-XIE. Ottawa.
Savoie, Josée. 1999. “Youth violent crime”. Juristat. Vol. 19, no. 13. Statistics Canada Catalogue no. 85-002-XIE. Ottawa.
Silver, Warren. 2007. “Crime statistics in Canada, 2006”. Juristat. Vol. 27, no. 5. Statistics Canada Catalogue no. 85-002-XIE. Ottawa.
Statistics Canada. 2007. “Youth court statistics, 2005/2006.” The Daily. October 23.
/daily-quotidien/071023/dq071023f-eng.htm (accessed on October 25, 2007).
Stevenson, Kathryn, Jennifer Tufts, Dianne Hendrick and Melanie Kowalski. 1998. A Profile of Youth Justice in Canada. Statistics Canada Catalogue no. 85-544-XPE. Ottawa.
Thomas, Jennifer. 2005. “Youth court statistics, 2003/2004”. Juristat. Vol. 25, no. 4. Statistics Canada Catalogue no. 85-002-XIE. Ottawa.
Endnotes
- Unless otherwise stated, data used in this section come largely from the Aggregate Uniform Crime Reporting (UCR) Survey. For more information see the “Data sources” section of this report.
- Annual changes in youth crime rates for the territories are not presented here, since the territories can have large year-over-year fluctuations due to their relatively small populations.
- Table 1 indicates a total of 85 youth as it includes one accused under the age of 12.
- Data on weapons present in youth crimes in 2006 come from the Incident-based Uniform Crime Reporting (UCR2) Survey which captures detailed information on individual criminal incidents reported to police, including characteristics of victims, accused persons and incidents. Coverage of the UCR2 survey for 2006 represented 90% of the population in Canada. For more information see the “Data sources” section of this report.
- Data on trends in weapons present in youth crimes come from the Uniform Crime Reporting (UCR2) Trend Database. The UCR2 Trend Database currently includes 63 police services in 6 provinces who have supplied data to the UCR2 survey for the complete years from 1998 to 2006. These respondents accounted for 52.8% of the population of Canada in 2006. For more information on the UCR2 Trend Database, see the “Data sources” section of this report.
- The present report provides a general examination of incidents of youth crime where a weapon was present. For information on youth accused of firearm-related violent crimes, please see the Juristat, “Firearms and violent crime” by Mia Dauvergne and Leonardo De Socio (Statistics Canada Catalogue no. 85-002-XIE, Vol. 28, no. 2).
- “Offensive weapons” refers to all weapon-related offences including illegal firearms usage (e.g., using a firearm in the commission of an offence or pointing a firearm); illegal possession of a weapon (e.g., having an unregistered firearm or failing to possess a license to possess a firearm); weapons importation, exportation and trafficking; and other weapon offences (e.g., careless use, illegal destruction of a firearm, tampering with serial numbers).
- Edmonton Police Service, http://www.police.edmonton.ab.ca/Pages\NET\index.asp (accessed April 2, 2008).
- Ontario Provincial Police. 2005. Provincial Business Plan. Drug Enforcement/Traffic.
http://www.opp.ca/Intranetdev/groups/public/documents
/webpage/opp_000690.pdf (accessed April 2, 2008). - With the exception of the data on trends in youth crime at schools, data for this section come largely from the Incident-based Uniform Crime Reporting (UCR2) Survey. Data on trends in youth crime at school come from the Uniform Crime Reporting (UCR2) Trend Database. For more information on the UCR2 Trend Database, please see “Data Sources” section of this report.
- Refers to the Uniform Crime Reporting (UCR2) Trend Database; the UCR2 Trend Database currently includes 63 police services in 6 provinces who have supplied data to the UCR2 Survey for the complete years from 1998 to 2006. These respondents accounted for 52.8% of the population of Canada in 2006. For more information on the UCR2 Trend Database, see the “Data sources” section of this report.
- Ibid.
- Refers to the Aggregate Uniform Crime Reporting (UCR) Survey; see the “Data sources” section of this report for more information.
- Throughout this report the term ‘charged’ is used to refer to incidents where formal charges were laid by police or where the accused has been recommended to the Crown for charging by police.
- Youth handled through ‘other means’ includes such measures as cases where departmental discretion is exercised by police; the complainant declines to lay charges; the accused is under the age of 12; the accused has diplomatic immunity; or the accused is referred to some other type of diversionary program.
- Data on warnings, cautions, community programs, extrajudicial programs and other alternatives to charging used by police come from the Incident-based Uniform Crime Reporting (UCR2) Survey.
- Information on the most serious weapon present during the commission of a criminal incident is collected for crimes involving a violent violation and thus, would not include property offences such as break and enter.
- An incident is “cleared otherwise” when police have identified at least one accused and there is sufficient evidence to lay a charge in connection with the incident, but the accused is processed by other means. In the case of youth, this could include formal measures such as a police caution or extrajudicial sanctions, or informal measures such as a police warning or referral to a community program. Processing by other means could mean that the youth is involved in other incident(s) in which charges have been laid or it could refer to the committal to a mental hospital and death of accused.
- The incarceration rate is the average daily number of young persons in custody per 10,000 youth aged 12 to 17 in the population.
- Sentenced custody includes both open and secure custody. Under the Youth Criminal Justice Act, each province or territory must have at least two levels of custody which are distinguished by the degree of restraint of the young persons within them. For conventional purposes, this Juristat designates the levels of restraint as open and secure custody.