
 StatCan COVID-19: Data to Insights for a Better CanadaTo what extent might COVID-19 affect the earnings of the class of 2020?

Archived Content
Information identified as archived is provided for reference, research or recordkeeping purposes. It is not subject to the Government of Canada Web Standards and has not been altered or updated since it was archived. Please "contact us" to request a format other than those available.
The COVID-19 pandemic has already resulted in a considerable slowdown in economic activity in Canada. Young people have been hit particularly hard, as the unemployment rate for youth (15 to 24 year-olds) rose from 10.3% in February to a monthly historical high of 29.4% in May.Note For high school and postsecondary graduates planning on entering the labour market shortly, this could have important repercussions for their earnings, both in the short and long term. This article presents estimates of the cumulative earnings losses in the first five years after graduation that this year’s graduating class could experience, depending on the depth of the economic downturn. Specifically, five scenarios for this year’s youth unemployment rate are examined: 16.0%, 19.0%, 22.0%, 25.0%, and 28.0%.Note Other factors may impact the earnings of graduates, but these are not considered in this article. The estimated earnings losses are based on the historical association between youth unemployment rates during the year of graduation and graduate earnings over the following years.Note
This year’s class of high school, college, and bachelor’s degree graduates could lose $25,000 or more over the next five years if this year’s annual youth unemployment hits 28.0%. Potential losses under this scenario range from about $23,000 to $44,000, depending on the sex and education level (see Chart 1, 2, and 3).
Although such losses are at least as large as the average debt load of postsecondary graduatesNote , they are quite small compared to the estimated benefit of graduating with a postsecondary qualificationNote .
Moreover, an annual youth unemployment rate of 28.0% would top the previous high of 19.2% set in 1983 by 8.8 percentage points (i.e. by 45.8%). If instead this year’s youth unemployment rate roughly matches the historical high at 19.0%, earnings losses are likely to be far more moderate. In general, potential losses under this scenario, could range from about $8,000 to $15,000 (Chart 1, 2, and 3). Under a scenario where the youth labour market recovers very quickly (i.e. the youth unemployment rate will be 16.0% this year), five year losses could be less than $6,000 for all groups, or less than $1,200 per year (Chart 1, 2, and 3).
Earnings losses could be somewhat higher for women than for men, as well as for high school graduates than for postsecondary graduates. This is especially true when the dollar value of the earnings losses are expressed as a share of earnings (Chart 1, 2, and 3).
The study examines only the portion of earnings losses that may be caused by the COVID-related economic downturn. It is important to note that the COVID-19 labour market downturn may be less predictable than traditional economic downturns, and thus, graduate labour market outcomes may be governed by several atypical factors. For instance, successive waves of the COVID-19 virus may dictate how the economy recovers since there is a possibility of subsequent shutdowns. Additionally, it is still not known when or if there will be a successful vaccine or treatment, and how effective workplaces will be at adapting to the pandemic environment. These factors may influence graduate outcomes as well, and no attempt is made to try to incorporate them in the analysis.
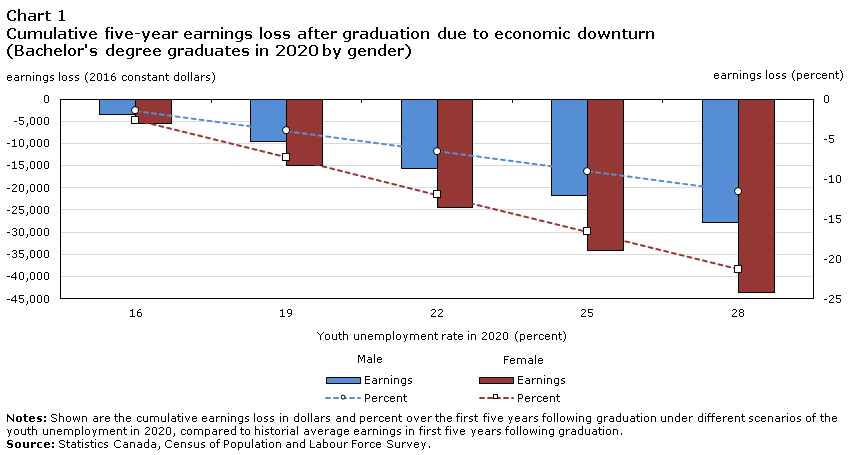
Data table for Chart 1
| Youth unemployment rate in 2020 (percent) | Men | Women | Men | Women |
|---|---|---|---|---|
| earnings loss (2016 constant dollars) | earnings loss (percent) | |||
| 16 | -3,491 | -5,467 | -1.45 | -2.67 |
| 19 | -9,590 | -15,019 | -3.98 | -7.32 |
| 22 | -15,689 | -24,570 | -6.52 | -11.98 |
| 25 | -21,788 | -34,122 | -9.05 | -16.64 |
| 28 | -27,887 | -43,674 | -11.58 | -21.30 |
|
Note: Shown are the cumulative earnings loss in dollars and percent over the first five years following graduation under different scenarios of the youth unemployment in 2020, compared to historial average earnings in first five years following graduation. Source: Statistics Canada, Census of Population and Labour Force Survey. |
||||
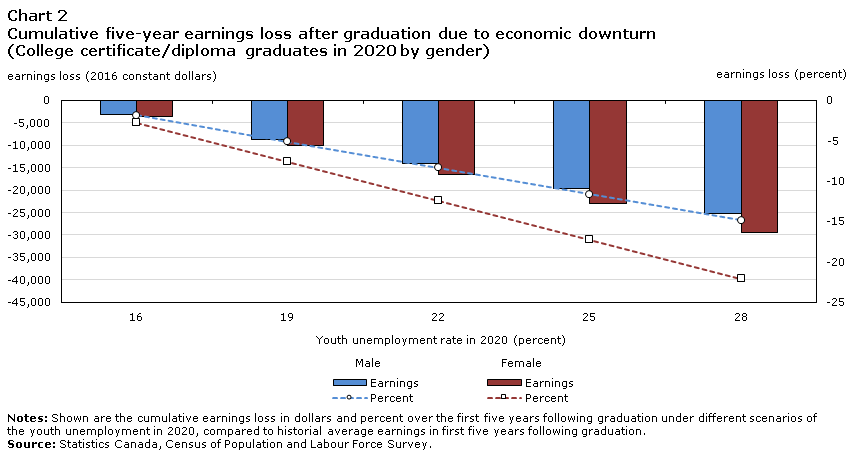
Data table for Chart 2
| Youth unemployment rate in 2020 (percent) |
Men | Women | Men | Women |
|---|---|---|---|---|
| earnings loss (2016 constant dollars) | earnings loss (percent) | |||
| 16 | -3,154 | -3,692 | -1.86 | -2.76 |
| 19 | -8,665 | -10,141 | -5.11 | -7.59 |
| 22 | -14,176 | -16,591 | -8.36 | -12.42 |
| 25 | -19,686 | -23,041 | -11.62 | -17.25 |
| 28 | -25,197 | -29,491 | -14.87 | -22.08 |
|
Note: Shown are the cumulative earnings loss in dollars and percent over the first five years following graduation under different scenarios of the youth unemployment in 2020, compared to historial average earnings in first five years following graduation. Source: Statistics Canada, Census of Population and Labour Force Survey. |
||||
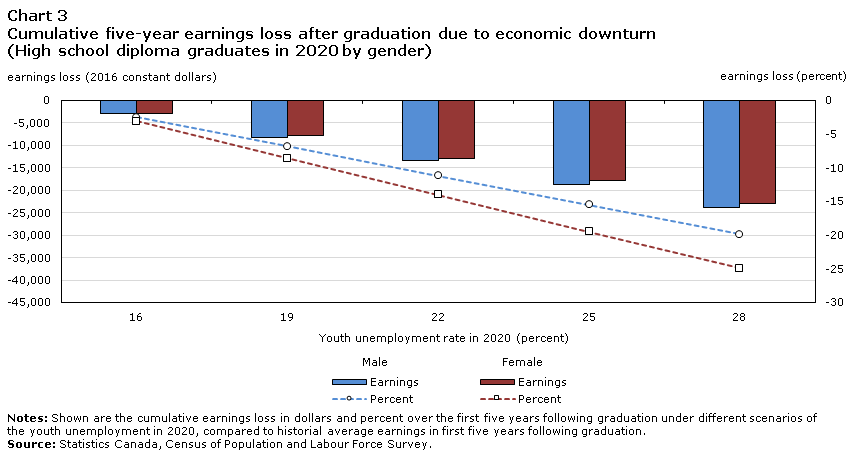
Data table for Chart 3
| Youth unemployment rate in 2020 (percent) | Men | Women | Men | Women |
|---|---|---|---|---|
| earnings loss (2016 constant dollars) | earnings loss (percent) | |||
| 16 | -2,987 | -2,870 | -2.49 | -3.12 |
| 19 | -8,204 | -7,883 | -6.84 | -8.57 |
| 22 | -13,422 | -12,896 | -11.18 | -14.02 |
| 25 | -18,640 | -17,910 | -15.53 | -19.48 |
| 28 | -23,857 | -22,923 | -19.88 | -24.93 |
|
Note: Shown are the cumulative earnings loss in dollars and percent over the first five years following graduation under different scenarios of the youth unemployment in 2020, compared to historial average earnings in first five years following graduation. Source: Statistics Canada, Census of Population and Labour Force Survey. |
||||
References
Frenette, M., D. Messacar, and T. Handler. 2020. “Potential Earnings Losses among High School and Postsecondary Graduates Due to the COVID-19 Economic Downturn.” Economic Insights. Statistics Canada Catalogue no. 11-626-X. Ottawa: Statistics Canada.
Frenette, M. 2019. Are the Career Prospects of Postsecondary Graduates Improving? Analytical Studies Branch Research Paper Series, Catalogue no. 11F0019M no. 415. Ottawa: Statistics Canada.
- Date modified: