
Environment Fact Sheets
Source water quality, 2013

Archived Content
Information identified as archived is provided for reference, research or recordkeeping purposes. It is not subject to the Government of Canada Web Standards and has not been altered or updated since it was archived. Please "contact us" to request a format other than those available.
In 2013, drinking water plants in Canada produced 4,457 million cubic metres of potable water from surface water sources. Overall, nearly three quarters of the Canadian population received drinking water from plants using surface water sources such as rivers, lakes and reservoirs.
Water quality monitoring of the raw source water is performed by drinking water plant operations to assess the water quality and to ensure appropriate treatments for drinking water. It also helps establish trends in order to characterize changing water quality and ecosystem conditions at the source water site.
Escherichia coli (E. Coli) colonies in surface water sources (median monthly values)
The presence of Escherichia coli in source water is an indicator of recent faecal contamination and indicates an increased potential for the presence of other microbial pathogens that have the potential to cause disease or illness.Note 1
Elimination of E. coli is the objective of the primary disinfection processes applied at treatment plants. Secondary disinfection processes are also applied to maintain a disinfectant “residual” throughout the distribution system to avoid recontamination before water reaches the final user. Chlorination, which can be used for both primary and secondary disinfection, was applied to 96% of the surface water processed by drinking water plants in 2013. Ultraviolet irradiation and ozonation, which are effective for primary disinfection only, were applied to 22% and 25% of treated surface water respectively.
Seasonal changes of E. coli colonies in raw surface water sources are shown in Chart 1. The data indicates levels peak towards the fall with 2013 levels highest in September and in October during 2011.
Description for Chart 1
The title of the graph is "Chart 1 Median values of monthly quantity of Escherichia coli in raw surface water sources, MPN/100mL or CFU/100mL, 2011 and 2013."
This is a line chart.
There are in total 12 categories in the horizontal axis. The vertical axis starts at 0 and ends at 12 with ticks every 2 points.
There are 6 series in this graph.
The vertical axis is "colonies per 100 mL."
The horizontal axis is "Month."
The title of series 1 is "2013 maximum E. coli."
The minimum value is 1 and it corresponds to "Feb and Mar."
The maximum value is 10 and it corresponds to "Sep."
The title of series 2 is "2013 average E. coli."
The minimum value is 1 and it corresponds to "Jan, Feb, Mar and Apr."
The maximum value is 5 and it corresponds to "Sep."
The title of series 3 is "2013 minimum E. coli."
The minimum value is 0 and it corresponds to "Jan, Feb, Mar, Apr, May, Jul and Dec."
The maximum value is 1 and it corresponds to "Jun, Aug, Sep, Oct and Nov."
The title of series 4 is "2011 maximum E. coli."
The minimum value is 1 and it corresponds to "Feb."
The maximum value is 10 and it corresponds to "Oct."
The title of series 5 is "2011 average E. coli."
The minimum value is 1 and it corresponds to "Jan and Feb."
The maximum value is 3.9 and it corresponds to "Oct."
The title of series 6 is "2011 minimum E. coli."
The minimum value is 0 and it corresponds to "Jan, Feb, Mar, Apr, May, Jun, Jul, Sep, Nov and Dec."
The maximum value is 1 and it corresponds to "Oct."
| Month | 2011 minimum E. coli | 2011 average E. coli | 2011 maximum E. coli | 2013 minimum E. coli | 2013 average E. coli | 2013 maximum E. coli |
|---|---|---|---|---|---|---|
| Jan | 0.0 | 1.0 | 2.0 | 0.0 | 1.0 | 2.0 |
| Feb | 0.0 | 1.0 | 1.0 | 0.0 | 1.0 | 1.0 |
| Mar | 0.0 | 1.5 | 3.1 | 0.0 | 1.0 | 1.0 |
| Apr | 0.0 | 1.2 | 3.0 | 0.0 | 1.0 | 2.0 |
| May | 0.0 | 1.4 | 3.6 | 0.0 | 1.5 | 3.0 |
| Jun | 0.0 | 1.8 | 3.6 | 1.0 | 2.0 | 4.0 |
| Jul | 0.0 | 1.9 | 4.0 | 0.0 | 2.1 | 6.3 |
| Aug | 0.8 | 3.6 | 7.5 | 1.0 | 3.0 | 6.0 |
| Sep | 0.0 | 2.6 | 7.0 | 1.0 | 5.0 | 10.0 |
| Oct | 1.0 | 3.9 | 10.0 | 1.0 | 3.8 | 8.0 |
| Nov | 0.0 | 1.5 | 3.0 | 1.0 | 3.0 | 7.0 |
| Dec | 0.0 | 1.6 | 4.0 | 0.0 | 1.2 | 3.0 |
|
Note: The data in Chart 2 are from facilities that reported E. coli data for at least 10 months in both 2011 and 2013. These facilities serving 18 million people produced 3049 Mm3 of potable water from surface water sources in 2013. E. coli in source water was monitored at least daily at 2% of these drinking water plants in 2013, was monitored at least weekly at 68% of plants and was less frequent at the rest. Source: Statistics Canada, 2015, Environment, Energy and Transportation Statistics Division, Survey of Drinking Water Plants (survey number 5149). |
||||||
Start of text box
Two methods routinely used to quantify E. coli organisms in water are membrane filtration, which measures colony forming units (CFUs) per 100 millilitres (mL) and multiple tube fermentation, which measures the most probable number (MPN) per 100 mL. Since survey respondents did not use the same method when analysing source water quality, both quantitative test methods are pooled together in Chart 1. According to Standard Methods for the Examination of Water and Wastewater, the membrane filter test is more precise; however data from each test yield approximately the same water quality information.Note 2
End of text box
Turbidity of surface water sources (median monthly values)
Turbidity refers to the relative cloudiness of water which is caused by suspended particles in the water and is measured as nephelometric turbidity units (NTU) by the scattering and absorbing effect that suspended particles have on light. Turbidity tends to be highest during spring runoff and can be attributed to inorganic silts, metallic precipitates as well as organic plant or animal debris and microorganisms in the water.Note 3
Source water turbidity data are used by treatment plant operators to identify changing source water conditions that may increase challenges to filtration and disinfection. These data establish historic trends concerning source water conditions and are used to ensure the appropriate design and operation of the treatment plant.Note 4
Chart 2 shows monthly turbidity levels of source water in Canada for 2011 and 2013. In both years median monthly turbidity peaked in the spring (May) and was higher in 2011 than in 2013.
Description for Chart 2
The title of the graph is "Chart 2 Median values of monthly turbidity of raw surface water sources, 2011 and 2013."
This is a line chart.
There are in total 12 categories in the horizontal axis. The vertical axis starts at 0 and ends at 9 with ticks every 1 points.
There are 6 series in this graph.
The vertical axis is "Turbidity (NTU)."
The horizontal axis is "Month."
The title of series 1 is "2013 maximum turbidity."
The minimum value is 3.3 and it corresponds to "Feb and Dec."
The maximum value is 6.7 and it corresponds to "May."
The title of series 2 is "2013 average turbidity."
The minimum value is 1.3 and it corresponds to "Feb and Mar."
The maximum value is 2.3 and it corresponds to "May."
The title of series 3 is "2013 minimum turbidity."
The minimum value is 0.7 and it corresponds to "Jan and Feb."
The maximum value is 1 and it corresponds to "Jun and Aug."
The title of series 4 is "2011 maximum turbidity."
The minimum value is 2.9 and it corresponds to "Feb."
The maximum value is 8.5 and it corresponds to "May."
The title of series 5 is "2011 average turbidity."
The minimum value is 1.2 and it corresponds to "Feb."
The maximum value is 2.7 and it corresponds to "May."
The title of series 6 is "2011 minimum turbidity."
The minimum value is 0.7 and it corresponds to "Jan, Feb and Mar."
The maximum value is 1.2 and it corresponds to "May."
| Month | 2011 minimum turbidity | 2011 average turbidity | 2011 maximum turbidity | 2013 minimum turbidity | 2013 average turbidity | 2013 maximum turbidity |
|---|---|---|---|---|---|---|
| Jan | 0.7 | 1.3 | 3.3 | 0.7 | 1.5 | 3.4 |
| Feb | 0.7 | 1.2 | 2.9 | 0.7 | 1.3 | 3.3 |
| Mar | 0.7 | 1.6 | 3.8 | 0.8 | 1.3 | 3.8 |
| Apr | 0.9 | 2.2 | 6.7 | 0.8 | 2.0 | 5.9 |
| May | 1.2 | 2.7 | 8.5 | 0.9 | 2.3 | 6.7 |
| Jun | 1.1 | 2.3 | 7.2 | 1.0 | 2.2 | 5.9 |
| Jul | 0.9 | 2.1 | 6.5 | 0.9 | 2.2 | 5.8 |
| Aug | 1.0 | 2.3 | 6.0 | 1.0 | 1.9 | 4.6 |
| Sep | 1.0 | 2.0 | 5.3 | 0.9 | 1.8 | 4.8 |
| Oct | 1.0 | 2.2 | 6.2 | 0.9 | 1.8 | 4.5 |
| Nov | 0.9 | 1.8 | 5.0 | 0.9 | 2.1 | 5.1 |
| Dec | 0.9 | 1.8 | 4.0 | 0.8 | 1.4 | 3.3 |
|
Note: The data in Chart 3 are from facilities that reported turbidity data for at least 10 months in both 2011 and 2013. These facilities serving 22 million people produced 3,743 Mm3 of potable water from surface water sources in 2013. Source water turbidity was monitored continuously at 43% of these drinking water plants in 2013, was monitored at least daily at 36% of plants and was less frequent at the rest. Source: Statistics Canada, 2015, Environment, Energy and Transportation Statistics Division, Survey of Drinking Water Plants (survey number 5149). |
||||||
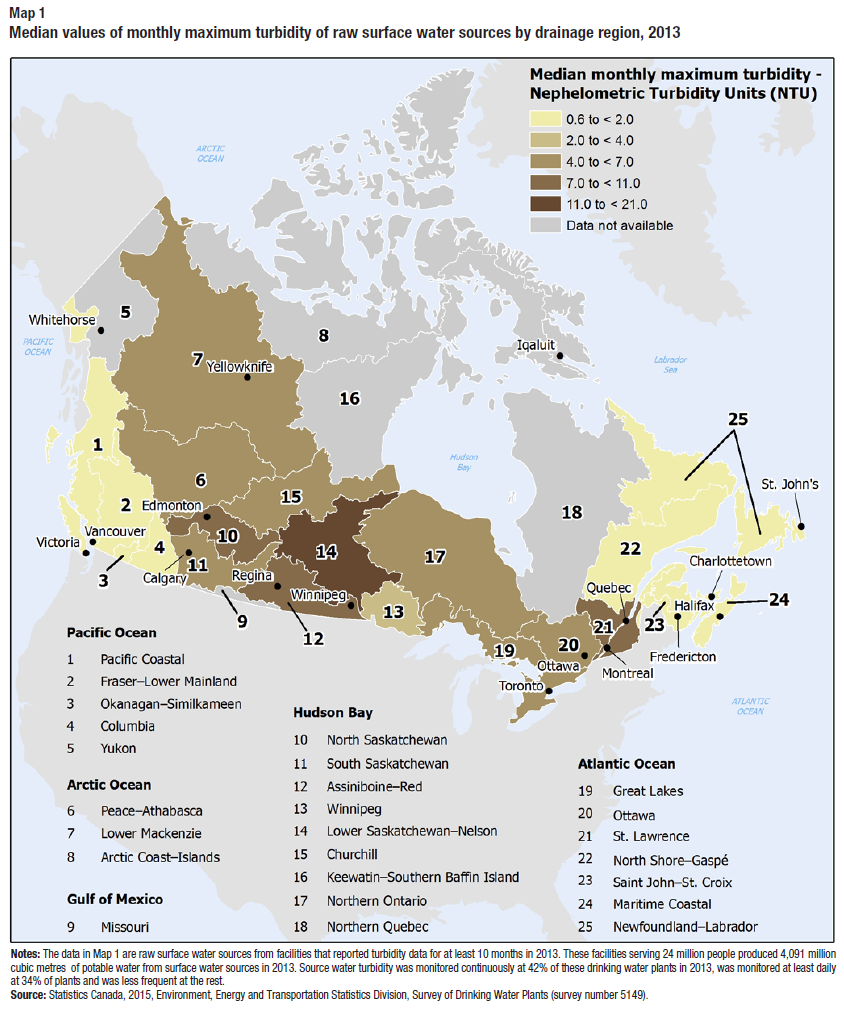
Map 1 presents the 2013 median values of monthly maximum turbidity for raw surface water sources by drainage region from plants that reported data for at least 10 months of the year. The turbidity of source water tended to be highest in Western-Central Canada and the St. Lawrence drainage region and lowest on the West and East Coasts. Surface water sources in the Assiniboine–Red (12), the North Saskatchewan (10), Lower Saskatchewan–Nelson (14) and the St. Lawrence (21) drainage regions had the highest median maximum turbidity, in the range of 7.0 to 21.0 NTU in 2013. Results were similar for 2011.Note 5
Description for Map 1
The title of this choropleth map is "Median values of monthly maximum turbidity in raw surface water sources by drainage region, 2013". On this map, there is a range of colours used to display numeric ranges, the lightest being cream and the darkest being dark brown. The darker the colour, the greater the median monthly maximum turbidity value for the 25 drainage regions (DRs). Turbidity is measured in nephelometric turbidity units (NTU). Category 1 is coloured cream and represents a turbidity value between 0.6 and less than 2.0 NTU; it comprises 8 DRs. Category 2 is coloured sand and represents a turbidity value between 2.0 and less than 4.0 NTU; it comprises 1 DR. Category 3 is coloured tan and represents a turbidity value between 4.0 and less than 7.0 NTU; it comprises 7 DRs. Category 4 is coloured medium brown and represents a turbidity value between 7.0 and less than 11.0; it comprises 3 DRs. Category 5 is coloured dark brown and represents a turbidity value between 11.0 and 21.0; it comprises 1 DRs. Category 6 is coloured grey and indicates that data is not available; it comprises 5 DRs. The boundaries between the DRs are indicated with thin white lines. Oceans and lakes are coloured pale blue. Land areas outside of Canada are coloured pale grey.
Note: The data in Map 1 are raw surface water sources from facilities that reported turbidity data for at least 10 months in 2013. These facilities serving 24 million people produced 4,091 million cubic metres of potable water from surface water sources in 2013. Source water turbidity was monitored continuously at 42% of these drinking water plants in 2013, was monitored at least daily at 34% of plants and was less frequent at the rest.
Source: Statistics Canada, 2015, Environment, Energy and Transportation Statistics Division, Survey of Drinking Water Plants (survey number 5149).
| Drainage region | Median monthly maximum turbidity | Category | |
|---|---|---|---|
| code | nephelometric turbidity units (NTU) | number | |
| Pacific Coastal | 1 | 0.94 | 1 |
| Fraser–Lower Mainland | 2 | 1.41 | 1 |
| Okanagan–Similkameen | 3 | 1.35 | 1 |
| Columbia | 4 | 0.68 | 1 |
| Yukon | 5 | Note ..: not available for a specific reference period | 6 |
| Peace–Athabasca | 6 | 5.02 | 3 |
| Lower Mackenzie | 7 | 4.58 | 3 |
| Arctic Coast–Islands | 8 | Note F: too unreliable to be published | 6 |
| Missouri | 9 | Note F: too unreliable to be published | 6 |
| North Saskatchewan | 10 | 8.99 | 4 |
| South Saskatchewan | 11 | 6.32 | 3 |
| Assiniboine–Red | 12 | 7.68 | 4 |
| Winnipeg | 13 | 2.37 | 2 |
| Lower Saskatchewan–Nelson | 14 | 20.9 | 5 |
| Churchill | 15 | 4.45 | 3 |
| Keewatin–Southern Baffin Island | 16 | Note F: too unreliable to be published | 6 |
| Northern Ontario | 17 | 4.93 | 3 |
| Northern Quebec | 18 | Note ..: not available for a specific reference period | 6 |
| Great Lakes | 19 | 5.00 | 3 |
| Ottawa | 20 | 4.10 | 3 |
| St. Lawrence | 21 | 9.82 | 4 |
| North Shore–Gaspé | 22 | 1.51 | 1 |
| Saint John–St. Croix | 23 | 1.05 | 1 |
| Maritime Coastal | 24 | 1.44 | 1 |
| Newfoundland–Labrador | 25 | 0.71 | 1 |
|
.. not available for a specific reference period F too unreliable to be published Note: Values were rounded to two decimal places. F denotes that there were too few respondents to calculate a reliable median. |
|||
Treatment of surface water sources
In 2013 nearly two thirds (63%) of the surface source water was disinfected and treated by conventional and direct filtration plants. Conventional filtration processes include coagulation, flocculation, sedimentation and granular filtration. Direct filtration processes are similar but exclude sedimentation processes and are typically limited to source water with turbidity below 15 NTU.Note 6 Membrane filtration systems treated 10% of the surface water and 14% was treated by other filtration systems. Drinking water plants using unfiltered systems that disinfect only, or disinfect and use other non-filtration processes, treated the remaining 13% of surface water.
Start of text box
The Survey of Drinking Water Plants collected data on several water quality parameters to provide information about the quality of source water used by drinking water plants in Canada. The data analysed are from plants using 90% or more surface water. The data represent source water quality in the environment before treatment and not final drinking water quality. Source water quality results presented in this report are based on reported data only. No editing or imputation was made to account for non-response. The results are based on the plants that reported data for the given parameter and apply only to the water processed and the population served by those plants. In some cases, there are no results for certain drainage regions due to low response for the given parameter in that area.
“Median maximum” refers to the median of all the maximum values reported for a particular source water quality parameter.
“Median average” refers to the median of all the average values reported for a particular source water quality parameter.
“Median minimum” refers to the median of all the minimum values reported for a particular source water quality parameter.
End of text box
Start of text box
The Survey of Drinking Water Plants is a census of drinking water plants serving 300 or more people, and asks for information on volumes of water treated, type of treatment, financial aspects of the operation, as well as raw (source) water quality. The survey results produce a national portrait of treatment processes and costs, and source water quality across Canada. The survey compiles monthly source/raw water quality data for temperature, Escherichia coli and turbidity collected by treatment plant operations to establish how these parameters and the quality of the raw untreated surface water sources vary spatially and seasonally in Canada. This analysis of the survey data for 2011 and 2013 demonstrates how existing monitoring data from drinking water plant operations can be compiled to build a national database of source water quality for surface water sites across Canada.
The Survey of Drinking Water Plants is part of a suite of water surveys that collect data integrated into a water account to provide a national perspective on water use and contribute to the Canadian Environmental Sustainability Indicators (CESI). The survey utilizes information obtained from the network of water utilities to build water accounts that describe the quality of the stocks of water resources defined for a specific concern, in this case surface water sources for drinking water.
More information about the survey can be found at the following links: http://www.statcan.gc.ca/daily-quotidien/150619/dq150619d-eng.htm
End of text box
Start of text box
Definitions, data sources and methods: survey number 5149
For more information, or to enquire about the concepts, methods or data quality of this release, contact us (toll-free 1-800-263-1136; 514-283-8300; STATCAN.infostats-infostats.STATCAN@canada.ca or Media Relations (613-951-4636; statcan.mediahotline-ligneinfomedias.statcan@canada.ca).
Related topics: Canadian Nature Survey, Environment Canada. [http://ec.gc.ca/Publications/default.asp?lang=En&xml=BF2EC39D-1124-42BA-85B2-52B24A13CFEA]
End of text box
- Date modified: