
User Guide: Canadian System of Macroeconomic Accounts
Chapter 2 History of Canada’s macroeconomic accounts
What this chapter seeks to do
The chapter offers an historical summary of the evolution of the international System of National Accounts (SNA) since 1947 and of the development of the Canadian System of Macroeconomic Accounts (CSMA) since the early 1900s.
2.1 Introduction
The history of the international System of National Accounts extends through the 20th century and into the 21st, culminating with the release of SNA 2008. Canada’s national accounts have emerged, developed and grown over the same period. This chapter tells the story, first, of the evolution of the international SNA standard and then of Canada’s progress through time in implementing and contributing to the development of that evolving standard.
The elaboration and improvement of the international standard is marked by the publication of manuals at a number of points in time. At first these manuals were issued by the United Nations and later they were published jointly by several international organizations, including the United Nations. The historical account in this chapter is drawn mostly from those manuals, which are cited at the appropriate points in the narrative.
The history of Canada’s efforts to develop and improve its national accounts is well recounted in a book by Professor Duncan McDowall entitled The Sum of the Satisfactions: Canada in the Age of National Accounting.Note 1 The historical account in the present chapter draws heavily from the story in that volume, especially for the earlier years of the chronicle. Readers looking for a fuller treatment of the subject are encouraged to read McDowall’s book.Note 2
Readers unfamiliar with the national accounts may find this chapter difficult as it uses terminology and refers to concepts not yet explained. For this reason, some may wish to skip over this chapter and come back to it after reading the other chapters.
2.2 The development of the international SNA
The post-war development of the international SNA is summarized in Table 2.1.Note 3
| Year | System of National Accounts version |
|---|---|
| 1947 | The origins of the SNA trace back to the 1947 Report of the Sub-Committee on National Income Statistics of the League of Nations Committee of Statistical Experts under the leadership of Richard Stone. At its first session in 1947, the United Nations Statistical Commission (UNSC) emphasized the need for international statistical standards for the compilation and updating of comparable statistics in support of a large array of policy needs. In view of the emphasis on international statistical standards throughout the history of the Commission, the following national accounts standards were produced. |
| 1953 | The 1953 SNA was published under the auspices of the UNSC. It consisted of a set of six standard accounts and a set of 12 standard tables presenting detail and alternative classifications of the flows in the economy. The concepts and definitions of the accounts were widely applicable for most countries, including developing countries. Two slightly modified editions of the 1953 SNA were published. |
| 1960 | The first revision in 1960 reflected comments on country experience in the implementation of the 1953 SNA. |
| 1964 | The second revision in 1964 improved consistency with the International Monetary Fund's Balance of Payments Manual. |
| 1968 | The 1968 SNA extended the scope of the national accounts substantially by adding input-output accounts and balance sheets; giving more attention to estimates at constant prices; and making a comprehensive effort to bring the SNA and the Material Product System (MPS)Note 1 closer together. |
| 1993 | The 1993 SNA represents a major advance in national accounting and embodies the result of harmonizing the SNA and other international statistical standards more completely than in previous versions. |
| 2008 | The 2008 SNA, which is an update of the 1993 SNA, addresses issues brought about by changes in the economic environment, advances in methodological research and the needs of users. |
|
|
2.2.1 The 1947 System of National Accounts
The beginnings of the international standard for national accounting can be traced back to a reportNote 4 published in Geneva in 1947 by the Sub-Committee on National Income Statistics of the League of Nations Committee of Statistical Experts, under the leadership of Richard Stone from the United Kingdom. Claude Isbister from Statistics Canada and Agatha Chapman from the Bank of Canada participated in the discussions as did statisticians from the United Kingdom, Australia, the Netherlands, the United States, Mexico, Norway and Switzerland. The Committee of Statistical Experts had decided to focus on the measurement of national income at a meeting in April 1939, but work had been suspended following the outbreak of war later that year and was not resumed until 1945.
The system put forward in this report was referred to as a ‘system of social accounts’. It revolved around transactions conducted by and recorded for five institutional sectors, which were:
- Productive enterprises
- Financial intermediaries
- Insurance and social security agencies
- Final consumers and
- Rest of the world.
Institutional units that today are included in the ‘general government’ and ‘non-profit institutions serving households’ sectors were spread among the other sectors, although they were located primarily alongside final consumers since a large portion of their expenditures were focused on individual and collective final consumption.
There were nine summary tables in the recommended system with the following titles:
- Personal income and outlay
- Relation between personal income and national income
- National income, net product and expenditure
- Income payments
- Relation between national income and gross national product
- Expenditure classification of the gross national product
- Saving, capital formation and net lending to the rest of the world
- Combined operating account of enterprises of all kinds
- Consolidated account of social security funds and public collective providers
In addition, each institutional sector had its own ‘operating’, ‘appropriation’, ‘capital’ and ‘reserve’ accounts, wherein receipts were balanced against payments. The tables bear striking similarities to tables in the modern SNA, although there are also many dissimilarities.
Three types of statistical classifications were highlighted, those being:
- Classification of ‘branches of economic activity’ (agriculture, mining, etcetera)
- Classification of ‘products bought’ (for consumer expenditure and capital formation)
- Classification of ‘public expenditure by purpose’ (education, public health, defence, etcetera).
These classifications remain prominent in today’s SNA, although of course they have been considerably developed and refined over the past seven decades.
2.2.2 The System of National Accounts of 1953, 1960 and 1964
The first formal revision of the SNA came in 1953Note 5 and it took advantage of the practical experience gained by countries working to implement the approach recommended in 1947. The revised standard was developed by a group of country experts led again by Richard Stone of the United Kingdom.
The concept of the institutional sectors in this revised standard consisted of four sectors: (i) persons and private non-profit institutions serving households, (ii) enterprises including both incorporated and unincorporated businesses, public enterprises, non-profit institutions serving enterprises, and households in their capacity as landlords renting dwellings to themselves or others, (iii) general government and (iv) non-residents. This sectoring is more similar to the modern one, the most important remaining difference being that unincorporated enterprises were grouped with incorporated ones whereas today unincorporated enterprises are combined with households.Note 6
Six basic accounts were identified:
- Domestic product
- National income
- Domestic capital formation
- Households and private non-profit institutions
- General government
- External transactions (rest of the world account)
and twelve standard tables were presented:
- Expenditure on gross national product
- Industrial origin of gross domestic product at factor cost
- National income by type of organization
- Distribution of national income
- The finance of gross domestic capital formation
- Composition of gross domestic capital formation
- Receipts and expenditures of households and private non-profit institutions
- Composition of private consumption expenditures
- General government revenue and expenditure
- Composition of general government consumption expenditure
- External transactions
- Receipts and disbursements of the rural sector.
The last of these tables was intended to be of special relevance to under-developed countries where rural areas are often self-contained with non-monetary transactions playing an important role, but the table was dropped in subsequent SNA revisions.
The system was more clearly set out than its 1947 predecessor, particularly with respect to the accounts for capital formation. The income, outlay and accumulation accounts were well presented. However it continued to be more a ‘set of tables’ than a complete system since opening and closing balance sheets were not included. In addition, it still did not contain flow of funds or supply and use accounts and there was little discussion of the price-volume decomposition of product aggregates.
The 1953 standard was slightly revised in 1960 and again in 1964.Note 7
2.2.3 The 1968 System of National Accounts
Once again, Richard Stone chaired the sessions leading up to the release of the 1968 SNA.Note 8 The 1953 standard and its amended updates in 1960 and 1964 were acknowledged, when they were first released, to be incomplete in a number of respects and the 1968 SNA aimed to complete the accounting standard in these areas.
A major advance in this version of the system was the introduction of opening and closing asset and liability stocks. This completed the system by articulating the flow from opening stocks to production, to consumption and accumulation, to revaluations and finally to closing stock levels. Another major change was the introduction of supply and use accounts to show how production is broken down by industry and product class and supply of products is balanced against their use. The system provided a basis for input-output analysis, including a full chapter on this subject. Also brought into the revised system were rudimentary flow of funds accounts. In addition, a full chapter was devoted to the topic of constant-price statistics with respect to the supply and disposition of goods and services. Regional accounting and integrated research and development statistics were flagged as topics to be addressed in the future.
2.2.4 The 1993 System of National Accounts
The development of the SNA from 1947 to 1968 and in the years immediately thereafter was led by the United Nations. However, beginning in the early 1980s responsibility for the leadership of the international SNA was shared by a five-party group of institutions known as the Inter-Secretariat Working Group on National Accounts (ISWGNA). The group included: the United Nations, the International Monetary Fund, the Organization for Economic Co-operation and Development, the World Bank and the Commission of the European Communities (Eurostat). This group organized the international discussions and drafting work leading up to the release of the SNA standard in 1993.Note 9 It was associated with an Advisory Expert Group (AEG) with representatives from a wide range of countries including CanadaNote 10 that met with ISWGNA for deliberations on numerous occasions in the years leading up to the publication of SNA 1993.
There were a great many improvements to the system in SNA 1993. The document has 814 pages, more than three times the length of SNA 1968. The changes introduced in this revision are well summarized in Annex I: Changes from the 1968 System of Accounts,Note 11 which highlights the modifications under nine headings:
- Revision of the accounting structure and new balancing items
- Further specifications of statistical units, revisions in the sectoring and introduction of multiple sub-sectoring
- Further specifications of the scope of transactions including the production boundary
- Changes in valuation and in the treatment of product taxes
- Distinction between market and other kinds of production and introduction of alternative concepts of consumption and disposable income
- Extension and further specification of the concepts of assets, capital formation and consumption of fixed capital
- Further refinement of the treatment and definition of financial instruments and assets
- Harmonization between concepts and classifications of the 1993 SNA and the fifth edition of the Balance of Payments Manual
- Price and volume measures and introduction of real income measures
Broadly speaking, the revised standard represents continuity with the previous one, SNA 1968. Its focus is primarily on clarification of concepts and harmonization of the system with other international statistical standards. “It more fully integrates production, income, capital and financial accounts and balance sheets … Furthermore, the new System describes in detail the links between the SNA and the related statistical system on balance of payments prepared by the International Monetary Fund. Particular attention has been given to the delineation of the production boundary with regard to coverage of own-account production of goods and services. Also, more precise criteria have been established for the delineation and coverage of the financial sector and identification and classification of financial instruments in light of the many innovations in this field in recent years due to financial deregulation. The central framework retains input-output tables as an integral part of the System particularly as the basis for balancing supply and demand.”Note 12 It also introduces some new features, notably the notion of ‘satellite accounts’. Finally, one additional feature to note is that unlike previous editions, SNA 1993 can be used for all types of economies—from developing to developed and from capitalist to communist.
2.2.5 The 2008 System of National Accounts
The 2008 SNANote 13 was developed under an organizational structure similar to that of the 1993 SNA. It was led by ISWGNA and an Advisory Expert Group.Note 14 The changes it introduced into the standard were less extensive, on the whole, than those introduced in SNA 1993. At 662 pages, it is a substantial volume, although almost a fifth shorter than its predecessor. This international standard remains in effect today.
Annex 3Note 15 of the SNA 2008 volume summarizes the changes that were made relative to SNA 1993. The following are the headings from that annex encapsulating the numerous changes:
- Further specifications of statistical units and revisions in institutional sectoring
- Further specifications of the scope of transactions including the production boundary
- Extension and further specification of the concepts of assets, capital formation and consumption of fixed capital
- Further refinement of the treatment and definition of financial instruments and assets
- Further specifications of the scope of transactions concerning government and the public sector
- Harmonization between concepts and classifications of the SNA and the sixth edition of the Balance of Payments Manual
In general terms “… the 2008 SNA introduces treatments for new aspects of economies that have come into prominence, elaborates on aspects that have increasingly become the focus of analytical attention and clarifies guidance on a wide range of issues.”Note 16 One striking change is that research and development is no longer regarded as intermediate consumption, but rather is treated as gross capital formation within a new ‘intellectual property products’ category. Expenditures on weapons systems are also recognized as produced capital formation. Another change is that the output of non-life insurance companies is to be measured using adjusted claims rather than accrued claims and for extraordinary claims, as may arise from a natural disaster, the claims can be recorded as capital transfers rather than current transfers. For defined benefit pension schemes, the level of the employer’s contribution is to be determined by assessing the increase in the net present value of the pension entitlement the employee has earned, rather than the actual monetary contribution. When goods are sent across borders for processing, imports and exports are to be recorded on a strict change of ownership basis, implying that processing is regarded as a service rather than as a good.
SNA 2008 is a highly developed and quite sophisticated statistical standard. It represents the cumulative experience and contributions of a large number of bright economists and statisticians from many countries stretched over some 60 years. It is almost universally accepted by governments and their statistical agencies around the world and provides a solid basis for internationally comparable macroeconomic statistics.
2.3 The development of Canada’s SNA
2.3.1 The period up to and including World War I
At the beginning of the 20th century there seemed to be no perceived need for a Canadian System of Macroeconomic Accounts. Economists and policy-makers generally believed the macro-economy to be largely self-regulating, so there appeared to be little requirement for government intervention in the economy, or for macroeconomic statistical information to support such intervention. In addition, the refined statistical survey techniques and digital computation methods relied upon so much today did not exist back then. Moreover the international standard for such a system had not begun to develop so if Canada had wanted to create such a statistical system it would have had to conceive it on its own, more or less from the ground up.
Nevertheless Duncan McDowall identifies a key first step in the second decade of the 20th century:
“Sensing that the economic structure of Canada was undergoing seismic change, George Foster flexed his authority as trade and commerce minister in the newly elected Conservative government of Robert Borden. In 1912 he appointed a commission to provide a blueprint for a ‘comprehensive system of general statistics adequate to the necessities of the Country.’ Prominent in its membership were [federal government statistician Robert] Coats and Adam Shortt, a Queen’s University political economist addicted to empirical investigation. The commissioners were blunt in their assessment. Although Confederation in 1867 had given Ottawa statistical pre-eminence in the young nation, ‘little or no statistical information exists in a form suitable for practical application.’ Canadians were in the dark about what ‘phenomena in Canada’ required scientific measurement ‘if national development is not to proceed blindly or at a disadvantage.’ Vigorous centralization of statistics, the commission concluded, should be the unbending order of the day. What Canada needed was ‘a central thinking office’ for statistical affairs. Armed with such unequivocal advice, Foster acted. On 1 July 1915 he appointed Coats Dominion statistician and commissioner of the census; a strongly centralized agency would follow.”Note 17
Coats’ first major assignment from the minister was to estimate the value of Canada’s national wealth. This he did, arriving at an estimate of $16,293,500,000 for the year 1915.Note 18 However, the estimate was very heavily caveated since the statistical system from which it was derived was still in its infancy. Updating the wealth estimates some years later and anticipating the continuing debates about the concepts of income and wealth that were to follow in the decades ahead, he commented that: “The economic concept of national wealth is concrete and purely material, since economics is not able to take cognizance of the immense field of intangible wealth created by churches, schools and other institutions which develop morals, wisdom and character rather than commodities, nor of such things as climate, location, health, etc. which promote individual and national welfare and are often referred to as wealth.”Note 19
2.3.2 The period between the two World Wars
Back in the 1920s, the prevailing attitude among economists was the ‘classical’ one emphasizing microeconomic supply and demand relationships underpinned by rationality assumptions. Developments in the economy could be understood by applying a combination of economic theory and deductive logic, it was believed. Supporting statistical information was not vital and in any case was mostly unavailable. Adam Smith’s ‘invisible hand’ metaphor was predominant.
There were certainly some statistics, notably on various kinds of goods production. But viewed from the perspective of the 21st century they were scattered, incomplete, not very reliable, poorly integrated and not at all timely. There was no single, widely accepted way to define and measure national income. This situation prevailed without much concern through the 1920s while Canada’s economy boomed.
World stock markets crashed in 1929 and the Great Depression began. Final demand plunged and unemployment rose to dire levels. The desperate state of the economy was obvious to all, but its underlying causes were hard to diagnose. The few economic statistics that were available from the then Dominion Bureau of Statistics (DBS)Note 20 were not of much help in understanding the country-wide economic problem or finding a solution.
Canada was, of course, just one nation among many that were in crisis. In this environment, John Maynard Keynes from the United Kingdom emerged as someone with a strikingly new view of the macro-economy. His book, The General Theory of Employment, Interest and Money, published in 1936, provided a macroeconomic theory that justified interventionist policies by government to counter the business cycle. However, the application of these ideas at the time was greatly hindered by a lack of statistical information about the macro-economy. Moreover “Keynes was not alone in his intuition. His colleague at Cambridge, Colin Clark, had been busy since the early 1930s trying to trace the patterns of production, distribution and income within the British economy ... Clark sensed that once an economy had been broken down into its component transactions, it could be rebuilt in its aggregate form in a way that showed the respective contribution of each activity. Clark is generally credited with popularizing the term “gross national product” as a figure that conveyed the value of all final goods and services produced in an economy over a set period.”Note 21
In the United States, Simon Kuznets was another leading thinker with somewhat similar ideas. He was deeply involved in the National Bureau of Economic Research’s studies on national income accounts and the measurement of national income.
In Canada, DBS prepared its own statement of national income and its components in 1934, but the estimates and the framework within which they were couched were both rudimentary. “When a Winnipeg grain merchant complained to the Dominion statistician that Manitoba had become a ‘poverty-stricken’ region, Coats replied that ‘accurate statistics of wealth and income of Manitoba would dispel a good deal of confusion and possible wrong thinking’ but that the agency had made only a ‘stab’ at such analysis. ‘I fear we have not accomplished very much’.”Note 22 There was a growing need not just for reliable national income statistics, but for provincial information as well.Note 23
Coats set up a Committee on National Income Statistics in 1939, but the group made only modest progress with the advent of war. By 1941 Sydney Smith, the chief business statistician at DBS, and his team had produced a 149-page volume entitled The National Income of Canada: 1919-1938,Note 24 but its contents were not as promising as its title suggested. John Deutsch, an economist at the Bank of Canada at the time, was particularly damning in his criticism.Note 25
2.3.3 The birth of Canada’s System of Macroeconomic Accounts
“Canada’s modern System of National Accounts was born on a cold evening in April 1942 ... [at] 295 Manor Avenue ... this address was the home of Clifford Clark, a former University of Queens political economist, who since 1932 had been Canada’s deputy minister of finance ... It had taken two weeks to find a niche in Clark’s crammed schedule for this meeting, and even at that only an evening meeting was possible. The cars pulling into the driveway bore the best and brightest of Ottawa’s wartime bureaucracy ... Graham Towers, the brilliant young governor of the Bank of Canada, John J. Deutsch, [from the] bank’s research department, Robert Bryce, who not only oversaw the Ministry of Finance’s research efforts but also sat as the secretary to the all-powerful Economic Advisory Committee ... the deputy minister of trade, Dana Wilgress, a seasoned expert in Canadian trade, arrived ... Rounding out the arrivals that evening were Fraser Elliott, the lawyer who oversaw the Ministry of National Revenue’s income tax division and Sedley Cudmore, the man who had just taken on Robert Coats’s mantle as Dominion statistician.”Note 26
“The deputy minister first put pressure on Elliot of National Revenue. He quickly extracted a promise that more precise and more workable tax data would be released to compilers of national income ... Clark finally turned to [Sedley] Cudmore, the Dominion statistician. Would the DBS be prepared “to set up a special unit ... to organize and carry out this national income work?”Note 27
“Bryce nudged Bangs [the assistant to Sydney Smith] into further revelations. ‘I got the impression that a good deal of the Bureau of Statistics work, in his opinion, is of poor quality ... An audit would show up many errors and deficiencies ... The morale of the staff down there is pretty low. There is a good deal of bickering, jealousy and knifing of one another.’ What most consternated Bryce was the news that Smith was so overwhelmed by his work that he was taking data home with him and having his family attempt tabulations of the national income. It did not take much to get the overwrought Bangs to agree that a ‘new man’ was needed to head Canada’s System of National Accounts.”Note 28
“The search that had begun two years earlier in a Rockcliffe living room … ended not far away in the overcrowded and decrepit offices of the Dominion Bureau of Statistics on Green Island ... In the spring of 1944 was the appointment of George Luxton as chief of the DBS’s fledgling research and development staff.”Note 29
Luxton did much to get Canada’s new system of macroeconomic accounts project off the ground. He organized a team and set about working on an initial set of income and expenditure accounts. In September 1944, Richard Stone visited him in Ottawa. Stone played a giant’s role in the development of the international standard for national accounting and he was awarded the Nobel Memorial Prize in Economic Sciences for his work in 1984. He and Luxton journeyed to Washington together to participate in the so-called Tripartite Discussions on National Income Measurement with Milton Gilbert from the National Income Unit of the U.S. Department of Commerce.
The framework that emerged from these discussions was one in which incomes and expenditures were both measured, and their separate totals—both being gross national product—were balanced. The Keynesian theoretical model, within which aggregate demand, saving and investment were central, aligned well with this structure. The distinct roles of the three main domestic institutional sectors—businesses, households and governments—were recognized. This was the kind of framework that fiscal and monetary policy makers needed to guide their thinking.Note 30
Tragically, Luxton died in January 1945, after accomplishing a lot in his short tenure. Claude Isbister was appointed to take over. He had a staff of nine specialists. Another new statistician to join the group that year was Simon Goldberg, who was to play a very important role in the accounts’ development during the 1950s and 1960s.
Isbister’s first major challenge was to finish the development of balanced income and expenditure accounts time series for the period 1938 to 1945, with breakdowns of wages, salaries and other income by province. These statistics were to be used in a new federal program of fiscal equalization for the provinces which took effect on April 1, 1947. They were also intended to provide vital information in support of the goals set out in a government white paperNote 31—to foster high and stable levels of employment and income in the post-war reconstruction period. The new system of macroeconomic accounts was destined to play a vital, trusted role in the post-war federation. The first annual estimates of balanced income and expenditure accounts were published in April 1946.Note 32 These are reproduced in Table 2.2.
| 1938 | 1939 | 1940 | 1941 | 1942 | 1943 | 1944 | Preliminary 1945 | |
|---|---|---|---|---|---|---|---|---|
| millions of dollars | ||||||||
| Salaries, wages and supplementary labour income | 2,449 | 2,540 | 2,860 | 3,529 | 4,233 | 4,790 | 4,969 | 5,037 |
| Military pay and allowances | 9 | 32 | 193 | 386 | 641 | 910 | 1,068 | 1,089 |
| Investment income | 692 | 782 | 1,110 | 1,518 | 1,765 | 1,809 | 1,785 | 1,811 |
| Net income of individual enterprises, agricultural and other | 790 | 867 | 949 | 1,081 | 1,638 | 1,560 | 1,863 | 1,690 |
| Net national income at factor cost | 3,940 | 4,221 | 5,112 | 6,514 | 8,277 | 9,069 | 9,685 | 9,627 |
| Indirect taxes less subsidies | 646 | 743 | 843 | 1,062 | 1,092 | 1,125 | 1,125 | 992 |
| Depreciation allowances and similar business costs | 504 | 528 | 581 | 684 | 771 | 819 | 771 | 750 |
| Residual error of estimate | -15 | 3 | 92 | 75 | 156 | 111 | 190 | -10 |
| Gross national product at market prices | 5,075 | 5,495 | 6,628 | 8,335 | 10,296 | 11,124 | 11,771 | 11,359 |
| Government expenditure on goods and services | 891 | 1,090 | 1,514 | 2,600 | 4,323 | 5,359 | 5,325 | 4,393 |
| War | 37 | 210 | 826 | 1,952 | 3,585 | 4,407 | 4,542 | 3,726 |
| Non-war | 854 | 880 | 688 | 648 | 738 | 952 | 783 | 667 |
| Gross private investment at home | 450 | 705 | 1,004 | 1,122 | 793 | 304 | 620 | 746 |
| Net private investment abroadNote 1 | 18 | -97 | -90 | -268 | -175 | -324 | -252 | -365 |
| Personal expenditure on consumers' goods and services | 3,700 | 3,799 | 4,293 | 4,956 | 5,511 | 5,896 | 6,268 | 6,576 |
| Residual error of estimate | 16 | -2 | -93 | -75 | -156 | -111 | -190 | 9 |
| Gross national expenditure at market prices | 5,075 | 5,495 | 6,628 | 8,335 | 10,296 | 11,124 | 11,771 | 11,359 |
|
||||||||
2.3.4 The 1950s and 1960s
In 1950, Goldberg became director of the Bureau’s Central Research and Development Staff. One of the group’s crucial tasks was to calculate gross national product estimates at constant prices, with the effects of price changes removed. This was accomplished and the statistics were first released in 1952. Quarterly estimates were calculated and the accounts estimates were adjusted to remove the effects of seasonality, using a twelve-month moving average method.Note 33 These seasonally adjusted quarterly estimates of real GNP, first released in the fall of 1953, quickly became one of Canada’s most important sub-annual economic barometers.
During this period and subsequently DBS remained closely involved with international efforts to standardize national accounting. When official United Nations guidelines were released in 1953, Canada worked to align its system as closely as possible. “ ... There was nothing hollow in Herbert Marshall’s boast [Marshall became Dominion Statistician in 1945] to the minister of trade and commerce, C.D. Howe, that Canada’s national accountants ‘now rank with the best in the world.’”Note 34
Early work on the measurement of fixed capital formation was done by William Hood and Anthony Scott, in studies for the Royal Commission on Canada’s Economic Prospects in the 1950s.Note 35 They estimated investment in new plant and equipment by industry. Thomas Rymes continued this work as an economist in the Central Research and Development Staff starting in 1958.
Hood also did an exploratory study for the commission on the flow of funds.Note 36 DBS did further development work on this topic in the 1960s and in 1969 released its first official set of quarterly Financial Flow Accounts (FFAs), extending back to 1962. Later corresponding balance sheet accounts, recording stocks of financial assets and liabilities, were released. Both of these datasets provided detail for 30 institutional sectors and sub-sectors.Note 37
In 1962, the Bureau released an important national accounts publication providing balanced annual income and expenditure tables from 1926 to 1956.Note 38,Note 39 The tables included personal saving and disposable income, gross domestic product at factor cost, gross national expenditure at the constant prices of 1949 and the associated implicit price indexes, along with sector account tables for the four institutional sectors: persons, governments, businesses and non-residents. Also included in this publication was the industrial distribution of gross domestic product and the distribution of personal income by province and territory. Finally, the publication included a thorough explanation of the conceptual framework for the national accounts. This document became known as the ‘Brown Book’. Chart 2.1 and Chart 2.2 show the GNP estimates from that source.
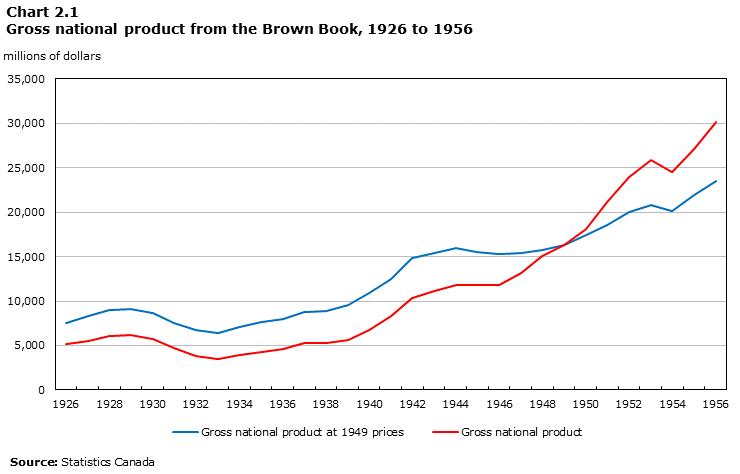
Data table for Chart 2.1
| Years | Gross national product at 1949 prices | Gross national product | GNP deflator |
|---|---|---|---|
| millions of dollars | |||
| 1926 | 7576 | 5152 | 68.0 |
| 1927 | 8270 | 5549 | 67.1 |
| 1928 | 9037 | 6046 | 66.9 |
| 1929 | 9061 | 6134 | 67.7 |
| 1930 | 8679 | 5728 | 66.0 |
| 1931 | 7567 | 4699 | 62.1 |
| 1932 | 6798 | 3827 | 56.3 |
| 1933 | 6359 | 3510 | 55.2 |
| 1934 | 7127 | 3984 | 55.9 |
| 1935 | 7678 | 4315 | 56.2 |
| 1936 | 8022 | 4653 | 58.0 |
| 1937 | 8820 | 5257 | 59.6 |
| 1938 | 8871 | 5278 | 59.5 |
| 1939 | 9536 | 5636 | 59.1 |
| 1940 | 10911 | 6743 | 61.8 |
| 1941 | 12486 | 8328 | 66.7 |
| 1942 | 14816 | 10327 | 69.7 |
| 1943 | 15357 | 11088 | 72.2 |
| 1944 | 15927 | 11850 | 74.4 |
| 1945 | 15552 | 11835 | 76.1 |
| 1946 | 15251 | 11850 | 77.7 |
| 1947 | 15446 | 13165 | 85.2 |
| 1948 | 15735 | 15120 | 96.1 |
| 1949 | 16343 | 16343 | 100.0 |
| 1950 | 17471 | 18096 | 103.6 |
| 1951 | 18547 | 21170 | 114.1 |
| 1952 | 20027 | 23995 | 119.8 |
| 1953 | 20794 | 25820 | 124.2 |
| 1954 | 20186 | 24571 | 121.7 |
| 1955 | 21961 | 27070 | 123.3 |
| 1956 | 23542 | 30098 | 127.8 |
| Source: Statistics Canada | |||
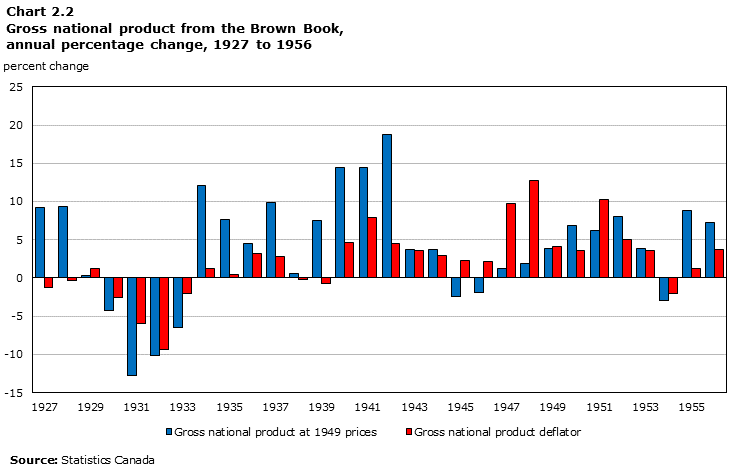
Data table for Chart 2.2
| Years | Gross national product at 1949 prices | Gross national product | GNP deflator | Gross national product at 1949 prices | Gross national product deflator |
|---|---|---|---|---|---|
| percent change | |||||
| 1927 | 8270 | 5549 | 67.1 | 9.2 | -1.3 |
| 1928 | 9037 | 6046 | 66.9 | 9.3 | -0.3 |
| 1929 | 9061 | 6134 | 67.7 | 0.3 | 1.2 |
| 1930 | 8679 | 5728 | 66.0 | -4.2 | -2.5 |
| 1931 | 7567 | 4699 | 62.1 | -12.8 | -5.9 |
| 1932 | 6798 | 3827 | 56.3 | -10.2 | -9.3 |
| 1933 | 6359 | 3510 | 55.2 | -6.5 | -2.0 |
| 1934 | 7127 | 3984 | 55.9 | 12.1 | 1.3 |
| 1935 | 7678 | 4315 | 56.2 | 7.7 | 0.5 |
| 1936 | 8022 | 4653 | 58.0 | 4.5 | 3.2 |
| 1937 | 8820 | 5257 | 59.6 | 9.9 | 2.8 |
| 1938 | 8871 | 5278 | 59.5 | 0.6 | -0.2 |
| 1939 | 9536 | 5636 | 59.1 | 7.5 | -0.7 |
| 1940 | 10911 | 6743 | 61.8 | 14.4 | 4.6 |
| 1941 | 12486 | 8328 | 66.7 | 14.4 | 7.9 |
| 1942 | 14816 | 10327 | 69.7 | 18.7 | 4.5 |
| 1943 | 15357 | 11088 | 72.2 | 3.7 | 3.6 |
| 1944 | 15927 | 11850 | 74.4 | 3.7 | 3.0 |
| 1945 | 15552 | 11835 | 76.1 | -2.4 | 2.3 |
| 1946 | 15251 | 11850 | 77.7 | -1.9 | 2.1 |
| 1947 | 15446 | 13165 | 85.2 | 1.3 | 9.7 |
| 1948 | 15735 | 15120 | 96.1 | 1.9 | 12.7 |
| 1949 | 16343 | 16343 | 100.0 | 3.9 | 4.1 |
| 1950 | 17471 | 18096 | 103.6 | 6.9 | 3.6 |
| 1951 | 18547 | 21170 | 114.1 | 6.2 | 10.2 |
| 1952 | 20027 | 23995 | 119.8 | 8.0 | 5.0 |
| 1953 | 20794 | 25820 | 124.2 | 3.8 | 3.6 |
| 1954 | 20186 | 24571 | 121.7 | -2.9 | -2.0 |
| 1955 | 21961 | 27070 | 123.3 | 8.8 | 1.3 |
| 1956 | 23542 | 30098 | 127.8 | 7.2 | 3.7 |
| Source: Statistics Canada | |||||
In the early 1960s, Canada’s balance of international payments (BOP) statistics were integrated with the income and expenditure accounts. The BOP and its companion statistical system, the international investment position (IIP) estimates, had been developing separately up to that point. The first experimental BOP estimates were calculated quite early in the century.Note 40 Official statistics were first released in 1939, covering the period from 1926 forward.Note 41 Herbert Marshall was the leader on BOP statistics around this time. In 1949, a substantial book was published recording the annual balance of payments estimates from 1926 to date and describing the sources of information used and the associated statistical methods.Note 42 C.D. Blyth played a key role. Quarterly estimates were first released in 1953.Note 43 Parliamentary approval in 1962 of the Corporations and Labour Unions Returns Act (CALURA), which empowered the Dominion Bureau of Statistics to collect financial and other information on the affairs of corporations and labour unions, was important for the BOP and IIP. Along with other data, it yielded much-needed information about the country of control for large corporations. A key player in the development of Canada’s BOP program around this time was Bower Carty.
2.3.4.1 The advent of computers
Computers came into DBS in 1960, when an IBM 705 was acquired for use in connection with the 1961 census. Thus began a radical increase in the possibilities for macroeconomic accounting. Without computers, national accounts estimates had to be compiled laboriously by hand, pencilled into giant ledger books. It took some decades for these ledgers to fully disappear from the scene, but their eventual departure was foretold in 1960. Figure 2.1 shows one of the ledgers from those days. In the following decades, as computers became more and more capable at lower and lower cost, the work processes of the macroeconomic accounts were fundamentally redesigned.
Figure 2.1 An income and expenditure accounts ledger
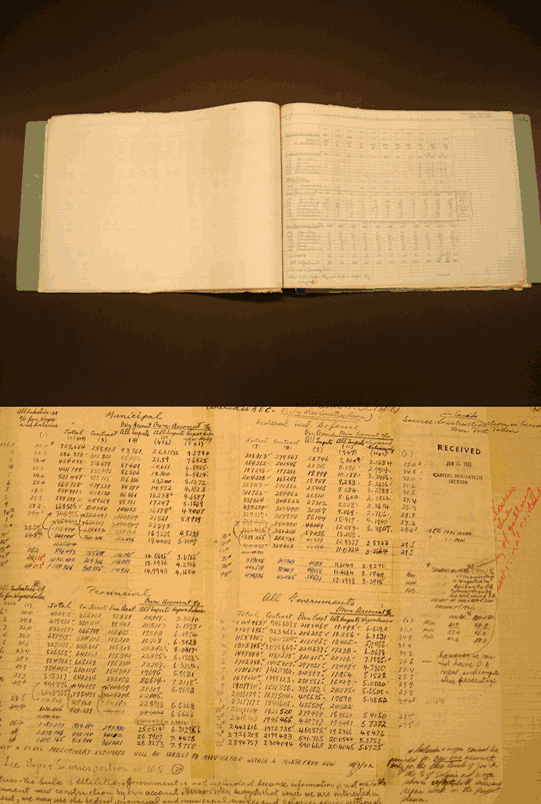
Description for Figure 2.1
An income and expenditure accounts ledger. The figure consists of a pair of photographs. One of the photographs shows an income and expenditure accounts ledger book, opened to a randomly chosen page. The book has rigid covers and when opened is about 1.5 metres across and 0.50 metres from top to bottom. The other photograph is a zoomed-in picture of a single random page from the ledger, showing hundreds of numbers written in pen or pencil and some textual notes written in longhand in various spaces around the page.
One of the new possibilities flowing from the arrival of computers was that of providing users of DBS information with online access to statistics. Canadian macroeconomists were increasingly focussed on building econometric models and for this they required computerized databases. “There was common agreement that the DBS’s income and expenditure national accounts figures should be the linchpin of any database ... At first, the computing procedures were almost glacial; punched data cards were sent daily by bus [from Ottawa] to the University of Montreal for processing on a mainframe, the results printed out, and then bussed back to Ottawa. Out of all this, the Canadian Socio-Economic Information Management System (CANSIM) was born in 1969 as a ‘statistical public utility serving Canadian business, industry and education ... The national accounts had joined the electronic age’”Note 44
2.3.4.2 Supply and use accounts
The advent of computers also greatly facilitated the development of supply and use accounts, referred to as input-output (I/O) tables at the time. “Goldberg was, as usual, the first to pick up the scent. I/O analysis had a double appeal to him. It held the promise of bringing the national accounts into more intimate contact with the economy—of unravelling the skein of intermediate transactions that constituted the daily economic pulse of the nation. It also promised to act as a powerful verifier of the consistency of national accounts statistics, every piece of input datum had to match up with its companion on the output side.”Note 45 In fact, this last function—as a powerful verifier—was relevant for most of the Bureau’s economic statistics, both survey results and national accounts compilations.
These accounts required an enormous amount of source data about the output and intermediate consumption of Canadian business establishments and the final consumption expenditures of the institutional sectors. The Bureau’s entire business survey system had to be redesigned in order to collect the required information efficiently and comprehensively and steps to accomplish this have been going on for decades.Note 46
A first, experimental I/O table was produced for the year 1949 and was released in 1956. It was broken down into 42 industries. This work was led by Jack Sawyer. Then in the 1960s it was decided to build a new program of annual, rectangular, industry-by-product-class I/O tables. An I/O statistics division was established and among its key economists were Terry Gigantes, Shaila Nijhowne and Kishori Lal each of whom was to play an important role in the accounts in the decades to come. The I/O statistics program was fated to grow ever stronger as the years went by, becoming the backbone of the entire system of balanced macroeconomic accounts.Note 47,Note 48
2.3.4.3 Productivity
The input and output statistics available in the I/O tables were precisely what was needed for another program that emerged in the 1960s—one centred on measuring changes in Canadian productivity.Note 49 This domain was, and remains, a very challenging one as its focus is on the differential between the growth rates of inputs and outputs. It demands quite precise measurement of both and in addition, the two measurements must be comparable in terms of their definition, coverage, valuation and timing. Initially attention was focused on labour productivity—the ratio of the total output of an industry to the total labour input used by that industry. Later attention would also turn to multifactor productivity—the ratio of the total output of an industry to a weighted average of all the inputs used by that industry (capital, labour, energy, materials, services).
2.3.4.4 Historical revision of 1969
The 1960s ended with the release of an important historical revision to Canada’s national accounts.Note 50 This revision covered the 42-year period 1926-1968 and it implemented conceptual changes agreed to internationally in the 1968 System of National Accounts standardNote 51 and statistical changes stemming from the exploitation of a number of new and improved data sources. Among other changes, government investment expenditures excluding defence capital-like outlays were recognized as part of gross fixed capital formation as were transfer costs on the sale or purchase of existing capital assets. With the arrival of universal medicare, public hospitals were transferred from the personal sector to the government sector. These and other changes put into effect as part of the revision are summarized in Table 2.3. GNP was raised 6.1% relative to the previous estimates and this alteration to the level was ‘wedged’ back in the previous years.
| Change number | Description |
|---|---|
| 1 | Gross fixed capital formation was defined to include both government fixed capital (excluding defence outlays) and all transfer costs on the sales and purchases of existing fixed assets. Prior to this all government expenditures and capital goods transfer costs were both regarded as current. Capital formation in inventories was extended to cover changes in surplus war assets and in the inventories of government commodity agencies. The imputed net rent on government-owned buildings was dropped. |
| 2 | Public hospitals were transferred from the personal to the government sector, beginning in 1961. Public hospitals had been, irrespective of actual ownership, formerly classified as private non-profit institutions in the personal sector with all final hospital expenditures included under personal expenditure on consumer goods and services. |
| 3 | Employer and employee contributions to social insurance and public service pensions were treated as a transfer payment (tax outlay) from persons to government, instead of as a deduction from personal income. The new treatment yielded more appropriate estimates of personal income and conformed to SNA 1968. Personal disposable income was unaffected, with personal income and tax outlays rising equally. |
| 4 | Net rental income of persons, formerly classified with interest and miscellaneous investment income, was included with the net income of non-farm unincorporated business. |
| 5 | Government investment income was changed to include from 1949 onward, only the remitted profits of government business enterprises, instead of the total profits; the remitted portion was treated as being analogous to dividend distribution of corporate profits, while unremitted profits were left in the saving of the corporate and government business enterprise sector. This treatment conformed to that in SNA 1968. Taxes on government business enterprises were included with corporate direct taxes. |
| 6 | Government income from resource royalties was redefined as investment income instead of indirect taxes, starting in 1947. |
| 7 | Profits of provincial liquor control boards were reclassified from government investment income to indirect taxes. |
| 8 | Withholding taxes were treated as part of the income accruing to non-residents from Canadian production. Withholding taxes thus appeared in the sector accounts, as a transfer payment from non-residents to government. |
| 9 | The new sector accounts provided for transfer payments in the non-residents account and therefore permitted an improved treatment of various items, principally government official contributions and pensions paid abroad, and personal remittances both to and from abroad. These items were formerly included in final expenditure and were henceforth shown as inter-sectoral transfers. |
| 10 | Bad debts owed by persons to corporations and written off in company books were treated as a transfer payment from corporations to persons, and consequently shifted from miscellaneous valuation adjustments to corporation profits. Bad debts owed by persons to unincorporated business were also shifted, from miscellaneous valuation adjustments to net income of non-farm unincorporated business. |
| 11 | The non-productive portion of interest on consumer debt was shown as a transfer payment from persons to corporate business, in order to portray personal outlays more accurately. No change occurred in corporate business saving or personal saving, for the item was previously excluded from both income and outlays in each sector. |
| 12 | Municipal waterworks were reclassified from government business enterprises to general government; the reverse treatment, from 1959 onward, was applied to the Canadian Broadcasting Corporation. |
| 13 | Investment income of trusteed pension plans covering government employees was reclassified to personal investment income. |
| 14 | Employer contributions to the pensions of armed forces personnel were reclassified from wages, salaries and supplementary income to military pay and allowances. |
| 15 | The former investment income appropriation account was replaced by an income and expenditure account for corporate and government business enterprises. Thus income and expenditure accounts existed for all four sectors – persons (including private non-profit institutions) and unincorporated business, government, corporate and government business enterprises, and non-residents. |
| 16 | Apart from the 1961 Census benchmark, a major new source of information pertaining to wages, salaries and supplementary labour income was the full tabulation of wages and salaries, derived from employers’ submission of employees’ earnings on the ‘T4’ form, undertaken by the Department of National Revenue with the advent of the Canada Pension Plan. |
| 17 | Estimates of capital consumption allowances for corporations were based on company estimates of ‘depreciation’ instead of ‘capital cost allowances’. The latter are affected by government fiscal policies whereas the former are closer to economic depreciation. In addition, government capital cost allowances were calculated on a replacement cost basis. |
| 18 | The quantity of new residential construction for 1926 to 1950 was re-estimated using contracts awarded for the period before the Second World War, Census of Construction for the war years and building permits and Central Mortgage and Housing Corporation starts for the post-war period. In previous estimates the basis of measurement was inter-censal changes in housing stock inferred from Census counts and interpolated on the movement of an index of annual disappearance of certain building materials. |
| 19 | Productivity and profit margin adjustments were introduced in the deflators for residential and non-residential construction. The unavailability of market price indexes made it necessary to construct these deflators from cost-of-production price indexes. The previously constructed deflators were deficient because they removed from the current dollar estimates not just pure price change, but also changes due to fluctuations in productivity and profit margins. |
| Source: Extracted from Dominion Bureau of Statistics, National Income and Expenditure Accounts 1926-1968, August 1969. | |
2.3.5 The 1970s and 1980s
The 1970s and 1980s were years of consolidation for the macroeconomic accounts. They had become firmly established in Canada and their main elements were already in place. The new challenge was to improve and expand upon what was already a solid and fairly complete system.
2.3.5.1 New documentation
In March 1975 Statistics Canada released a comprehensive, three-volume set of documentation of the national accounts, known informally as the ‘Orange Book’. Volume 1 presented a complete record of the annual income and expenditure accounts estimates from 1926 to 1974. Volume 2 displayed the quarterly estimates from 1947 to 1974. Volume 3 contained a thorough explanation of the definitions, concepts, data sources and methods of the income and expenditure accounts, written by the director of the income and expenditure accounts division at the time, Robert Crozier. Volume 3 is available in PDF format on the Statistics Canada website.Note 53
2.3.5.2 Doubts about the adequacy of the GNP concept
By the time the 1970s arrived the concept of gross national product was so deeply planted in the workings of Canada’s business and government that some were starting to question its growing dominance in national discussions about economic policy. Was it reasonable to consider GNP as a proxy for national welfare, as many people increasingly seemed to be doing? “Is the Government of Canada and the Dominion Bureau of Statistics giving consideration to including in the computation of the Gross National Product the value of the housewife and of household domestic services?” asked Member of Parliament Edward Broadbent in the House of Commons, in 1970.Note 54 Said Prime Minister Pierre Trudeau in 1974: “Prosperity is the rallying cry of politicians everywhere. But what of happiness? ... How often in our blindness do we reflect on the fact that those computers calculating the magical GNP regard with equal weight the manufacture of a motor vehicle and a fatal automobile accident ... If money is spent, the GNP is enhanced. The economy benefits ... We know in our hearts that this is false.”Note 55
In the United States, professors James Tobin and William Nordhaus suggested there might be too much focus on the now well-established GNP indicator. In 1972 they developed an alternative welfare indicator they called a “measure of economic welfare” (MEW). Taking GNP as a starting point, they added positive adjustments for the imputed value of leisure time and the services associated with unpaid work while subtracting the imputed value of environmental damage due to production and consumption activity.
2.3.5.3 Imputed value of household work
No MEW estimates as such were developed for Canada during the 1970s, but Statistics Canada did explore the areaNote 56 and developed some experimental estimates of the imputed value of household work. In 1978 Hans Adler and Oli Hawrylyshyn produced estimates for 1961 and 1971 indicating that when appropriately chosen market wage rates were multiplied by the quantity of time spent on household work—information about the latter being obtained from time use surveys—the resulting figures were equivalent to approximately 40% of Canada’s GNP. These estimates have been updated on occasion in subsequent years.
2.3.5.4 Environmental statistics
Efforts to develop relevant statistics about the relationship between the economy and the environment also got under way in the 1970s, but progress was slow in Canada as in other countries. A principal problem was that the damaging effects of air, water and land pollution were not being priced in the market and could only be valued indirectly. In addition, Statistics Canada had yet to develop the survey vehicles necessary to gauge private and public expenditures on pollution abatement and other environmentally-relevant activities. Nevertheless, a new publication entitled Human Activity and the Environment: A Statistical Compendium was released for the first time in 1978. This volume brought together in one place a wide range of information from Statistics Canada, Environment CanadaNote 57 and a number of other sources that cast light on the relationship between the environment and the economy. The book has been updated and republished many times since then.
2.3.5.5 National accounts timeliness
An important accomplishment in the mid-seventies was the improvement in the time of release of the quarterly income and expenditure accounts and balance of payments estimates. Up to that time the estimates had been made available to the public within 95 to 100 days after the reference quarter. However, other countries had more timely releases and users of the accounts were pressing for a major reduction in the Canadian release lag. The United States, in particular, was releasing preliminary estimates of GNP just two weeks after the reference quarter. A study was conducted by Cyril Hodgins in 1979 to examine the options and trade-offs with respect to more timely income and expenditure accounts.Note 58 Thereafter with some effort—and some compromises—the release lag for the official estimates was reduced to around 60 days, where it remains to this day.
2.3.5.6 Intolerably large revisions in the 1970s
Statistics Canada’s macroeconomic accounts program also experienced a crisis of sorts that built up gradually through the 1970s. The economy grew very rapidly in the first few years of the decade and this growth was accompanied by rising inflation. In this setting, two of the most important surveys underpinning the income and expenditure accounts—the employment survey and the retail trade survey—were persistently and substantially underestimating the growth of nominal income. A rapid expansion in the number of operating businesses was occurring, but at the time the survey system was ill-equipped to catch this dimension of the growing economy. On the income side of the accounts, wages and salaries were substantially underestimated in the preliminary estimates and on the expenditure side this was matched by estimates for household expenditures on goods and services that were also too low. It took quite a while before this underestimation was fully recognized. Eventually the problem was diagnosed and addressed by obtaining very reliable benchmark data for labour income from the T4 database of the then Revenue Canada department. The income and expenditure estimates were revised upward quite substantially. However, Statistics Canada’s reputation took quite a blow, especially as the agency was experiencing a number of other acute issues around that time.Note 59
To deal with the situation, the government appointed two commissions to investigate the agency, one led by Price-Waterhouse, a consultancy, and the other conducted by Sir Claus Moser, a famous British statistician. In the resulting reports, the main conclusions were that there was a problem with the management of the agency and that more priority needed to be attached to methodological issues with respect to business and national accounts statistics. Some important management changes were made in response to these reports and a new Chief Statistician was appointed from outside the agency in 1981, Martin Wilk.
Wilk took some strong steps to reorient Statistics Canada and he retired in 1985 due to ill health. Ivan Fellegi became the Chief Statistician. “For almost four decades he [Fellegi] had been an observer as the small national accounts group at Tunney’s Pasture grew in size and maturity. He had known Simon Goldberg. He understood the data inputs that fed the national accounts from the agency’s wide net of surveying. Once established in the chief statistician’s office, his genius would lie in providing the national accounts team with a stable organizational base, in keeping the fiscal wolf away from the door and in constantly encouraging new application of the national accounts to the interest of civil society. Under this umbrella, the national accountants at Statistics Canada were left to pursue their creative purposes through the late 1980s and 1990s.”Note 60
2.3.5.7 National Accounts Advisory Committee
One of the ways in which Statistics Canada sought to rebuild its reputation in the 1980s was to reach out and communicate more frequently and directly with its users and data suppliers. In 1984 a National Accounts Advisory Committee was established with about a dozen highly qualified economists from across Canada having a strong interest in national accounts statistics. Most of the members were university professors and economic researchers. There were also high-level members from Finance Canada and the Bank of Canada. This committee has met twice a year in every year since then and has provided a wealth of good advice to the agency about Canada’s System of Macroeconomic Accounts.
2.3.5.8 Historical revision of 1986
In 1986, Statistics Canada released an historical revision of the national accounts covering the period 1961 to 1985.Note 61 GNP was revised up by 1.8% in 1985 and the revision was carried back to the earlier years. The largest single revision was to residential construction expenditure on major alterations and improvements and it was based largely on new information from the 1982 Family Expenditure Survey (FAMEX) which contained questions designed to meet the requirements of the national accounts. See Table 2.4 for a list of the more important changes made in this historical revision.
Prior to this revision the main national accounts aggregates were not constrained to be the same across the entire system. For example, total personal expenditure on consumer goods and services (as it was then called) in the income and expenditure accounts differed from the corresponding aggregate in the supply and use tables, although the two were conceptually the same. From this revision forward such aggregates were constrained to be the same in all parts of the System of Macroeconomic Accounts.
The expenditure estimates at constant prices were rebased to the year 1981 as part of the revision. In addition, on this occasion the accounts adopted an hedonic price index for computers that had been developed jointly by the United States Bureau of Economic Analysis (BEA) and the International Business Machines (IBM) corporation. The index used previously to deflate the computer portion of machinery and equipment investment and imports of computer equipment had only modest adjustments for quality change and had shown gradual increases in prices over time. The new BEA-IBM price index, in contrast, reflected large advances in computer quality over time and featured substantial decreases in price. As a result, the estimates at constant prices for machinery and equipment investment expenditure and imports of machinery and equipment were both revised up substantially.
As part of the revision, Statistics Canada adopted gross domestic product (GDP) as its headline national accounts measure, in place of gross national product (although estimates of GNP were and still are produced as well). GDP gauges the income that is earned and the output that is produced within the geographical boundaries of the country regardless of whether those receiving the income are resident or non-resident. GNP, in contrast, measures the income earned by the residents of the country, regardless of whether that income is earned domestically or abroad. In other words, GDP is equal to GNP plus Canadian income earned by non-residents minus foreign income earned by residents. GNP is a better indicator of the income of Canadian residents, but GDP is a superior measure of production within Canada’s borders and correlates more closely with other macroeconomic indicators such as employment and inflation. The use of GDP, rather than GNP, as the main income and expenditure accounts aggregate also fits better with the provincial accounts and the industry-based accounts, both of which aggregate to GDP. The GDP aggregate was highlighted in the 1968 United Nations standard for national accounting and most countries now focus their macroeconomic accounting systems on that aggregate.
| Change number | Description |
|---|---|
| 1 | From this revision forward, aggregates such as GNP, personal expenditure on consumer goods and services and total wages, salaries and supplementary labour income were constrained to be the same in all parts of the Canadian System of Macroeconomic Accounts. |
| 2 | Residential construction expenditure on major alterations and improvements was revised up substantially based largely on new information from the 1982 Family Expenditure Survey (FAMEX) which contained questions designed to meet the requirements of the national accounts. These revisions had a significant effect on the estimates for residential construction, net rents, personal expenditure on consumer goods and personal saving. |
| 3 | Revisions were made to military pay and allowances to include the employer’s contributions to medical plans on behalf of military personnel. |
| 4 | Corporation profits were revised upward due to the removal of bad debt write-offs of business as a current expense in the calculation of bank profits and the inclusion of withholding taxes paid to foreign governments (shown as transfers to non-residents in the income and outlay accounts). |
| 5 | Local government indirect taxes less subsidies were revised down due to the reclassification to sales of goods and services of school fees and Quebec water rates. Local government subsidies to transit systems were included in subsidies. In addition, a portion of interest on investments by governments had been erroneously included with miscellaneous indirect taxes and was thereafter included with investment income. |
| 6 | Defence expenditures on goods and services were lowered by the exclusion of grants for defence research, which were henceforth treated as capital assistance. |
| 7 | Government capital formation expenditures were reduced by the shifting of capital outlays by the Post Office and private schools from the government sector to the business sector. |
| 8 | A major change was made to the calculation of the value of physical change in manufacturing inventories, which was henceforth done by stage of fabrication. This was implemented back to 1961. |
| 9 | Exports and imports of services were revised due to the inclusion of withholding taxes paid by residents to foreign governments and of spending on education and health services by residents abroad and non-residents in Canada. |
| 10 | The expenditure estimates at constant prices were rebased to the year 1981 as part of the revision. |
| 11 | The accounts adopted an hedonic price index for computers that had been developed jointly by the United States Bureau of Economic Analysis (BEA) and the International Business Machines (IBM) corporation. The new price index reflected large advances in computer quality over time and featured substantial decreases in price. As a result, the estimates at constant prices for machinery and equipment investment expenditure and imports of machinery and equipment were both revised up substantially. |
| 12 | Statistics Canada adopted gross domestic product (GDP) as its headline national accounts measure, in place of gross national product (although estimates of GNP were and still are produced as well). Although estimates of real GNP were no longer released, the following advice was offered: “The user who wishes to calculate GNP at constant prices may do so by deflating net investment income received from non-residents with the overall GDP implicit price index and adding the result to GDP at constant prices.” |
| 13 | New tables were added to the System of Macroeconomic Accounts giving more detail on personal expenditure on consumer goods and services and on investment in fixed capital and inventories, at both current and constant 1981 prices. Additional details were also added for labour income and capital consumption allowances by sector. The government revenue and expenditure table was broken down into separate tables for each level of government. |
| 14 | Changes were made to the classification of personal expenditures on goods by durability class to accord more closely with the United Nations recommendations. |
| 15 | Gross fixed capital formation was defined to include both government fixed capital (excluding defence outlays) and all transfer costs on the sales and purchases of existing fixed assets. |
| 16 | Capital formation in inventories was extended to cover changes in surplus war assets and in the inventories of government commodity agencies. |
| 17 | The imputed net rent on government-owned buildings was dropped. |
| Source: Extracted from Statistics Canada, The Canadian Income and Expenditure Accounts: Description of Revisions, mimeo, Ottawa, July 18, 1986. | |
Just three years after the historical revision, Statistics Canada published A User Guide to the Canadian System of National Accounts,Note 63 a volume aiming, like the present one, to describe the concepts and structure of the accounts as they existed at the time.
Among the key players in the 1986 historical revision were Stewart Wells, Kishori Lal, Barbara Clift, Albert Meguerditchian and John Randall, who wrote the User Guide.
2.3.5.9 Improvements to the financial and balance sheet accounts
In 1983-84 the first national balance sheet accounts for Canada were released, covering non-financial assets, financial assets, liabilities and net worth for all sectors of the economy. This included a consolidated national balance sheet which integrated the international investment position. In part this was based on guidance from the UN Provisional Guidelines on Balance Sheet Accounts and Stock-Flow Reconciliation Account issued in 1978. Stock-flow reconciliation accounts were also released in 1985.
Credit aggregates were introduced into Canada’s financial accounts 1987 as an extension of the national balance sheet accounts, following the seminal work of Benjamin M. Friedman who argued that central banks should be monitoring credit aggregates as opposed to monetary aggregates.Note 64 These are among the most widely quoted series from the quarterly balance sheet account.
2.3.6 The 1990s and 2000s
The further development of Canada’s System of Macroeconomic Accounts proceeded in the 1990s and 2000s. Major enhancements included the elaboration of provincial and territorial accounts and the blossoming of several new satellite accounts. Studies were conducted on the possible size of the unmeasured economy, also referred to as the ‘underground economy’, and the financial accounts were upgraded. The period was characterized by important historical revisions in 1997 and 2012/2015.
2.3.6.1 Provincial and territorial accounts
One of the principal development themes in the macroeconomic accounts during the 1990s was the expansion and improvement of the provincial and territorial economic accounts. First estimates of the income and expenditure accounts for the ten provinces had been produced on an experimental basis in the 1980s. Later these were extended to cover the three northern territories and the price-volume decomposition was applied to these accounts in the early 1990s. The timeliness of their official release was also substantially improved.
Then in 1996, at the initiative of Finance Canada, a five-year “Project to Improve Provincial Economic Statistics” (PIPES) was launched. The goal was to develop a system of annual provincial and territorial supply and use accounts. These were to provide source statistics for a new federal-provincial revenue allocation formula associated with the harmonized sales tax (HST). The tax itself was initiated on April 1, 1997 although the agreement among the participating governments was signed on October 23, 1996. The statistics had to be reliable and to merit the trust of all governments participating in the harmonized tax. At first there were four directly participating governments—Newfoundland and Labrador, Nova Scotia, New Brunswick and the Government of Canada. Quebec also participated, but in a different way. It was expected that other provinces might join the arrangement in the future.
To realize the goals of this project, the survey system had to be greatly expanded and overhauled. Many existing surveys needed to have their sample sizes increased and their sampling strategies redesigned to cover adequately each individual province and territory. Some new surveys had to be launched to fill information gaps. Additional administrative data, especially from the Canada Revenue Agency, had to be acquired, organized and prepared for use in conjunction with the survey data. The business register—a large database containing profile information about all Canadian businesses with annual revenue greater than $30,000—had to be expanded and improved. All of this and more was necessary in order to furnish the enormous quantity of information required to produce the provincial and territorial supply and use tables.
The end result, when the project was completed successfully in 2001, was that Canada had—and still has—by far the most detailed and comprehensive system of regional accounts of any country in the world.
2.3.6.2 Underground economy
In 1994, Statistics Canada published an important study examining how large the unmeasured economy—also referred to as the underground economy—might be. The study looked at each of the various surveys and administrative data sources used in compiling the estimates of gross domestic product and posed the question: By how much might these data sources be persistently underestimated? Upper bounds on the possible ongoing underestimation error were assigned to each of the main data sources, drawing on the knowledge and judgement of the national accounts experts and business statisticians using and responsible for these data sources. This enabled the calculation of an upper bound estimate of the extent of possible persistent underestimation of GDP. Since 2009 similar studies have been carried out every year. Monitoring the potential size of the underground economy is important to ensure Canada has a comprehensive measure of economic activity. All of the studies done to date have indicated that at a maximum the underground economy in Canada might be equivalent to 2-3% of gross domestic product.
2.3.6.3 Financial flow and national balance sheet accounts
The financial accounts were also improved during this period. A thorough Guide to the Financial Flow and National Balance Sheet Accounts was released in 1989.Note 65
Between 1992 and 1996, the timeliness of the quarterly financial flow accounts was improved from about 90 days to about 60 days after the end of the reference period to match the timeliness of the other components of the quarterly national accounts. This allowed for the simultaneous analysis of aggregate demand and its components with financial transactions and was a precursor to the integrated sector accounts that were released in 1997.
In 2003 the national balance sheet accounts and the international investment position estimates were increased in frequency from annual to quarterly. In addition, some asset types in these accounts were shifted from a book value basis to a market value basis.
A new pension satellite account was released in 2010, detailing the private- and public-sector components of the Canadian pension system within a dynamic asset-stock/income-and-contribution-flow framework.
In 2012 the direct investment position estimates contained in the international investment position account were converted from an historical cost valuation to market valuation. In addition, unlisted equity assets were valued at market prices for the first time, meaning the entire balance sheet was at market prices.
In 2015 the national balance sheet accounts estimates were expanded to include quarterly estimates of natural resource assets.
2.3.6.4 Satellite accounts
The 1990s also saw the creation of a number of Canadian ‘satellite accounts’. These statistical structures are closely related to the standard System of National Accounts, adopting many of its concepts, conventions and classifications, while at the same time departing from the standard in some important ways. This approach adds flexibility to the System of Macroeconomic Accounts, allowing some important issues to be addressed that do not fit naturally within the standard system.
2.3.6.4.1 Environmental and natural resource satellite account
Environmental and natural resource satellite accounting started in Canada in the early 1990s. In 1991 the government allocated ongoing funding to Statistics Canada for the purpose. In 1994 an important international conference on national accounts and the environment was held in London, England and this stimulated the environmental accounting effort considerably. It took several years for the necessary surveys to be developed and the accounts to be prepared, but today Canada has one of the best environmental satellite accounts in the world. Annual physical flow accounts are now available along with a number of environmental surveys. In addition, Canadian research work has been conducted in the area of the valuation of ecosystems and a land account has been developed. In 2012 the United Nations Statistical Commission adopted the first international standard for this type of accounting called the System of Environmental-Economic Accounting (SEEA).
2.3.6.4.2 Tourism satellite account
A tourism satellite account was also created in the 1990s, with financial support from the Canadian Tourism Commission. This work began in 1991.Note 66 The idea here was to combine information about the many different industries selling goods and services to individuals, whether resident or non-resident, who are travelling a substantial distance from their home location. These statistics enable analyses of the output and employment effects of tourism in Canada.
2.3.6.4.3 Non-profit institutions and volunteering satellite account
A satellite account of non-profit institutions and volunteering was also developed in 2005 to identify the economic contribution of Canada’s non-profit sector and contribute to an increased understanding of its interaction with other sectors of the economy. The account contained a set of economic statistics describing Canada’s non-profit sector. It included a set of standard economic accounts and a nonmarket extension to put an economic value on unpaid volunteer labour.
2.3.6.4.4 Culture satellite account
In addition, a culture satellite account was developed in 2010. It provided measures of the economic importance of culture (inclusive of the arts and heritage) and sport in Canada in terms of output, gross domestic product and employment.
2.3.6.5 Historical revision of 1997
In 1993 a significant upgrade to the international standard for national accounting, referred to as SNA 1993, was released. Around the same time, the International Monetary Fund published the fifth edition of the Balance of Payments Manual (BPM5). After the release of these documents Statistics Canada set about modifying Canada’s macroeconomic accounts to conform to the new standards as closely as possible. As with previous updates to international standards, Canada strove to line up its accounts with the standards so as to facilitate international comparisons, although it was found expedient to depart from the standards in some areas to better reflect the available data sources and institutional structure of the country. The resulting historical revision of the Canadian accounts was released in November 1997 and covered the period from the first quarter of 1961 forward.Note 67 Table 2.5 highlights the major changes implemented in this revision.
| Change number | Description |
|---|---|
| 1 | Retirement allowances (severance payments) were included in supplementary labour income, starting in the year 1990 when data from Canada Revenue Agency became available. Formerly they were omitted due to lack of source data. |
| 2 | Certain employer payroll taxes were excluded from supplementary labour income on the grounds that there were no directly associated economic benefits to employees. They were reclassified as taxes on production. |
| 3 | Hospital and medical expenditures were no longer deducted from the assessment revenue of workers’ compensation boards when estimating employer contributions, starting in 1961. |
| 4 | The Canada Revenue Agency T4 undercoverage adjustment for tips on meals, accommodation and hairstyling was expanded to include porters and baggage carriers at railway stations and a downward adjustment was made to the estimate of tips on hairstyling and beauty services. |
| 5 | Transfer costs on the sale of existing dwellings were expanded to include not just real estate commissions, but also legal fees and all other fees and taxes related to the transfer of used residential assets. |
| 6 | Prior to the historical revision, all Department of National Defense spending on equipment and structures was treated as current spending. As part of the revision, consistent with SNA 1993, outlays for structures and equipment used by the military that can also be used for civilian purposes (airfields, docks, roads, hospitals, transport aircraft, etc.) were reclassified as capital spending with an associated imputation for capital consumption in subsequent accounting periods. Purchases of destructive weapons and their supporting systems continued to be treated as current expenditure items. |
| 7 | Prior to the historical revision, an upward adjustment was made each year to capital spending on machinery and equipment on the grounds that businesses typically report some smaller capital items as operating rather than capital expenses. As part of the revision, consistent with SNA 1993 and also due to the fact there was little information available upon which to base such a correction, this adjustment was removed. |
| 8 | The definition of capitalized mineral exploration expenses was expanded to include general exploration expenditures undertaken by mining companies on their own account, or by mineral exploration companies on contract, as well as geological and geophysical expenses incurred in exploration related to petroleum and natural gas. |
| 9 | Progress payments on large capital acquisitions that require several accounting periods for full delivery were reclassified as financial flows, rather than as capital spending, for transactions between residents and non-residents. For transactions between resident units such flows continued to be treated as capital expenditure due to source data limitations. |
| 10 | Motor vehicles acquired under financial leases were allocated to the using sector, as recommended by SNA 1993. However all other capital goods acquired under financial leasing arrangements continued to be allocated to the industry of the owner rather than the user, due to source data limitations. |
| 11 | The SNA 1993 recommendation that exports and imports of goods be valued f.o.b. at the border of the exporting country was adopted. Previously they were valued at the plant and the associated inland transportation costs to the border were treated as trade in services. However, the supply and use tables continued to record detailed imports c.i.f. including import duties, with an offset of these duties at the aggregate level so the total value of imports was the same as in the balance of payments. |
| 12 | As recommended by SNA 1993, all goods imported for processing and then re-exported were deemed to undergo a change of ownership at the border and were treated as trade in goods rather than in services. This change mainly affected imports of uranium and gold. |
| 13 | The international travel account was reconfigured as recommended in BPM5 to include a broad range of travellers’ purchases of goods and outlays related to travel for educational and medical purposes, to exclude passenger fares (which moved to the transportation account) and to introduce a new distinction between business and personal travel. |
| 14 | The SNA 1993 methodology for financial intermediation services indirectly measured (FISIM), which was already applied to banks, was extended to other financial corporations. In addition the FISIM on business transactions of credit unions was shifted from household consumption to intermediate consumption and FISIM was calculated for the first time on government deposits and government borrowing. |
| 15 | The split of FISIM output between depositors and borrowers was recalculated based on the value of deposits and loans outstanding and the share attributed to depositors for each sector was based on the sector’s share of deposits. |
| 16 | The SNA 1993 recommendation to allocate FISIM to exports and imports was adopted in the income and expenditure accounts and the supply and use tables. In the balance of payments no such allocation was made, consistent with the different recommendations of BPM5. |
| 17 | The SNA 1993 recommendation to include the investment income from technical reserves in the output of insurance companies was adopted. |
| 18 | In accordance with 1993 SNA recommendations, the industry category ‘government royalties on natural resources’ was eliminated and so was the payment of such royalties out of the intermediate consumption of the industries using these assets. |
| 19 | Prior to the historical revision, non-market producers were not shown in the supply and use tables. Their inputs were directly allocated to final consumption. As part of the revision, non-market producers were included in the supply and use tables, as per the SNA 1993 recommendations. |
| 20 | Seasonally adjusted financial flow accounts statistics were produced at a level of sector aggregation sufficient to tie in with the seasonally adjusted statistics in the income and expenditure accounts. |
| 21 | Prior to the historical revision, gold transactions were treated in a special and unusual way. After the revision, non-monetary gold was treated as a normal commodity and transactions in non-monetary gold were recorded as inventory change. The transformation of gold into a monetary asset by the monetary authorities was recorded in the other changes in assets account and this treatment was extended back to 1968. |
| 22 | The SNA 1993 recommendation to include asset-backed securities in the financial flow accounts and the balance sheet accounts was adopted. They were allocated to the category ‘securities other than shares’. Most of the securitized assets were allocated to a new institutional sector called ‘issuers of asset-backed securities’. |
| 23 | Universities were moved from the household sector to become a sub-sector of the provincial and territorial government sector. Non-profit colleges were also placed in this sub-sector. School boards in Newfoundland and Labrador, previously in the household sector, were moved to become a sub-sector of the local government sector. Non-profit hospitals were changed from being a separate sub-sector of the government sector to being a sub-sector of the provincial and territorial government sector. All deposit insurance organizations were also transferred to the government sector; previously some were classified as business enterprises. Provincial and local government housing authorities were moved from the business sector to the government sector. All of these universe changes were carried back to the inception date of the institutional unit or 1961, whichever came later. |
| 24 | All refundable tax credits were treated as expenditures. Previously some of these credits were netted against tax revenue. |
| 25 | The 1993 SNA recommendation to treat payments by households for some specific licenses and permits, such as motor vehicle licenses, as indirect taxes was adopted. Previously some such payments by households were treated as direct taxes. |
| 26 | The 1993 SNA recommendation to treat payments to cover losses on current production as subsidies and those to cover large operating deficits accumulated over two or more years as capital transfers was adopted. |
| 27 | Debts forgiven by governments were treated as capital transfers as per the SNA 1993 recommendations. Debts written off by businesses were treated as balance sheet adjustments in the other changes in assets account. |
| 28 | Prior to the historical revision, a small portion of the corporate income taxes collected from life insurance corporations was allocated to the household sector. After the revision no such allocation was made. Instead life insurance companies are deemed to pay the entire tax and the income attributed to the household sector is recorded net of that tax. |
| 29 | Capital transfers from local governments to their own government business enterprises, to other businesses and to persons were recorded as local government capital transfers. Previously they were unrecorded. |
| 30 | Grants in lieu of taxes paid by the federal and provincial governments to local governments were treated as indirect taxes rather than as transfers. |
| 31 | A federal government liability was recorded in respect of the allowances for losses against the foreign loan assets of the Export Development Corporation and Canada Wheat Board. Formerly such allowances for losses were deducted from the federal government’s assets in these corporations. |
| Source: Extracted from Statistics Canada, The 1997 Historical Revision of the Canadian System of National Accounts: Record of Changes in Classification of Sectors and Transactions, Concepts and Methodology, by Kishori Lal, October 1998. | |
Four years after the historical revision, another change was put into effect that was recommended in the SNA 1993 standard. This was the move from five-year-linked Laspeyres estimates of product expenditures at constant prices to quarterly-linked Fisher chain estimates. This change was intended both to reduce the ‘substitution bias’ indexation problem and to make Canada’s real GDP estimates comparable to those of the United States and other advanced countries.Note 69
Around the same time, pre-packaged and licensed software, plus custom-designed and own-account software expenditures were capitalized in the accounts.Note 70 This change affected the national balance sheet as well as gross capital formation in the income and expenditure and supply and use accounts. The change brought Canada in line with the United States and some other advanced countries that introduced software into their estimates of investment in previous years. It also aligned Canada with the 1993 SNA recommendation that business and government acquisition of software be treated in national accounts as an investment rather than as a current expense.
The SNA 1993 recommendation that artistic and entertainment originals, net acquisitions of valuables, livestock used in production year after year and trees cultivated in plantations all be capitalized was not adopted due to source data limitations. Also, the recommendation that there be five main domestic institutional sectors—households (including unincorporated business), non-profit institutions serving households (NPISH), non-financial corporations, financial corporations and general government—instead of the three then-existing sectors—persons and unincorporated business (including NPISH), corporations and government business enterprises, and general government—was not adopted at the time, although it was subsequently done as part of the 2012 historical revision. Similarly, the recommendation that a distinction be drawn between final consumption expenditure and actual final consumption was not implemented in 1997, though it is on the priority list for the future as this paper is being written.
2.3.6.6 Historical revision of 2012 and 2015
The most recent historical revision was released in two steps—in 2012 and 2015—with one or more instalments still to come. The revision puts into effect many of the changes in SNA 2008 and some from SNA 1993. It applies to the estimates from the first quarter of 1981 forward. The main elements of this historical revision are listed in Table 2.6.
| Change number | Description |
|---|---|
| 1 | Expenditures on research and development were reclassified from intermediate consumption to gross capital formation as recommended by SNA 2008. These expenditures along with existing investment statistics for software and mineral exploration, were classified in a new investment category called intellectual property products. |
| 2 | Expenditures on military weapons systems, which were formerly treated as current government spending, were reclassified as capital expenditures as recommended by SNA 2008. |
| 3 | The methodology for consumption of fixed capital was changed to the replacement cost method using a geometric depreciation model. Previously the estimates for corporations, unincorporated businesses and government business enterprises were based on historical cost and used a linear depreciation method. The replacement cost approach is recommended by SNA 2008. |
| 4 | The value of unlisted corporations and intercompany investments was shifted to a market value basis, in line with the valuation of listed corporations and other assets and liabilities on the national balance sheet and in the international investment position. |
| 5 | The product and industry classifications used in the CSMA were updated in a manner that provides greater detail for services and service-providing industries, with less detail for goods and goods-producing industries than previously. For household consumption expenditures the international classification of individual consumption according to purpose (COICOP) was adopted. |
| 6 | The six institutional sectors recommended by SNA 2008 – households, non-profit institutions serving households, non-financial corporations, financial corporations, general government and non-residents – were adopted. Previously the CSMA worked with four main sectors – persons and unincorporated business (including NPISH), corporations (both non-financial and financial), general government and non-residents. In addition, a new sub-sector was defined within the general government sector - the Aboriginal general governments sub-sector. These institutional units were formerly classified with households. |
| 7 | A substantial change was made in the way the income and expenditure accounts are presented. Prior to 2012 Canada still followed the presentation from the 1968 SNA standard. In the historical revision the 2008 SNA standard ‘sequence of accounts’ format was adopted which resulted in a presentation more aligned with that of other countries. |
| 8 | New and improved estimates of government sector statistics were introduced, reflecting a comprehensive effort to adopt the concepts explained in the International Monetary Fund’s Government Finance Statistics Manual 2014 and to exploit previously unavailable general ledger data from provincial, territorial and local governments. The new accounting concepts and methods and improved data sources resulted in more accurate measures of government revenue, expenses, operating balances, assets and liabilities. |
| 9 | Contributions to defined benefit pension plans were recalculated on an accrual basis, meaning that pension plan receipts are now recorded as income when the associated work is performed. Previously these contributions were treated on a cash basis. |
| 10 | Improved source data led to an upward revision of financial services purchased by households for explicit charge (a component of final consumption expenditure) and a corresponding reduction of financial services purchased by businesses for explicit charge (an intermediate consumption expenditure). Investment dealer fees paid by households were also revised up. |
| 11 | Natural resource wealth estimates, derived as part of the effort to build an environmental satellite account, were added to the quarterly national balance sheet account. |
| 12 | The balance sheet market value estimates for residential real estate were improved by exploiting source data from the Survey of Financial Security and Property Assessment files. Previously these statistics were estimated using the perpetual inventory method. |
| 13 | The service lives for various non-residential and machinery and equipment asset types were revised, leading to higher estimates of consumption of fixed capital and lower estimates of the net capital stock. |
| 14 | Estimates of investment in residential structures were increased to reflect better information about the value of land improvements transferred by developers to municipalities upon completion of residential subdivisions. |
| 15 | Subsidies related to crop insurance provided to farmers were reclassified as subsidies on production rather than as subsidies on products. |
| 16 | To better align with international macroeconomic accounting standards, covered bonds, bearer-deposit notes and other securities issued by chartered banks were reclassified from the ‘chartered bank deposit liabilities’ category in the financial flow accounts to the ‘bonds and other short-term securities’ category of those accounts. |
| 17 | The other changes in assets account, which is the aggregate of the other changes in the volume of assets account and the revaluation account, was introduced into the sequence of accounts, thereby filling the remaining gap in the sequence that determines the difference between the opening balance sheet account in a particular accounting period and the closing balance sheet account for that period. The two component parts of this account – the other changes in the volume of assets account and the revaluation account – were not yet separately identified. |
| 18 | The historical revision also provided an opportunity to improve the estimation methods for a number of national accounts components, most notably unincorporated business income, the sectoral distribution of dividend receipts and labour income, the estimates of international trade price indexes, the estimates of travel expenditures, household expenditures on used vehicles and exports and imports of services. |
| Source: Extracted from the Statistics Canada website at http://www.statcan.gc.ca/pub/13-605-x/2011003/article/11491-eng.htm and http://www.statcan.gc.ca/pub/13-605-x/2015011/article/14298-eng.htm. | |
Start of text box 2.1
Text box 2.1
Primary input incomes or expenses
1. The 1946 vintage
This was the first vintage of the income and expenditure accounts. It contained annual statistics from 1938 to 1945 and was consistent with the international standard that was emerging at the time but had not yet been formalized. For the statistics themselves and other details see Dominion Bureau of Statistics, National Accounts Income and Expenditure 1938-1945, Ottawa, Edmond Cloutier, Printer to the King’s Excellent Majesty, April 1946.
2. The 1962 vintage (1953 SNA)
This vintage presented annual statistics from 1926 to 1956. These statistics were consistent with the 1953 international SNA standard. For the statistics themselves and other details, in print, see Dominion Bureau of Statistics, National Accounts Income and Expenditure 1926-1956, Ottawa, Catalogue no. 13-502, 1962.
3. The 1974 vintage (1968 SNA)
This vintage presented annual statistics from 1926 to 1974 and quarterly statistics from 1947 to 1974. These statistics were consistent with the 1968 international SNA standard. For the original statistics themselves, in print, see Statistics Canada, National Income and Expenditure Accounts, volume 1, The Annual Estimates and volume 2, The Quarterly Estimates, Catalogue no. 13-549-E, 1975. These statistics were updated up to the year 1997, when they were superseded by new statistics based on the 1993 SNA standard. The quarterly statistics on this basis from 1947 to 1997 are available in CANSIM tables 380-0500 through 380-0513 inclusive. The annual statistics from 1926 to 1986 are available in CANSIM tables 380-0515 through 380-0569 inclusive.
4. The 1997 vintage (1993 SNA)
This vintage presented annual and quarterly statistics from 1961 to 1997. These statistics were consistent with the 1993 international SNA standard. They were updated to the year 2012, when they were superseded by new statistics based on the 2008 SNA standard. The quarterly statistics from 1961 to 2012 are available in CANSIM tables 380-0001 through 380-0015 inclusive. The annual statistics from 1961 to 2011 are available in CANSIM tables 380-0016 through 380-0062 inclusive.
5. The 2012 vintage (2008 SNA)
This is the current vintage. It includes quarterly statistics from 1981 to date. These statistics are consistent with the 2008 international SNA standard. The quarterly statistics are available in CANSIM tables 380-0063 to 380-0088.
End of text box 2.1
2.4 Conclusion
This chapter recounts the story of how the CSMA emerged in the first half of the 20th century and gradually evolved into the wide-ranging, sophisticated and vital statistical database it is today.
As has been described, the growth and improvement of the accounts over the decades has been facilitated by several more or less parallel developments. One was the steady advancement of the conceptual framework for the international System of National Accounts, which is outlined earlier in this chapter. Another was the steady progress of digital computation methods and systems over the period which empowered national accountants and business survey statisticians to build larger and more timely databases with more refined methodologies. The mathematical science of statistical survey-taking also improved greatly, allowing the CSMA to benefit from more reliable, more carefully targeted data gathering. Simultaneously, administrative databases—particularly those from the Canada Revenue Agency and the Canada Border Services Agency—became larger, more detailed and more easily accessible by Statistics Canada as time passed. In addition, the number and educational qualifications of staff working on the accounts, both directly and indirectly, grew substantially. These and other factors combined to enable the development of what is now a remarkably comprehensive and reliable macroeconomic time series database.
Of course, the story is not finished. There is no doubt the CSMA will continue to evolve and improve in future, as the Canadian economy and the needs of Canadians continue to change.
- Date modified: