
Statistics Canada
www.statcan.gc.ca
Common menu bar links

Archived Content
Information identified as archived is provided for reference, research or recordkeeping purposes. It is not subject to the Government of Canada Web Standards and has not been altered or updated since it was archived. Please "contact us" to request a format other than those available.
Information and communications technologies (ICT)
Printable version (PDF) of this article
The ‘New Economy’ is most often associated with information technology and innovations, including the production of computers, cell phones and related goods and services. The information or digital revolution is commonly referred to as Information and Communications Technologies (ICT). Broad access to personal computers in business, government and households has led to rapid expansion of Internet use, changing the way in which Canadians access, share information and do business. Over the past two decades, and particularly the 1990’s, ICT has been an engine of growth and a major thrust in long periods of low-inflation and economic expansion. Since the latter part of 2000, however, expansion of the ICT sector came to a halt, as the manufacturing of ICT products crashed in light of slumping global demand. Overall, growth in ICT services slowed significantly, but nonetheless communications services continued to expand at a healthy pace through increased domestic demand for services such as Internet and cell phones.
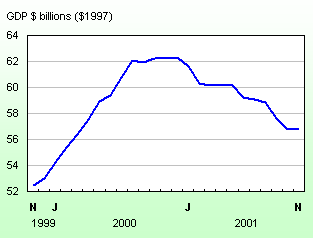
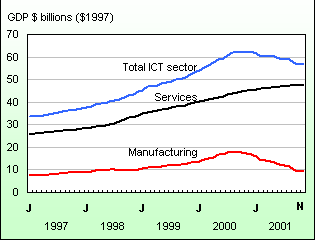
Chart: Total ICT Sector
With the release of the November 2001 monthly Gross Domestic Product by Industry, we are introducing a new industry aggregation for ICT. This measure will now be included as part of our regular monthly GDP release. The estimates, at this stage, have been worked back to January 1997, the point at which we converted to North American Industrial Classification System (NAICS).
The composition of ICT sector
The ICT measure that we compiled here is consistent with the Organisation for Economic Co-operation and Development (OECD) definition with a couple of exceptions, in that we include the retailing of ICT equipment and exclude the repair of ICT equipment. The OECD definition only includes the wholesaling of ICT equipment. We felt that the inclusion of retailing is warranted since the lines between wholesaling and retailing are becoming increasingly cloudy. Furthermore, the distributive trade surveys at Statistic Canada will not convert to NAICS 97 until 2003. The conversion from SIC 80 to NAICS97 will lead to significant shifting of establishments between wholesale and retail trade. Hence, including all distributive trade of ICT equipment would be more consistent through time.
The ICT sector consists of seven manufacturing industries and nine service industries. For the most part these ICT industries coincide directly with industries that are already published in our monthly GDP. The exceptions are in wholesale, retail, rental and leasing of computer equipment, pay TV, speciality TV and program distribution where only the part of the industry relating to ICT is included. Also, we were not able to break out the ICT component from the total repair and maintenance aggregate. This is explained in the detailed industry listing that follows the data table.
Output of the ICT sector is mainly services. In November 2001 services made up 84% of total ICT output while manufacturing accounted for the remaining 16% share. Developments since the latter part of 2000, however, have significantly changed these shares. In August of 2000, the split between services and manufacturing stood at 70% and 30% respectively. The precipitous decline in the manufacturing of telecommunications equipment, where its’ ICT sector output share fell from 11% to 3% is the main contributor.
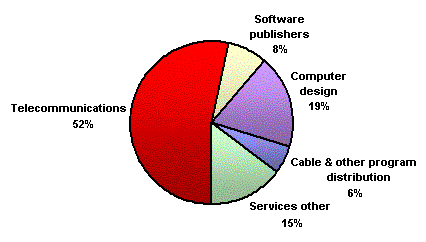
Telecommunications services stand out, by far, as the largest ICT industry, accounting for almost 52% of total services output. Producers of computer design and related services ran a distant second representing about 19% of ICT services sector GDP. These are followed by, software publishers, providers of cable and other program distribution services and wholesalers of computer and communications equipment.
Chart: Components of ICT services sector, November 2001 (GDP)
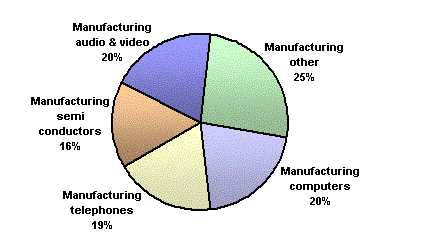
The key industries of the manufacturers of ICT equipment and components
are: computers and peripheral equipment, audio and video equipment, telephone
apparatus and makers of semi-conductors and other
electronic components. As noted earlier, output of the telephone apparatus
industry, which produces telecommunications and related equipment, fell
dramatically over the past 15 months.
Chart: Components of ICT manufacturing sector, November 2001 (GDP)
ICT engine of growth began to sputter in late 2000
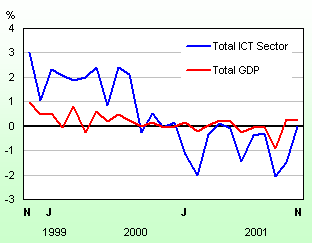
In 2000, growth in the ICT sector was up 21.0% while total GDP increased 4.5%. In fact, ICT contributed one-quarter of all economic growth in that year. So far in 2001, ICT has flattened out while the overall economy has inched up 0.8% (11 months compared to the first 11 months of 2000). The picture is even more dramatic when we look at ICT manufacturing versus services. The manufacturing of ICT equipment and components shot up nearly 40% in 2000 and has declined 25% so far this year. Putting it in a different context, ICT contributed more than 50% to total manufacturing growth in 2000 and three-quarters of the decline in manufacturing output in 2001 to date. Although fabricators of telephone apparatus were the main cause, makers of computers, semi-conductors and communications wire and cable were also main contributors to this pattern. ICT services continued to expand at a heady pace in 2001, albeit slower than in 2000.
Chart: Growth Rates for Total Economy vs. Total ICT sector
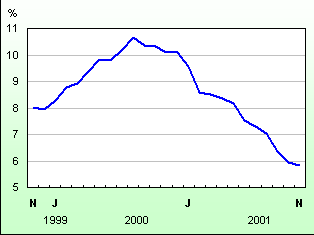
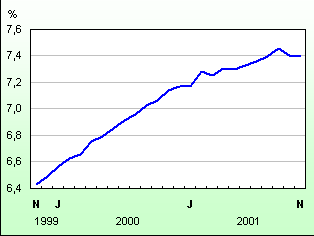
In the final quarter of 2000, output of the ICT sector exceeded $62 billion in 1997 prices. Production increased nearly 70% from 1997 to 2000 and the ICT share of total GDP rose from 4.3% to 6.4%. In November 2001 this level had dropped to $56.8 billion (6.1% of GDP). The manufacturing of ICT equipment and components, which had doubled from 1997 to 2000, went into a tailspin in the latter half of 2000 as global investment in information technology infrastructures waned. Since the August 2000 peak, fabrication of these products declined by half, and the ICT share of manufacturing fell from 10.7% to 5.8%. Demand for ICT services, nevertheless, continued to expand in 2001, increasing 5.8% since the fourth quarter of 2000.
Chart: ICT Breakdown
The fabrication of telecommunications and related equipment in the telephone
apparatus industry in November 2001 stood at only 25% of the level of
output in August 2000. A number of other ICT manufacturing
industries also did not fare well since the fourth quarter of 2000. By
November 2001, the output of industries producing semiconductors and electronic
components, communications wire and cable, and computers and peripheral
equipment had fallen 59.8%, 51.2% and 34.2% respectively. The production
of computer equipment had nearly tripled between 1997 and 2000, and the
industry remained resilient into the first half of this year. Subsequently,
two sharp monthly declines left November output of this industry 37.6%
below May 2001 levels.
Chart: ICT Manufacturing share of Total Manufacturing
Overall, solid growth was maintained for ICT services, but not at the torrid pace set in the previous two years. Nevertheless, ICT related services contributed one-fifth of all growth in the total services sector of the economy so far in 2001 – about the same proportion as in 2000. Top performers include telecommunications, cable services, data processing and software publishing. The only real weakness in services for 2001 was concentrated in the wholesaling and leasing of computer and communications equipment.
Chart: ICT Services share of Total Services
Telecommunications, which account for about half of total ICT services, increased nearly 50% from 1997 to 2000 in response to a growing market for cell phones, long distance services and Internet access. These services continued to expand in 2001 with November output 8.5% higher than December 2000. Over the same period, output of cable services, data processing and software publishing increased 11.3%, 16.8% and 8.5% respectively. Declines in the wholesaling of computer and communications equipment, down 13.9%, and the easing back of rental and leasing of computer equipment (-1.4%) and computer systems and design services (-1.3%) held the reins on the expansion of ICT services.
Monthly Gross Domestic Product by Industry at Basic Prices in 1997 Constant Dollars
| June 2001 |
July 2001 |
August 2001 |
September 2001 |
October |
November 2001 |
November 2000 to November 2001 |
|
|---|---|---|---|---|---|---|---|
| Seasonally adjusted | |||||||
| $ level1 | $ change1 | ||||||
| Total ICT2 sector | 59,309 |
59,112 |
58,915
|
57,714
|
56,874 |
56,782 |
-5,418 |
| ICT services | 46,906 |
47,182 |
47,421 |
47,552 |
47,377 |
47,586 |
2,536 |
| Software publishers | 3,635 |
3,653 |
3,678 |
3,698 |
3,708 |
3,742 |
322 |
| Cable and other program distribution | 2,548 |
2,571 |
2,631 |
2,666 |
2,629 |
2,631 |
304 |
| Telecommunications | 24,624 |
24,792 |
25,044 |
25,284 |
25,332 |
25,368 |
2,148 |
| Information services | 1,283 |
1,287 |
1,289 |
1,291 |
1,293 |
1,298 |
30 |
| Data processing services | 883 |
895 |
907 |
917 |
922 |
930 |
98 |
| Office machinery and equipment rental and leasing | 422 |
422 |
421 |
421 |
421 |
421 |
-6 |
| Computer systems design and related services | 9,113 |
9,142 |
9,036 |
8,928 |
8,860 |
8,813 |
-104 |
| ICT - wholesaling | 2,596 |
2,615 |
2,610 |
2,581 |
2,402 |
2,536 |
-328 |
| ICT - retailing | 1,802 |
1,805 |
1,805 |
1,766 |
1,810 |
1,847 |
72 |
| ICT manufacturing | 12,403 |
11,930 |
11,494 |
10,162 |
9,497 |
9,196 |
-7954 |
| Commercial and service industry machinery | 865 |
848 |
880 |
840 |
804 |
804 |
-60 |
| Computer and peripheral equipment | 2,338 |
2,329 |
2,212 |
1,981 |
1,934 |
1,872 |
-1,120 |
| Telephone apparatus | 3,022 |
2,809 |
2,917 |
2,221 |
1,884 |
1,716 |
-4,004 |
| Broadcasting and wireless communication equipment | 898 |
869 |
904 |
904 |
878 |
860 |
-38 |
| Semiconductor and electronic components | 2,216 |
2,164 |
1,793 |
1,531 |
1,396 |
1,445 |
-1,856 |
| Audio, video and other instruments | 1,964 |
1,902 |
1,860 |
1,829 |
1,775 |
1,796 |
-78 |
| Communication and energy wire and cable | 1,100 |
1,009 |
928 |
856 |
826 |
703 |
-798 |
| Month-to-month % change | % change | ||||||
| Total ICT sector | -1.4 |
-0.3 |
-0.3 |
-2.0 |
-1.5 |
-0.2 |
-8.7 |
| ICT services | 0.5 |
0.6 |
0.5 |
0.3 |
-0.4 |
0.4 |
5.6 |
| Software publishers | 0.7 |
0.5 |
0.7 |
0.5 |
0.3 |
0.9 |
9.4 |
| Cable and other program distribution | 2.9 |
0.9 |
2.3 |
1.3 |
-1.4 |
0.1 |
13.1 |
| Telecommunications | 1.2 |
0.7 |
1.0 |
1.0 |
0.2 |
0.1 |
9.3 |
| Information services | 0.0 |
0.3 |
0.2 |
0.2 |
0.2 |
0.4 |
2.4 |
| Data processing services | 1.1 |
1.4 |
1.3 |
1.1 |
0.5 |
0.9 |
11.8 |
| Office machinery and equipment rental and leasing | -0.5 |
0.0 |
-0.2 |
0.0 |
0.0 |
0.0 |
-1.4 |
| Computer systems design and related services | -0.6 |
0.3 |
-1.2 |
-1.2 |
-0.8 |
-0.5 |
-1.2 |
| ICT - wholesaling | -3.9 |
0.7 |
-0.2 |
-1.1 |
-6.9 |
5.6 |
-11.5 |
| ICT - retailing | -0.2 |
0.2 |
0.0 |
-2.2 |
2.5 |
2.0 |
4.1 |
| ICT manufacturing | -8.0 |
-3.8 |
-3.7 |
-11.6 |
-6.5 |
-3.2 |
-46.4 |
| Commercial and service industry machinery | 0.6 |
-2.0 |
3.8 |
-4.5 |
-4.3 |
0.0 |
-6.9 |
| Computer and peripheral equipment | -22.0 |
-0.4 |
-5.0 |
-10.4 |
-2.4 |
-3.2 |
-37.4 |
| Telephone apparatus | -8.2 |
-7.0 |
3.8 |
-23.9 |
-15.2 |
-8.9 |
-70.0 |
| Broadcasting and wireless communication equipment | -3.5 |
-3.2 |
4.0 |
0.0 |
-2.9 |
-2.1 |
-4.2 |
| Semiconductor and electronic components | -3.1 |
-2.3 |
-17.1 |
-14.6 |
-8.8 |
3.5 |
-56.2 |
| Audio, video and other instruments | 2.8 |
-3.2 |
-2.2 |
-1.7 |
-3.0 |
1.2 |
-4.2 |
| Communication and energy wire and cable | -8.2 |
-8.3 |
-8.0 |
-7.8 |
-3.5 |
-14.9 |
-53.2 |
| 1 | Millions of dollars at annual rates. |
| 2 | Information and Communications Technologies. |
ICT sector - Industry codes
| NAICS descriptions | NAICS code | IMAD descriptions | IMAD code |
|---|---|---|---|
| Manufacturing Industries | |||
| Commercial and service industry machinery | 33331 |
Commercial and service industry machinery | 3333 |
| Computer and peripheral equipment | 33411 |
Computer and peripheral equipment | 3341 |
| Telephone apparatus | 33421 |
Telephone apparatus | 33421 |
| Radio and television broadcasting and wireless communications equipment | 33422 |
Radio and television broadcasting and wireless communications equipment | 33422 |
| Semiconductor and other electronic components | 33441 |
Semiconductor and other electronic components | 3344 |
| Navigational, measuring, medical, and control instrumentation | 33451
|
Audio, video and other instruments (GDP is only available as the sum of these two industries) | 334X |
| Audio and video equipment | 33431 |
||
| Communication and energy wire and cable | 33592 |
Communication and energy wire and cable | 33592 |
| Service Industries | |||
| Software publishers | 51121 |
Software publishers | 5112 |
| Telecommunications services | 5133 |
Telecommunications | 5133 |
| Data processing services | 51421 |
Data processing services | 5142 |
| Computer systems design and related services | 54151 |
Computer systems design and related services | 5415 |
| Other information services | 51419 |
Information services | 5141 |
| Cable and other program distribution |
51322 |
Adjustments made to remove the pay and specialty TV portion of IMAD's industry Pay TV, specialty TV and program distribution. | 5132-ICT |
| Electronic and precision equipment repair and maintenance | 81121 |
It is not possible to break out the ICT component of IMAD's industry total Repair and maintenance (811). | N/A |
| Computer, computer peripheral and prepackaged software wholesaling | 41731 |
The GDP for these three industries is not available individually. We only have GDP available for total wholesale trade. Special ratios were obtained from the annual Input/Output tables to produce an ICT portion of Wholesale trade. | 417-ICT |
| Electronic components, navigational and communications equipment and supplies wholesaling | 41732 |
||
| Office and store machinery and equipment wholesaling | 41791 |
||
| Office machinery and equipment rental and leasing | 53242 |
There is no GDP available at this level of detail. Special ratios were obtained from the annual Input/Output tables to produce an ICT portion of Rental and leasing and lessors of non-financial intangible assets. | 532X-ICT |
| Additional Service Industry | |||
| Retailing of ICT commodities | N/A |
There is no GDP available at this level of detail. Special ratios were obtained from the annual Input/Output tables to produce an ICT portion | 44-ICT |