Common menu bar links
Labour productivity, hourly compensation and unit labour cost
Archived Content
Information identified as archived is provided for reference, research or recordkeeping purposes. It is not subject to the Government of Canada Web Standards and has not been altered or updated since it was archived. Please "contact us" to request a format other than those available.
Second quarter 2007
Labour productivity note to readers
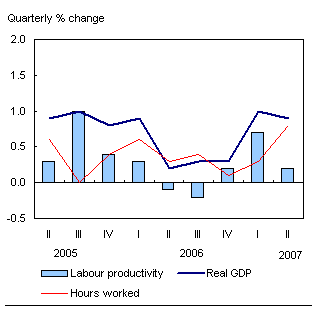
Labour productivity in the Canadian business sector grew moderately (+0.2%) between April and June of 2007, following the strong gain (+0.7%) in the first three months of the year.
This slowing in productivity in the second quarter was directly attributable to an acceleration in hours worked that were dedicated to production. Hours worked for businesses increased at more than double the pace in the second quarter than in the first. At the same time, the pace of economic growth remained about the same.
Chart F.1 Productivity growth in Canada’s
business sector slows
In the United States, labour productivity among American businesses surged 0.9% between April and June, after edging forward (+0.1%) in the first three months of the year. This was its strongest performance since the third quarter of 2005, when the indicator reached 1.2%. The recovery in American productivity in the second quarter reflected a notable acceleration in economic activity.
Chart F.2 U.S. productivity rebounds strongly
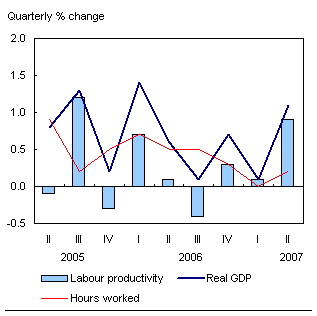
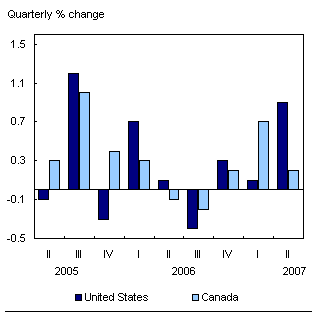
On a quarterly basis, labour productivity growth in Canada and in the United States has been very volatile, but on average these indicators have evolved at a similar pace since the third quarter of 2004.
In Canada, the increase in the number of hours worked between April and June was concentrated in full-time work, which led to a 0.3% increase in hours per job. Hours per job declined during the two previous quarters.
Growth in output comparable, but labour market more dynamic in Canada
Productivity growth in the United States and Canada moved in opposite directions in the second quarter compared with the first. While second-quarter productivity growth in Canada cooled, it heated up sharply south of the border.
Chart F.3 Productivity gap is widely in favour
of the U.S. during the second quarter
In Canada, economic output among businesses recorded a second consecutive quarter of strong growth (+0.9%). Driven by rising incomes, personal expenditure on goods and services continued to sustain economic activity. Spending accelerated to 1.2%, led by a pick-up in consumer outlays on durable goods.
Production rose at comparable pace among Canadian and American businesses between April and June. However, after stagnating in the previous quarter, economic activity in the U.S. business sector rose strongly (+1.1%) − the strongest since the first three months of 2006. This rebound helped American businesses to achieve better productivity gains than those in Canada.
Chart F.4 Comparable GDP growth in both countries
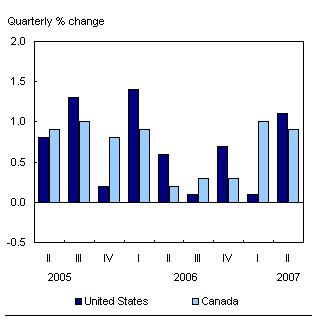
The rebound in American GDP growth is essentially attributed to the strong recovery in net exports (exports minus imports of goods and services) and the acceleration in business investments (mainly in infrastructure investment).
Unlike in previous quarters, consumer spending played a very small part in American GDP growth. The slowdown in consumer spending occurred amidst high gasoline prices and a continued slowing in the housing market.
Differences in labour market performances in both countries also played a role in the faster productivity growth among American businesses. In Canada, the growth in economic activity was accompanied by a more dynamic labour market.
Hours worked devoted to production in Canadian businesses grew 0.8% in the second quarter, more than twice as fast as the 0.3% rise in the first quarter. Full-time work was the main component in the increase in hours worked between April and June. The rise in hours worked in the second quarter was concentrated in administration and support services, accommodation and food services and other commercial services, where productivity levels are relatively low.
Chart F.5 Higher growth in hours worked in Canada
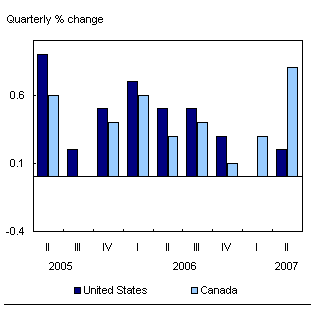
By comparison, hours worked in American companies rose only 0.2% in the second quarter, after remaining unchanged in the first three months of the year.
Canadian businesses watch their competitiveness weaken as the loonie soars
As with productivity in the second quarter, the United States had an advantage over Canada in terms of unit labour costs, particularly when the exchange rate appreciation is taken into consideration.
Unit labour cost, a measure of the cost of wages and benefits of workers per unit of economic output, once again rose more in Canada than in the United States between April and June, when measured in their respective national currencies.
The cost of labour per unit of production for Canadian companies was up 1.0% in the second quarter, following a 1.1% increase in the previous quarter. This slight slowdown in unit labour cost in Canada observed over the April-June period is attributable to the strong deceleration in the increase in hourly wages, which fell from 1.8% in the first quarter to 1.1% in the second quarter.
Since the third quarter of 2006, the growth in this indicator had been at or above 1.0%. The increase in labour compensation during the first two quarters of 2007 stems, in part, from pay equity payments in Quebec and special contributions to the Newfoundland and Labrador pension fund.
Since 2006, these payments have had a significant upward effect on unit labour cost. Excluding these special payments, unit labour cost for the overall economy increases 0.9% and 1.0% in the first and second quarter, respectively.
For American businesses, unit labour costs were up only 0.5% in the second quarter, decelerating from 1.3% in the first quarter and 2.4% in the last quarter of 2006. In the meantime, hourly compensation in the United States picked up, in the second quarter at the same rate as in the first (+1.3%), considerably slower than in the last quarter of 2006 (+2.8%).
Chart F.6 Canadian unit labour costs in US $
leaps sharply
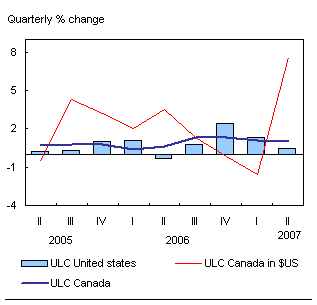
The competitive position of American businesses looked even better when the unit labour cost is adjusted for the exchange rate. The loonie rose sharply (+6.3%) over the American greenback in the second quarters, following two quarters of depreciation. The strength of the Canadian dollar in the second quarter led to a 7.6% jump in the Canadian unit labour cost in U.S. dollars after two quarters of decline.
Despite this deterioration in cost competitiveness, exports of Canadian goods and services still rebounded by 0.7% in the second quarter, after a mere 0.2% rise in the first three months of 2007. Canadian businesses capitalized on the dollar’s strength by investing in machinery and equipment, boosting their acquisitions in this area by 1.5% between April and June, after allowing them to fall in the first quarter.
Downward revisions in productivity growth in U.S. for each of the three previous years
The United States recently revised their estimates on labour productivity in the business sector. The data released today incorporate these revisions to the American data that affected the GDP between 2004 and 2006. The latest revisions for Canada’s four-year GDP are available in The Daily of June 12, 2007.
Overall, the American data revisions lowered the annual rate of growth in American labour productivity for each of the three previous years (2004 to 2006). Throughout this period, American business productivity grew by 2.0% on average, or 0.3 percentage points less than previously estimated.
For 2006, U.S. productivity growth was revised downward from 1.7% to 1.0%, a rate now identical to that in Canada during the same year. With these revised data, productivity growth has been on average similar in both countries since the third quarter of 2004 – a marked improvement in Canada’s case.
| Empty cell | Canada | United States | |
|---|---|---|---|
| Before revision | After revision | ||
| annual % change | |||
| 1981-2006 | 1.5 | 2.2 | 2.1 |
| 1981-2000 | 1.6 | 1.9 | 1.9 |
| 2000-2006 | 1.0 | 2.9 | 2.7 |
| 2003 | 0.3 | 3.8 | 3.8 |
| 2004 | 0.0 | 3.1 | 2.9 |
| 2005 | 2.5 | 2.1 | 2.0 |
| 2006 | 1.0 | 1.7 | 1.0 |
| Source: U.S. data are from the Bureau of Labor Statistics, Productivity and Costs - Second quarter 2007, published in NEWS, September 6. | |||
However, the revisions had almost no medium-term impact on previous estimates. Between 2000 and 2006, annual average growth in American productivity was revised downward, from 2.9% to 2.7%. Despite this revision, the growth in American productivity remained almost three times higher than Canada’s, which came to 1.0% for the same period.
During this period, GDP growth was similar on both sides of the border, but hours worked rose much more in Canada. More precisely, the annual average growth in GDP was 2.5% for Canada and 2.6% south of the border. On the other hand, hours worked increased on average 1.5% per year in Canada while it declined by 0.1% over the same period.
Industry analysis
Net slowdown of productivity in the goods sector
Overall productivity fell 0.2% in the goods sector in the second quarter of 2007 compared to the previous quarter (+1.2%), reflecting declines in the construction industry (-2.0%) and in the agriculture, forestry, fishing and hunting industry (-2.5%) (that registered a drop in its production in the second quarter (- 2.3%)). Despite increased construction activity in the second quarter, mainly in non-residential construction and household renovations, productivity fell with the sharp 2.8% rise in hours worked in construction.
On the other hand, a rebound in the mining, oil and gas extraction industry (+2.5%) and the third consecutive rise in the manufacturing sector (+0.9%) partly compensated for the declines. The rise in the productivity of the mining, oil, and gas extraction industry originates from a change in the industrial composition of this sector following the dramatic decline in mine exploration which is more labour intensive than other components of this industry.
In the service sector, productivity growth was also weaker in the second quarter. The two hardest hit sectors were accommodation and food services (-2.8%) as a result of a drop in production, and administrative and support, waste management and remediation services (-0.7%).
Retail trade (+1.7%) and finance and insurance (+0.4%) industries, on the other hand, had a positive impact on productivity of the service sector in the second quarter. Retail trade advanced in large part because of higher sales of motor vehicle and other durable goods. The finance and insurance sector has been registering growth for six consecutive quarters.
Less upward pressure on hourly compensation in the goods sector
Acceleration of hourly compensation registered for business sector industries in the last two quarters, slowed in the second quarter of 2007 (+ 1.1%) mainly because of industry producing goods.
In the goods sector, the rise in hourly compensation (+0.7%) was moderate in comparison to that observed in the first quarter (+2.5%). The rate of growth in the second quarter was similar to the first two quarters of 2006. This slowdown is attributable to several industries, including construction, manufacturing and agriculture, forestry, fishing and hunting. On the other hand, the mining, oil and gas extraction industry experienced again a significant (+ 3.9%) boost in hourly pay in the second quarter of 2007, surpassing the notable performance observed in the first quarter (+3.1%).
In the service sector, the growth in hourly compensation remained strong in the second quarter (+1.3%), maintaining the same pace as in the previous quarter. The finance and insurance industries and retail trade posted second quarter increases of 2.2% and 1.6%, respectively.
Deteriorating unit labour costs in the service sector
The slower pace in hourly compensation of 1.1% led to the stabilization of unit labour cost growth for business sector industries (1.0%) even though productivity gains were modest (0.2%). Unit labour costs are used to monitor inflationary pressures by comparing relative differences between changes in hourly wages and productivity.
In the second quarter of 2007, unit labour costs in the service sector accelerated by 1.3% mainly because of the increases in the finance and insurance industry (2.0%) and in business services (3.2%). These two industries experienced a strong rise in their hourly compensation in the second quarter. This is the third quarter in a row to have had large increases in unit costs in the service sector. The first quarter of 2007 brought a 0.9% increase, and the last quarter of 2006 a 1.1% increase.
The rise in labour costs in the goods sector was a bit more modest in the second quarter, (+ 0.9%) compared to the previous quarter (+1.2%). The growth in this sector stemmed largely from the construction industry (+2.8%) following a drop in productivity in this industry. The utilities industry registered a drop of 2.2% in the labour unit costs while the manufacturing sector edged down (-0.1%).
Statistical tables
- Table F.1 Business sector - Labour productivity and related variables for Canada and the United States, quarterly
- Table F.2 Business sector - Some related variables for labour markets
- Table F.3 Indexes of labour productivity by industry
- Table F.4 Indexes of unit labour cost by industry
Information on methods and data quality available in the Integrated Meta Data Base: 5042.

