2 Trend in offshoring and outsourcing

Archived Content
Information identified as archived is provided for reference, research or recordkeeping purposes. It is not subject to the Government of Canada Web Standards and has not been altered or updated since it was archived. Please "contact us" to request a format other than those available.
The term 'offshoring' or 'foreign outsourcing' implies shifts in intra-firm or intra-plant supplies to outside providers in a foreign country. The consequence of such a decision is the reallocation of jobs and production to a foreign country. The term 'outsourcing' includes both offshoring and domestic outsourcing which takes place when outside providers are located in the same country. Outsourcing does not necessarily imply that jobs and production are relocated to another country (Garner 2004).1
Outsourcing increases the amount of churn in an economic system. It will lead to each firm producing a small part of the final product. When disintegration in the economic process takes place, a firm purchases more of its inputs and creates less value added in the total production chain by itself.
The input–output tables that are associated with the National Accounts produce estimates of gross value of output of all firms, the difference between output and input costs (termed value added) and the value of inputs purchased. Increased disintegration does not change the amount of value added produced across all firms, but it does increase the value of goods purchased and sold in total. Industries that are completely integrated will purchase nothing and only sell a final product. If the same industry is divided into many firms where each firm produces only a small part of the total product and ships on to the next firm, the total value of sales that are registered in the input–output tables will increase, as will the volume of inputs purchased, but the total value added will remain unchanged (unless productivity falls).
Changes in the degree of integration in the economic system then are revealed by changes in the ratio of inputs to outputs, or value added to shipments at the industry level and these will form the measure of outsourcing examined here.
For offshoring, we adopt the measure suggested by Feenstra and Hanson (1996, 1999):
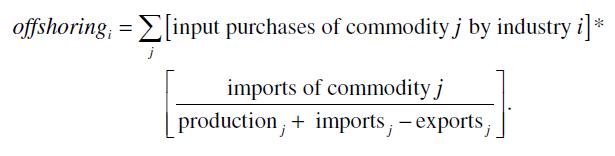
The second term in brackets is the average share of imports in domestic use across all users including industries, individuals and the public administration sector. The estimates of imported intermediate inputs by industry are based on the assumption that the average import share applies to all users.
This constant-import-share assumption will provide a good estimate of the size of offshoring for a commodity, if the commodity is mainly used for intermediate consumption. But the industry distribution of offshoring depends upon whether industries using the commodity have similar import propensities. Yuskavage, Strassner and Medeiros (2006) have compared the industry distribution of the resulting estimate of business services imports with a survey estimate. The two measures are quite similar when industries are defined at an aggregate level.
2.1 Outsourcing and offshoring in the aggregate business sector
Changes in material outsourcing and service outsourcing
Intermediate input as a fraction of nominal gross output in the Canadian business sector is plotted in Figure 1. Intermediate input is divided into materials, purchased services and energy inputs. The material input represents all commodity inputs exclusive of fuel (electricity, fuel oil, coal, natural gas and other miscellaneous fuels) but inclusive of fuel-type inputs used as raw materials in a manufacturing process, such as crude petroleum used by the refining industry. The service input consists of the following nine types: communications; finance and insurance; real estate rental; hotel services; repair services; business services, including equipment rental, engineering and technical services, and advertising; vehicle repair; medical and educational services; and purchases from government enterprises. The energy input represents the various fuels purchased for use as heat or power including electricity, fuel oil, coal, natural gas, and other miscellaneous fuels.
Figure 1
The share of intermediate inputs in gross output in the business
sector
The share of intermediate inputs in the Canadian business sector shows a slight increase over time. Intermediate inputs accounted for 48.5% of gross output in 1961. In 2003, it accounted for 52.0%. This represents a 3.5-percentage-point increase from 1961 to 2003.
The purchased service inputs as a fraction of gross output showed a large increase over the period: it rose from 10.9% in 1961 to 20.9% in 2003—a 10.0-percentage-point increase over the period.
The share of purchased services increased in almost all industries, except in the miscellaneous manufacturing sector (see Appendix Table A.1). The industries with the largest growth are mostly within the service sector.
To ascertain if the share of purchased services increased because of a shift in industry composition, we decomposed the total change into two components: one from the changes in the service-input share taking place within industries, holding constant the industry composition; and the other from the shifts in the industry composition (Table 1). The results show that the increase in the service-input share within industries accounted for a 7.8-percentage-point increase or 78% of the change in the aggregate share of service inputs in output. The remaining 2.2-percentage- point change came from shifts in the industry composition of gross output toward services industries with relatively high service-input shares.
Material inputs, as a fraction of gross output in the aggregate business sector, declined over time—from 34.6% in 1961 to 27.6% in 2003. The 7.9-percentage-point decline was mostly the result of a shift in the composition of output toward services-producing industries with low material-input share (as shown in Table 1). The within-industry contribution to the changes in the aggregate share of material inputs was small. This indicates that there were few changes in the share of material inputs in gross output at the industry level (see also Appendix Table A.2 that confirms this).
The cost of energy inputs was a small share of gross output in the aggregate business sector. It increased over the period from 1961 to the early 1980s and then declined afterwards. Over the period 1961 to 2002, the share of energy inputs in gross output rose from 3.0% to 3.5%. The increase in the aggregate energy-input share is a result of increases taking place at the industry level.
In summary, while concern about material outsourcing has been expressed, there has been little change in the ratio of material inputs to gross output across the Canadian industries over the 1961-to-2003 period. There is little evidence that changes in the boundary of the average firm is occurring when it comes to materials purchases.
However, there has been a trend to service outsourcing. Service outsourcing has shown a dramatic increase across Canadian industries. Over the 1961-to-2003 period, the share of purchased services in gross output doubled.
Changes in material offshoring and service offshoring
Trends in the import share of material and service inputs in the aggregate business sector are plotted in Figure 2. With post-Second World War trade liberalization, there has been a steady growth in the offshoring of material and service inputs over time. Canadian industries have purchased an increasing share of material and service inputs from abroad. The share of imports in total material and service inputs increased from 16.2% to 24.9% over the 1961-to-2003 period.2
Figure 2
Import share of service and material inputs in the business sector,
1961 to 2003
The share of imports in intermediate inputs can be decomposed into two components. The first component reflects the effect of changes in the share of imports in intermediate inputs at the industry level, holding constant the industry distribution of intermediate inputs. It is positive if there is an increase in the share of imports in intermediate inputs at the industry level. The second component represents the effect of shifts in the industry composition of intermediate inputs, holding constant the share of imports in intermediate inputs at the industry level. It is positive if there is a shift in the share of intermediate inputs toward the industries with relatively high import share of intermediate inputs.3
The results in Table 2 show that the increase in the share of imports in intermediate inputs in the total business sector is entirely due to the increase in the share of imports in intermediate inputs at the industry level over the period from 1961 to 2003. of the 8.8-percentage-point increase in the import share of total material and service inputs over the period, the increase in the import share of intermediate inputs within industries contributed 9.5-percentage-points of the increase (Table 2). The shift in industry composition made a small and negative contribution to the overall changes.
The increase in import shares occurred for both material and service inputs. The share of imports in material inputs almost doubled, while the share of imports in service inputs almost tripled from 1961 to 2003. During that period, the import share rose from 20.5% to 38.0% for material inputs, while it rose from 2.6% to 7.6% for service inputs.
Over the 1961-to-2003 period, the import share of materials and the import share of service inputs both increased in almost all industries (Appendix Tables A.1 and A.2). The import share of material inputs increased by an average of 17.5 percentage points, while the import share of service inputs rose by 5.0 percentage points.
Most offshoring activities are in material inputs. Service offshoring is still at a relatively low level compared with material offshoring. In 2003, service-input imports were about 15% of material-input imports (Figure 3). But service offshoring is growing much more rapidly than material offshoring. From 1961 to 2003, the imports of service inputs increased at a rate 11.9% per year, while the imports of material inputs increased at a rate of 8.8% per year.
Figure 3
Ratio of service-input imports to material-input imports in the
business sector
Types of services being offshored
The trends in service offshoring since 1961 by types of service inputs are graphed in Figure 4. Service offshoring is calculated as the share of imported services in total material and service inputs.
We have divided service inputs into five main categories, plus a residual other service category. The five categories are: business services, except software and computer services; financial services; insurance; communication; and, software and computer services. Business services consist of (1) engineering, scientific, accounting and legal services; (2) software and computer services; (3) advertising services; and (4) other services to business. The financial services consist of other financial intermediation and real estate services, and imputed service charges, banks and other deposit-accepting intermediaries.
Figure 4
Service imports in total material and service inputs by type in the
business sector
Figure 4 shows that service offshoring increased in all five categories of service inputs over the 1961-to-2003 period. The share of imported business services in total material and service inputs increased from 0.3% to 1.3% over the period (Figure 4). The share of imported financial services rose from 0.1% of total non-energy inputs to 0.8%. The share also increased for insurance, communication, software and computer services, but the increase was much smaller here.
The increase in the share of imported service inputs in total material and service inputs is a result of both an increase in import intensity and an increase in the share of services inputs in total material and service inputs for all main categories of service inputs, except for business services.4 The import intensity of business services was virtually unchanged over time (Table 3).
As shown in Figure 4, business services represent the largest category of service inputs being offshored by Canadian industries, followed by financial services, and insurance services. The offshoring of communication, software and computer services is less important.
While the overall level of service offshoring by Canadian industries is still fairly low, the practice has become quite significant for business services (excluding software and computer use), financial services, and insurance (Figure 5). From 2000 to 2003, 12.2% of business service input was imported from foreign countries, and 17.7% of insurance services and 9.6% of financial services were imported from abroad.
Figure 5
Import intensity by type of service inputs in the business sector,
1961 to 2003
Table 4 contains the top 15 categories of service inputs with the largest imports, according to the detailed commodity aggregation provided by the input–output tables. Various types of business services are among the top 10 categories of service inputs with the largest dollar value of imports. In 2003, Canadian industries offshored 7.3 billion dollars in business services, accounting for 25.7% of total service-input imports. The offshoring of engineering, scientific, accounting and legal services amounted to 4.0 billion dollars in 2003 and accounted for 14.0 % of total service imports. The offshoring of software and computer use, and advertising services was small.
Table 4
Imports and exports in services,1 2003
The business sector offshored 7.1 billion dollars in financial services in 2003, accounting for 25.3% of total services.
The offshoring of insurance services was 2.9 billion dollars in 2003. Together, the businesses services, financial services and insurance accounted for 78.5% of service offshoring by Canadian industries.
Table 4 also contains total imports and exports by categories of services, which covers total imports and exports by individuals, business sectors and non-business sectors. When imported service inputs are large relative to total imports, there is little final consumption. It is evident that the majority of imports in business services (lines 1, 2, 3 and 5) are for intermediate use by industries of the business sector. Only a small portion of imports in business services was for personal consumption and intermediate consumption by the non-business sector.
About 55% of total imports in financial and insurance services are used for intermediate inputs (offshoring).
Services offshoring by trading partners
The distribution of imports in commercial services by trading partners is presented in Table 5. Imports in commercial services include those used for intermediate inputs (or service offshoring) as well as those used for individual and government consumption. Since most commercial service imports are used for intermediate inputs by the business sector, its distribution by trading partners provides a reasonable indicator of the main providers of service offshoring in Canada.
Table 5
The share of services imports by trading partners
Most Canadian offshoring of services is with the United States and the other high-wage countries. Service offshoring to low-wage countries represents a small portion of service offshoring in Canada, but it has increased its share over time. The share of commercial services imports originating from non-OECD (Organisation for Economic Co-operation and Development) or non-European countries, which include China, India and other low-wage countries, increased from 6.0% in 1973 to 10.9% in 2003.
From 1990 to 2005, the share of service imports from the low-wage countries was virtually unchanged. This is in a sharp contrast to material imports from low-wage countries. Over the last 15 years, the share of material imports from low-wage countries showed a dramatic increase (Goldfarb and Beckman 2007).
2.2 Outsourcing and offshoring at the industry level
In this section, we present trends in offshoring and outsourcing at the industry level. For this purpose, we have divided the business sector into three major sectors: two goods-producing sectors (the primary and construction sector, and the manufacturing sector); and service- producing sectors.
Trends in outsourcing in major sectors
Trends in outsourcing of materials and services inputs are presented in Table 6. To examine if the trend has changed over time, we have divided the 1961-to-2003 period into two of equal length: 1961 to 1982 and 1982 to 2003.
The share of material and service inputs in gross output was highest in the manufacturing sector, and was the lowest in the services sector. In 2003, the cost of material and services input accounted for 66.0% of gross output in the manufacturing sector. It accounted for 38.0% of gross output in the service sector. But the service sector experienced the highest growth in non-energy intermediate input intensity over time. Further, the growth was accelerating over time. For the 1961-to-2003 period, the share of material and service inputs increased from 29.0% to 38.0%, which represents a 9.0-percentage-point increase. Most of the growth in the non-energy intermediate inputs occurred in the second half of the period. Changes in technology or changes in the types of products that were needed for the production of output in the service sector has led to more radical changes in the nature of firm boundaries in the service sector.
The composition of non-energy intermediate inputs differed by industry. In the service sector, most of non-energy intermediate inputs represent the cost of purchased services. In contrast, most of non-energy intermediate inputs in the goods sector come from material inputs. Purchased services accounted for 83.0% of total non-energy inputs in the services sector in 2003. It accounted for 29.5% of total non-energy inputs in the primary and construction sector and 15.8% in the manufacturing sector.
There has been a steady increase in the share of service inputs in the goods-producing and service-producing sectors. The share of services inputs in total non-energy inputs increased from 62.5% to 83.0% in the service sector over the 1961-to-2003 period. It rose from 14.9% to 29.5% in the primary and construction sector over the period.
The share of services inputs in total non-energy inputs rose from 11.7% to 15.8% in the manufacturing sector. Most of the increase occurred after the early 1980s. Since the early 1980s, manufacturing firms have increasingly outsourced less efficient service activities in order to focus on their core competencies (Siegel and Griliches 1992; Fixler and Siegel 1999).
Trend in offshoring in the major sectors
Trends in offshoring are presented in Table 7 for the three major sectors: primary and construction; manufacturing; and services. Service offshoring is mostly in the service-producing sectors, and it has also grown the fastest in the services sector (Figure 6). In 2003, service offshoring in the service sector accounted for 70.0% of overall service offshoring in Canada (Table 8).
Table 7
The percentage share of imports in intermediate inputs by major
sectors, 1961, 1982 and 2003
Material offshoring is largest in the goods-producing sector, and it has grown the fastest in the goods sector (Figure 7). In 2003, imported material inputs in the services sector accounted for about 7.0% of overall imports in material inputs (Table 8). The low level of material offshoring in the service sector is due to a small share of material inputs in the service sector.5
Figure 6
Share of imported services in total material and service inputs by
sector, 1961 to 2003
1 There is no commonly accepted definition of offshoring in the public debate or in the economic literature. The definition we have adopted is used in most empirical studies on offshoring (Olsen 2006).
2 There has been a decline in the share of imported material inputs since the late 1990s, possibly due to the appreciation of the Canadian dollar that has made imports to Canada more expensive.
3 This is the standard shift-share analysis.
4 Changes in the share of imported services in total inputs can be decomposed into two components. The first component is the effect of the changes in import intensity, which is calculated as the changes in the shares of imports in services inputs times the average share of services inputs in total inputs. The second component represents the effect of changes in the share of service input in total inputs, calculated as the changes in the share of service inputs in total inputs times the average share of imports in service inputs.
5 The import intensity (share of imported services in total services inputs) is similar between the manufacturing and services sectors.
- Date modified: