
Research Highlights on Health and Aging

Archived Content
Information identified as archived is provided for reference, research or recordkeeping purposes. It is not subject to the Government of Canada Web Standards and has not been altered or updated since it was archived. Please "contact us" to request a format other than those available.
Presentation to the National Statistics Council
October 30, 2015
Claudia Sanmartin
Health Analysis Division
Analytical Studies Branch
The following presentation was given by Statistics Canada's Health Analysis Division (HAD) at the National Statistics Council Meeting in October 2015 to highlight recent research findings related to aging and health. Canada, like other countries, has an aging population. This has significant implications for the health of Canadians and the health care services they will need in the future. Over the past several years, health research related to aging has focused on key areas such as chronic diseases, social isolation and more recently, transitions to institutional care. Through its health research program, Statistics Canada will continue to address important information gaps related to aging and institutional care, including a better understanding of long-term care needs and the mental health of seniors.
Outline
- Context: Population profile
- Research findings
Population profile
People aged 65 and over represent a large and growing proportion of the population
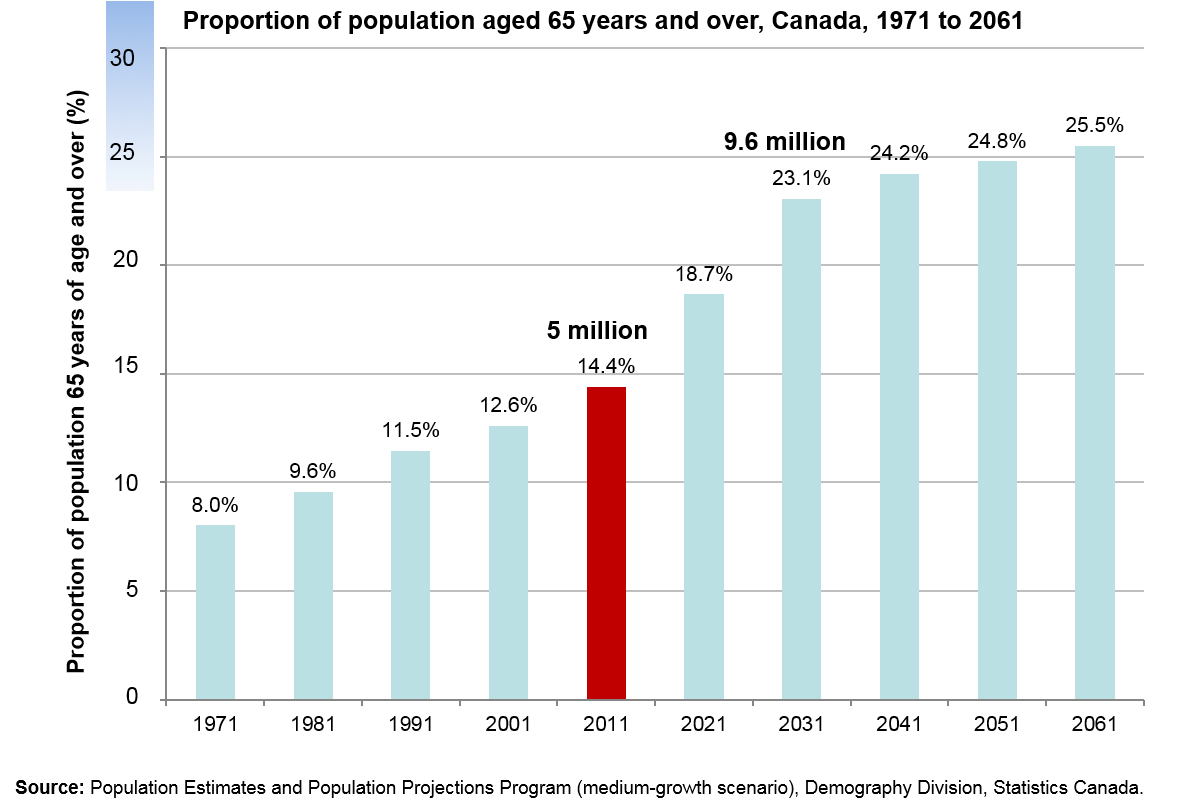
Description for Chart 1
| Year | Proportion of population 65+ years of age (%) |
|---|---|
| Source: Population Estimates and Population Projections (medium-growth scenario) Program, Demography Division, Statistics Canada. | |
| 1971 | 8.0 |
| 1981 | 9.6 |
| 1991 | 11.5 |
| 2001 | 12.6 |
| 2011 | 14.4 |
| 2021 | 18.7 |
| 2031 | 23.1 |
| 2041 | 24.2 |
| 2051 | 24.8 |
| 2061 | 25.5 |
People aged 80 and over also represent a large and growing proportion of seniors

Description for Chart 2
| Year | 65 to 79 | 80 and over |
|---|---|---|
| Source: Population Estimates and Population Projections Program (medium-growth scenario), Demography Division, Statistics Canada. | ||
| 1971 | 1,417.169 | 345.241 |
| 1981 | 1,922.934 | 454.029 |
| 1991 | 2,543.265 | 669.223 |
| 2001 | 2,981.084 | 931.206 |
| 2011 | 3,606.100 | 1,344.210 |
| 2021 | 5,359.199 | 1,738.223 |
| 2031 | 6,853.506 | 2,685.574 |
| 2041 | 6,786.329 | 3,951.490 |
| 2051 | 7,146.060 | 4,547.040 |
| 2061 | 8,003.698 | 4,815.046 |
Growing number of seniors living in the community
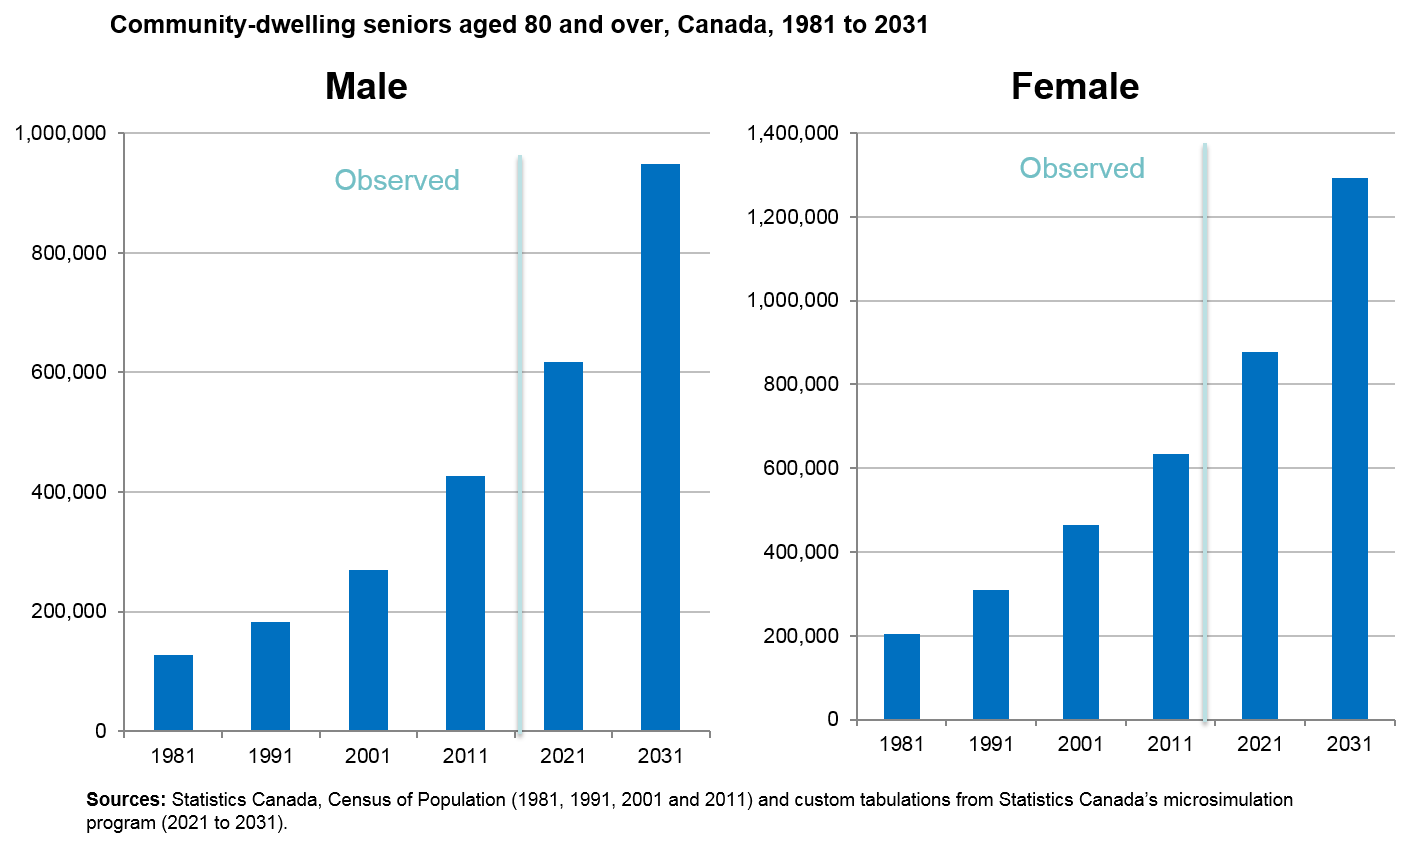
Description for Chart 3
| Year | Male population |
|---|---|
| Source: Statistics Canada, Censuses of Population (1981-1991-2001-2011) and custom tabulations from LifePaths microsimulation model (2021-2031). | |
| 1981 | 126,835 |
| 1991 | 182,505 |
| 2001 | 269,405 |
| 2011 | 426,165 |
| 2021 | 617,528 |
| 2031 | 948,141 |
| Year | Female population |
|---|---|
| Source: Statistics Canada, Censuses of Population (1981-1991-2001-2011) and custom tabulations from LifePaths microsimulation model (2021-2031). | |
| 1981 | 204,480 |
| 1991 | 308,615 |
| 2001 | 464,060 |
| 2011 | 634,405 |
| 2021 | 878,052 |
| 2031 | 1,293,201 |
Majority of those aged 65 and over live in the community, but 7% live in special care facilities—long-term and residential care facilities
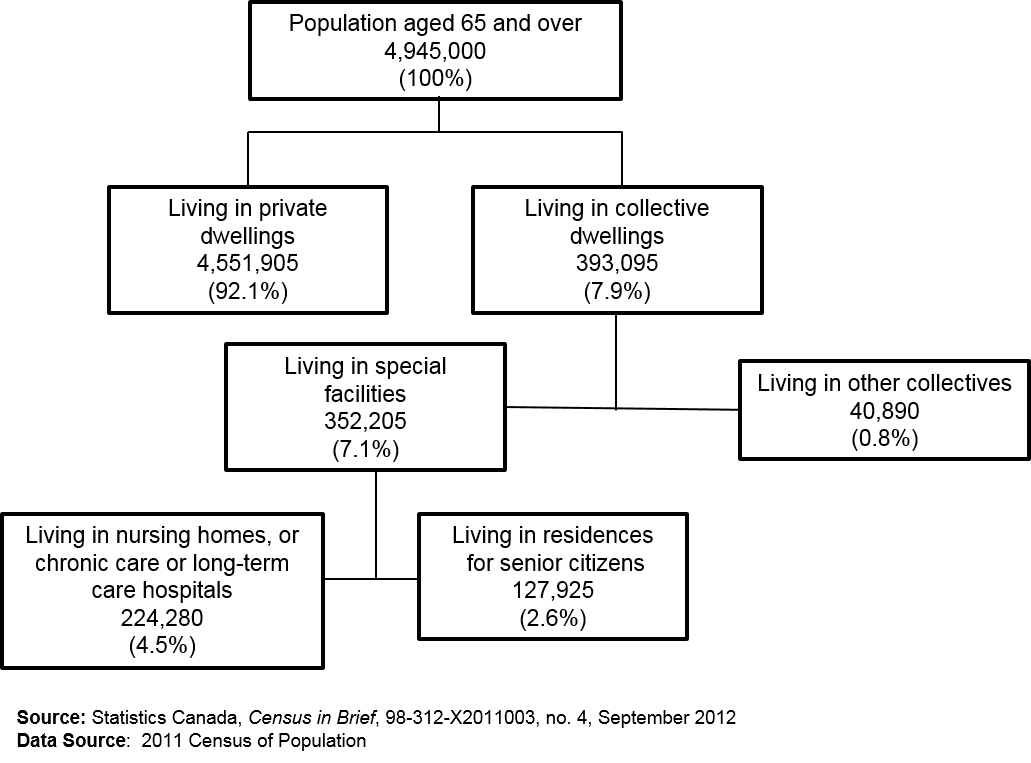
Description for Chart 4
- Population aged 65 and over 4,945,000 (100%)
- Living in private dwellings 4,551,905 (92.1%)
- Living in collective dwellings 393,095 (7.9%)
- Living in special facilities 352,205 (7.1%)
- Living in nursing homes, or chronic care or long-term care hospitals 224,280 (4.5%)
- Living in residences for senior citizens 127,925 (2.6%)
- Living in other collectives 40,890 (0.8%)
- Living in special facilities 352,205 (7.1%)
Source: Statistics Canada, Census in Brief, 98-312-X2011003, no. 4, September 2012
Data Source: 2011 Census of Population
Chronic conditions
Eight chronic conditions are prevalent in more than 10% of the population aged 65 and over
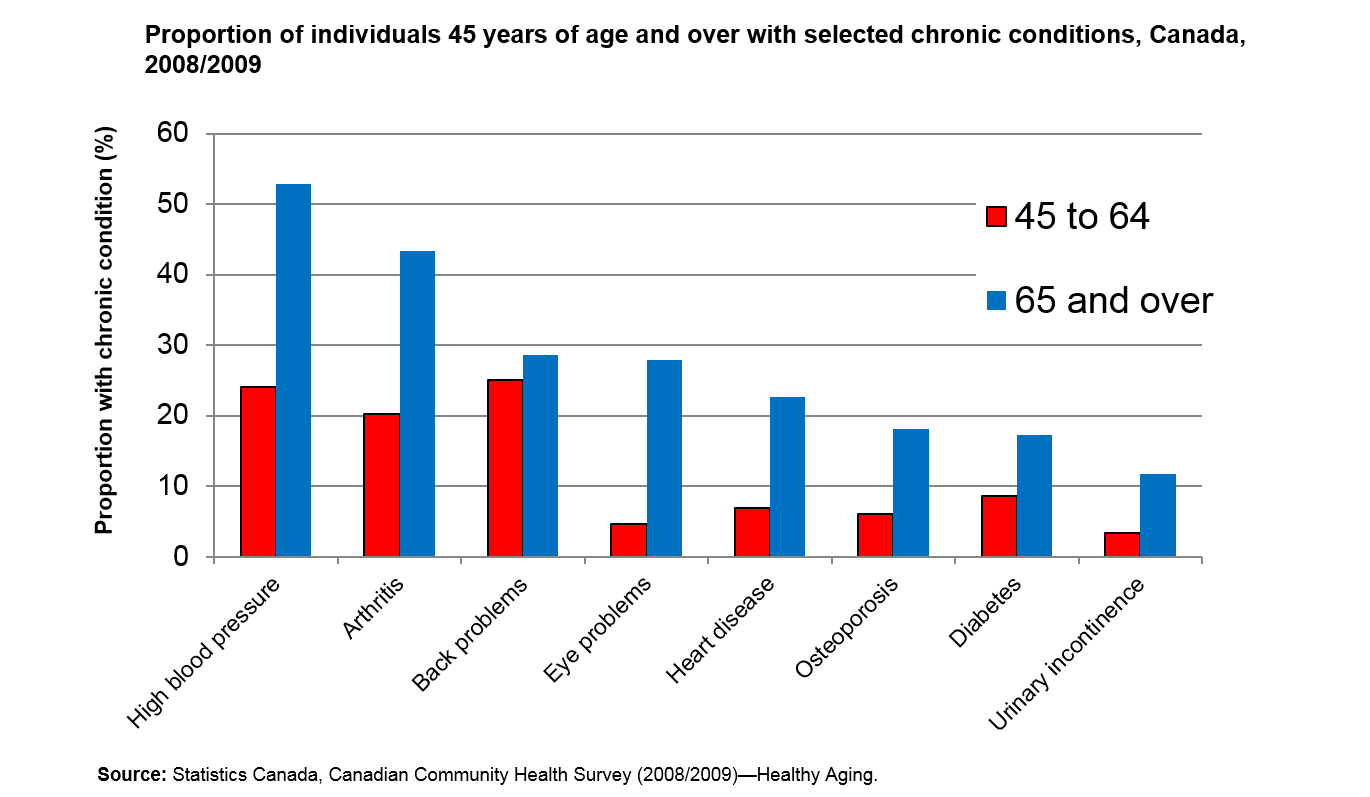
Description for Chart 5
| Chronic conditions | 45 to 64 | 65 or older |
|---|---|---|
| Source: Statistics Canada, Canadian Community Health Survey (2008/2009)— Healthy Aging | ||
| High blood pressure | 24.0% | 52.9% |
| Arthritis | 20.3% | 43.4% |
| Back problems | 25.0% | 28.6% |
| Eye problems | 4.6% | 27.9% |
| Heart disease | 6.9% | 22.6% |
| Osteoporosis | 6.1% | 18.1% |
| Diabetes | 8.6% | 17.2% |
| Urinary incontinence | 3.3% | 11.7% |
Many of those over 50 years of age are living with multiple chronic conditions

Description for Chart 6
| Number of chronic conditions | 51 to 60 | 61 to 70 | 71 and over |
|---|---|---|---|
| Source: Canadian Community Health Survey. (2008/2009) | |||
| One only | 31% | 34% | 32% |
| Two | 13% | 22% | 29% |
| Three or more | 6% | 12% | 21% |
Urinary incontinence associated with higher levels of loneliness
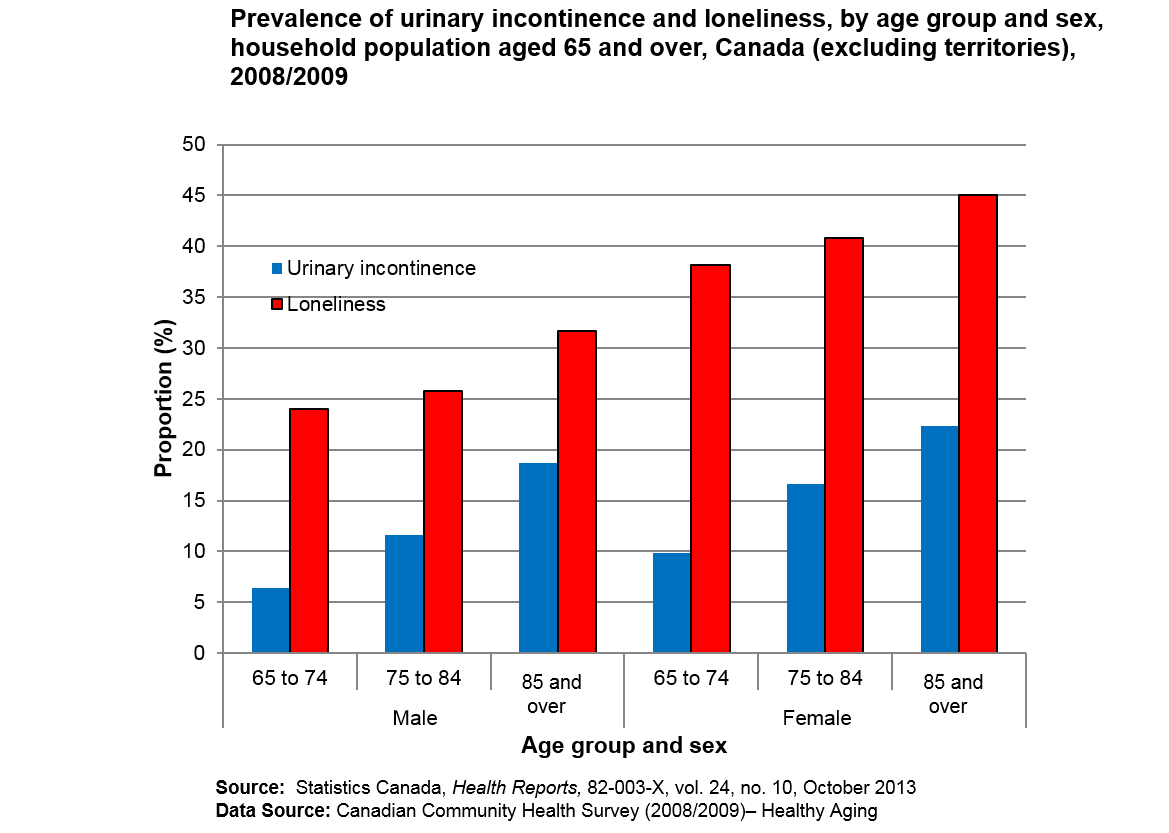
Description for Chart 7
| Age Group | Men | Women |
|---|---|---|
| Source: Statistics Canada, Health Reports, 82-003-X, vol 24 no. 10 October 2013 Data source: Canadian Community Health Survey (2008/2009)-Healthy Aging |
||
| Urinary Incontinence | ||
| 65 to 74 | 6.4 | 9.8 |
| 75 to 84 | 11.6 | 16.6 |
| 85 and over | 18.7 | 22.3 |
| Loneliness | ||
| 65 to 74 | 24.0 | 38.2 |
| 75 to 84 | 25.8 | 40.8 |
| 85 and over | 31.7 | 45.0 |
Lifestyle factors
Four or more healthy behaviours associated with higher rates of good health among those aged 65 and over
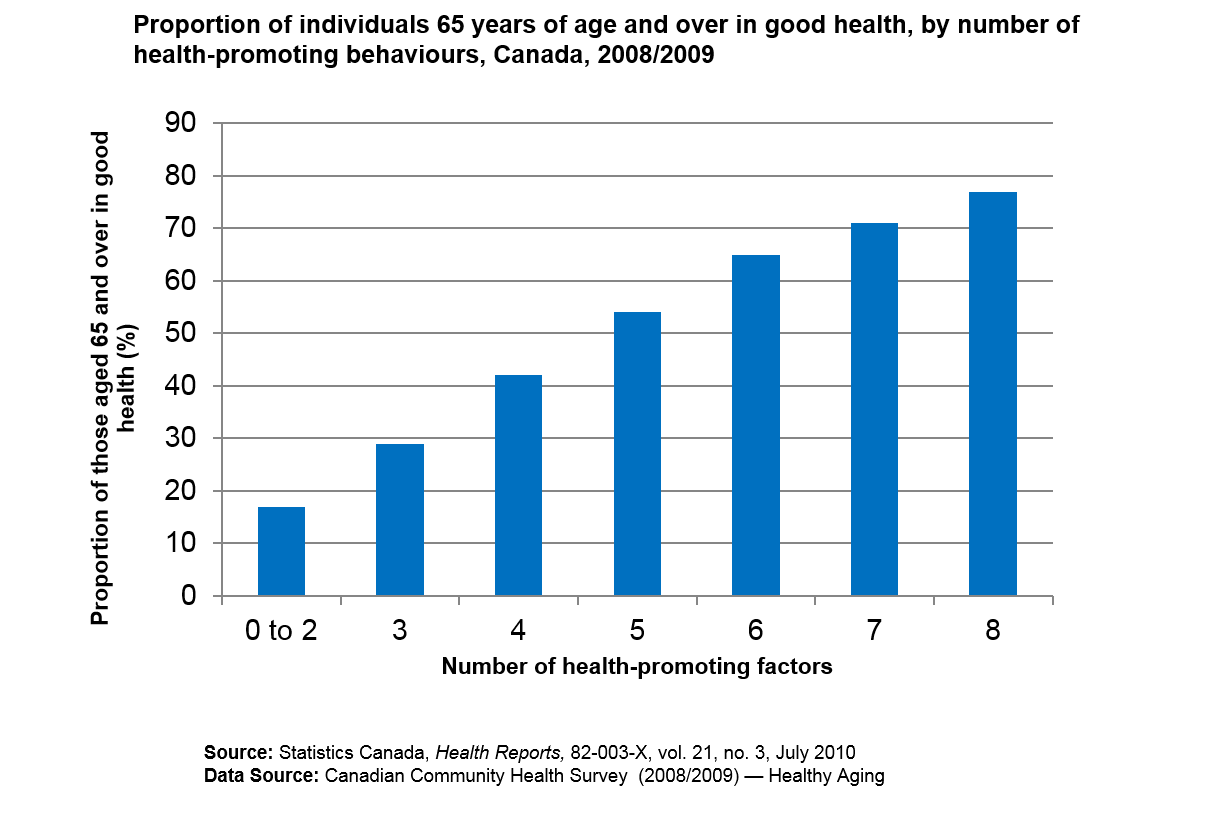
Description for Chart 8
| Number of health-promoting factors | Proportion of those aged 65 and over in good health (%) |
|---|---|
| Source: Statistics Canada, Health Reports, 82-003-X, vol 21 no. 3 July 2010 Data source: Canadian Community Health Survey (2008/2009)-Healthy Aging |
|
| 0 to 2 | 17 |
| 3 | 29 |
| 4 | 42 |
| 5 | 54 |
| 6 | 65 |
| 7 | 71 |
| 8 | 77 |
Nutrition
Omega-3 levels highest among older Canadians—less likely to be at high risk for coronary heart disease (CHD)

Description for Chart 9
| Age Group | High risk of CHD < 4% | Moderate risk of CHD 4 to 8% |
|---|---|---|
| Sources: Statistics Canada, Health Reports, 82-003-X, vol. 26 no. 11, November 2015 Data Source: Canadian Health Measures Survey (2012/2013) |
||
| 20 to 39 | 50.09 | 49.21 |
| 40 to 59 | 45.35 | 52.21 |
| 60 to 79 | 26.30 | 67.56 |
Environment
No association of blood lead level with hypertension

Description for Chart 10
| Age Group | Hypertensive | Non-hypertensive |
|---|---|---|
| Source: Statistics Canada, Health Reports, 82-003-X, vol. 25, no. 7, July 2014 Data Source: Canadian Health Measures Survey (2007 to 2011). |
||
| Total 40 to 79 | 1.61 | 1.65 |
| 40 to 54 | 1.35 | 1.46 |
| 55 to 79 | 1.91 | 1.86 |
| Male, 40 to 79 | 1.78 | 1.84 |
| Female, 40 to 79 | 1.47 | 1.49 |
Modest link between blood lead levels and blood pressure
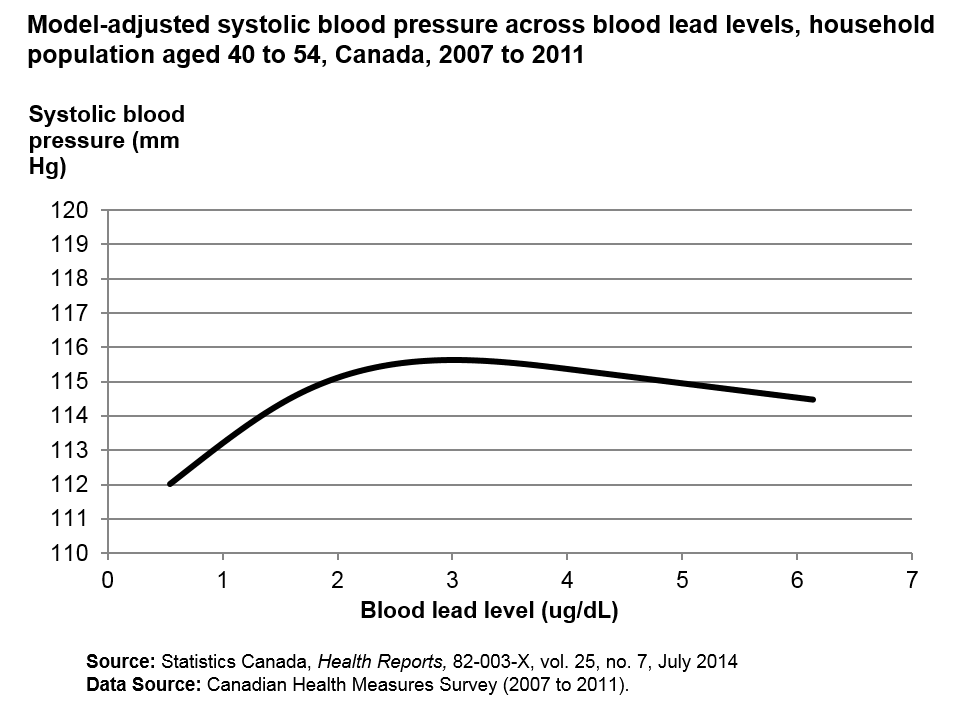
Description for Chart 11
| Blood lead level (ug/dL) | Systolic blood pressure (mm Hg) |
|---|---|
| Source: Statistics Canada, Health Reports, 82-003-X, vol. 25, no. 7, Jul 2014 Data Source: Canadian Health Measures Survey (2007 to 2011). |
|
| 0.00 | 110.60 |
| 0.05 | 110.73 |
| 0.10 | 110.86 |
| 0.15 | 110.99 |
| 0.20 | 111.13 |
| 0.25 | 111.26 |
| 0.30 | 111.39 |
| 0.35 | 111.52 |
| 0.40 | 111.65 |
| 0.45 | 111.78 |
| 0.50 | 111.91 |
| 0.51 | 111.94 |
| 0.52 | 111.97 |
| 0.53 | 111.99 |
| 0.54 | 112.02 |
| 0.55 | 112.05 |
| 0.56 | 112.07 |
| 0.57 | 112.10 |
| 0.58 | 112.12 |
| 0.59 | 112.15 |
| 0.60 | 112.18 |
| 0.61 | 112.20 |
| 0.62 | 112.23 |
| 0.63 | 112.26 |
| 0.64 | 112.28 |
| 0.65 | 112.31 |
| 0.66 | 112.33 |
| 0.67 | 112.36 |
| 0.68 | 112.39 |
| 0.69 | 112.41 |
| 0.70 | 112.44 |
| 0.71 | 112.47 |
| 0.72 | 112.49 |
| 0.73 | 112.52 |
| 0.74 | 112.54 |
| 0.75 | 112.57 |
| 0.76 | 112.60 |
| 0.77 | 112.62 |
| 0.78 | 112.65 |
| 0.79 | 112.68 |
| 0.80 | 112.70 |
| 0.81 | 112.73 |
| 0.82 | 112.75 |
| 0.83 | 112.78 |
| 0.84 | 112.81 |
| 0.85 | 112.83 |
| 0.86 | 112.86 |
| 0.87 | 112.88 |
| 0.88 | 112.91 |
| 0.89 | 112.93 |
| 0.90 | 112.96 |
| 0.91 | 112.99 |
| 0.92 | 113.01 |
| 0.93 | 113.04 |
| 0.94 | 113.06 |
| 0.95 | 113.09 |
| 0.96 | 113.11 |
| 0.97 | 113.14 |
| 0.98 | 113.16 |
| 0.99 | 113.19 |
| 1.00 | 113.21 |
| 1.01 | 113.24 |
| 1.02 | 113.26 |
| 1.03 | 113.29 |
| 1.04 | 113.31 |
| 1.05 | 113.34 |
| 1.06 | 113.36 |
| 1.07 | 113.39 |
| 1.08 | 113.41 |
| 1.09 | 113.44 |
| 1.10 | 113.46 |
| 1.11 | 113.49 |
| 1.12 | 113.51 |
| 1.13 | 113.54 |
| 1.14 | 113.56 |
| 1.15 | 113.58 |
| 1.16 | 113.61 |
| 1.17 | 113.63 |
| 1.18 | 113.65 |
| 1.19 | 113.68 |
| 1.20 | 113.70 |
| 1.21 | 113.73 |
| 1.22 | 113.75 |
| 1.23 | 113.77 |
| 1.24 | 113.80 |
| 1.25 | 113.82 |
| 1.26 | 113.84 |
| 1.27 | 113.86 |
| 1.28 | 113.89 |
| 1.29 | 113.91 |
| 1.30 | 113.93 |
| 1.31 | 113.95 |
| 1.32 | 113.98 |
| 1.33 | 114.00 |
| 1.34 | 114.02 |
| 1.35 | 114.04 |
| 1.36 | 114.06 |
| 1.37 | 114.08 |
| 1.38 | 114.11 |
| 1.39 | 114.13 |
| 1.40 | 114.15 |
| 1.41 | 114.17 |
| 1.42 | 114.19 |
| 1.43 | 114.21 |
| 1.44 | 114.23 |
| 1.45 | 114.25 |
| 1.46 | 114.27 |
| 1.47 | 114.29 |
| 1.48 | 114.31 |
| 1.49 | 114.33 |
| 1.50 | 114.35 |
| 1.51 | 114.37 |
| 1.52 | 114.39 |
| 1.53 | 114.41 |
| 1.54 | 114.43 |
| 1.55 | 114.45 |
| 1.56 | 114.47 |
| 1.57 | 114.48 |
| 1.58 | 114.50 |
| 1.59 | 114.52 |
| 1.60 | 114.54 |
| 1.61 | 114.56 |
| 1.62 | 114.57 |
| 1.63 | 114.59 |
| 1.64 | 114.61 |
| 1.65 | 114.63 |
| 1.66 | 114.64 |
| 1.67 | 114.66 |
| 1.68 | 114.68 |
| 1.69 | 114.69 |
| 1.70 | 114.71 |
| 1.71 | 114.73 |
| 1.72 | 114.74 |
| 1.73 | 114.76 |
| 1.74 | 114.77 |
| 1.75 | 114.79 |
| 1.76 | 114.80 |
| 1.77 | 114.82 |
| 1.78 | 114.83 |
| 1.79 | 114.85 |
| 1.80 | 114.86 |
| 1.81 | 114.88 |
| 1.82 | 114.89 |
| 1.83 | 114.91 |
| 1.84 | 114.92 |
| 1.85 | 114.93 |
| 1.86 | 114.95 |
| 1.87 | 114.96 |
| 1.88 | 114.97 |
| 1.89 | 114.99 |
| 1.90 | 115.00 |
| 1.91 | 115.01 |
| 1.92 | 115.03 |
| 1.93 | 115.04 |
| 1.94 | 115.05 |
| 1.95 | 115.06 |
| 1.96 | 115.07 |
| 1.97 | 115.09 |
| 1.98 | 115.10 |
| 1.99 | 115.11 |
| 2.00 | 115.12 |
| 2.01 | 115.13 |
| 2.02 | 115.14 |
| 2.03 | 115.15 |
| 2.04 | 115.17 |
| 2.05 | 115.18 |
| 2.06 | 115.19 |
| 2.07 | 115.20 |
| 2.08 | 115.21 |
| 2.09 | 115.22 |
| 2.10 | 115.23 |
| 2.11 | 115.24 |
| 2.12 | 115.25 |
| 2.13 | 115.26 |
| 2.14 | 115.27 |
| 2.15 | 115.28 |
| 2.16 | 115.29 |
| 2.17 | 115.29 |
| 2.18 | 115.30 |
| 2.19 | 115.31 |
| 2.20 | 115.32 |
| 2.21 | 115.33 |
| 2.22 | 115.34 |
| 2.23 | 115.35 |
| 2.24 | 115.35 |
| 2.25 | 115.36 |
| 2.26 | 115.37 |
| 2.27 | 115.38 |
| 2.28 | 115.38 |
| 2.29 | 115.39 |
| 2.30 | 115.40 |
| 2.31 | 115.41 |
| 2.32 | 115.41 |
| 2.33 | 115.42 |
| 2.34 | 115.43 |
| 2.35 | 115.43 |
| 2.36 | 115.44 |
| 2.37 | 115.45 |
| 2.38 | 115.45 |
| 2.39 | 115.46 |
| 2.40 | 115.47 |
| 2.41 | 115.47 |
| 2.42 | 115.48 |
| 2.43 | 115.48 |
| 2.44 | 115.49 |
| 2.45 | 115.49 |
| 2.46 | 115.50 |
| 2.47 | 115.51 |
| 2.48 | 115.51 |
| 2.49 | 115.52 |
| 2.50 | 115.52 |
| 2.51 | 115.53 |
| 2.52 | 115.53 |
| 2.53 | 115.53 |
| 2.54 | 115.54 |
| 2.55 | 115.54 |
| 2.56 | 115.55 |
| 2.57 | 115.55 |
| 2.58 | 115.56 |
| 2.59 | 115.56 |
| 2.60 | 115.56 |
| 2.61 | 115.57 |
| 2.62 | 115.57 |
| 2.63 | 115.57 |
| 2.64 | 115.58 |
| 2.65 | 115.58 |
| 2.66 | 115.58 |
| 2.67 | 115.59 |
| 2.68 | 115.59 |
| 2.69 | 115.59 |
| 2.70 | 115.60 |
| 2.71 | 115.60 |
| 2.72 | 115.60 |
| 2.73 | 115.60 |
| 2.74 | 115.61 |
| 2.75 | 115.61 |
| 2.76 | 115.61 |
| 2.77 | 115.61 |
| 2.78 | 115.61 |
| 2.79 | 115.62 |
| 2.80 | 115.62 |
| 2.81 | 115.62 |
| 2.82 | 115.62 |
| 2.83 | 115.62 |
| 2.84 | 115.62 |
| 2.85 | 115.63 |
| 2.86 | 115.63 |
| 2.87 | 115.63 |
| 2.88 | 115.63 |
| 2.89 | 115.63 |
| 2.90 | 115.63 |
| 2.91 | 115.63 |
| 2.92 | 115.63 |
| 2.93 | 115.63 |
| 2.94 | 115.63 |
| 2.95 | 115.64 |
| 2.96 | 115.64 |
| 2.97 | 115.64 |
| 2.98 | 115.64 |
| 2.99 | 115.64 |
| 3.00 | 115.64 |
| 3.01 | 115.64 |
| 3.02 | 115.64 |
| 3.03 | 115.64 |
| 3.04 | 115.64 |
| 3.05 | 115.64 |
| 3.06 | 115.64 |
| 3.07 | 115.64 |
| 3.08 | 115.64 |
| 3.09 | 115.63 |
| 3.10 | 115.63 |
| 3.11 | 115.63 |
| 3.12 | 115.63 |
| 3.13 | 115.63 |
| 3.14 | 115.63 |
| 3.15 | 115.63 |
| 3.16 | 115.63 |
| 3.17 | 115.63 |
| 3.18 | 115.63 |
| 3.19 | 115.63 |
| 3.20 | 115.62 |
| 3.21 | 115.62 |
| 3.22 | 115.62 |
| 3.23 | 115.62 |
| 3.24 | 115.62 |
| 3.25 | 115.62 |
| 3.26 | 115.62 |
| 3.27 | 115.61 |
| 3.28 | 115.61 |
| 3.29 | 115.61 |
| 3.30 | 115.61 |
| 3.31 | 115.61 |
| 3.32 | 115.60 |
| 3.33 | 115.60 |
| 3.34 | 115.60 |
| 3.35 | 115.60 |
| 3.36 | 115.60 |
| 3.37 | 115.59 |
| 3.38 | 115.59 |
| 3.39 | 115.59 |
| 3.40 | 115.59 |
| 3.41 | 115.58 |
| 3.42 | 115.58 |
| 3.43 | 115.58 |
| 3.44 | 115.58 |
| 3.45 | 115.57 |
| 3.46 | 115.57 |
| 3.47 | 115.57 |
| 3.48 | 115.56 |
| 3.49 | 115.56 |
| 3.50 | 115.56 |
| 3.51 | 115.56 |
| 3.52 | 115.55 |
| 3.53 | 115.55 |
| 3.54 | 115.55 |
| 3.55 | 115.54 |
| 3.56 | 115.54 |
| 3.57 | 115.54 |
| 3.58 | 115.53 |
| 3.59 | 115.53 |
| 3.60 | 115.53 |
| 3.61 | 115.52 |
| 3.62 | 115.52 |
| 3.63 | 115.52 |
| 3.64 | 115.51 |
| 3.65 | 115.51 |
| 3.66 | 115.51 |
| 3.67 | 115.50 |
| 3.68 | 115.50 |
| 3.69 | 115.50 |
| 3.70 | 115.49 |
| 3.71 | 115.49 |
| 3.72 | 115.49 |
| 3.73 | 115.48 |
| 3.74 | 115.48 |
| 3.75 | 115.48 |
| 3.76 | 115.47 |
| 3.77 | 115.47 |
| 3.78 | 115.46 |
| 3.79 | 115.46 |
| 3.80 | 115.46 |
| 3.81 | 115.45 |
| 3.82 | 115.45 |
| 3.83 | 115.44 |
| 3.84 | 115.44 |
| 3.85 | 115.44 |
| 3.86 | 115.43 |
| 3.87 | 115.43 |
| 3.88 | 115.42 |
| 3.89 | 115.42 |
| 3.90 | 115.42 |
| 3.91 | 115.41 |
| 3.92 | 115.41 |
| 3.93 | 115.40 |
| 3.94 | 115.40 |
| 3.95 | 115.40 |
| 3.96 | 115.39 |
| 3.97 | 115.39 |
| 3.98 | 115.38 |
| 3.99 | 115.38 |
| 4.00 | 115.38 |
| 4.01 | 115.37 |
| 4.02 | 115.37 |
| 4.03 | 115.36 |
| 4.04 | 115.36 |
| 4.05 | 115.35 |
| 4.06 | 115.35 |
| 4.07 | 115.35 |
| 4.08 | 115.34 |
| 4.09 | 115.34 |
| 4.10 | 115.33 |
| 4.11 | 115.33 |
| 4.12 | 115.33 |
| 4.13 | 115.32 |
| 4.14 | 115.32 |
| 4.15 | 115.31 |
| 4.16 | 115.31 |
| 4.17 | 115.30 |
| 4.18 | 115.30 |
| 4.19 | 115.30 |
| 4.20 | 115.29 |
| 4.21 | 115.29 |
| 4.22 | 115.28 |
| 4.23 | 115.28 |
| 4.24 | 115.28 |
| 4.25 | 115.27 |
| 4.26 | 115.27 |
| 4.27 | 115.26 |
| 4.28 | 115.26 |
| 4.29 | 115.25 |
| 4.30 | 115.25 |
| 4.31 | 115.25 |
| 4.32 | 115.24 |
| 4.33 | 115.24 |
| 4.34 | 115.23 |
| 4.35 | 115.23 |
| 4.36 | 115.23 |
| 4.37 | 115.22 |
| 4.38 | 115.22 |
| 4.39 | 115.21 |
| 4.40 | 115.21 |
| 4.41 | 115.20 |
| 4.42 | 115.20 |
| 4.43 | 115.20 |
| 4.44 | 115.19 |
| 4.45 | 115.19 |
| 4.46 | 115.18 |
| 4.47 | 115.18 |
| 4.48 | 115.18 |
| 4.49 | 115.17 |
| 4.50 | 115.17 |
| 4.51 | 115.16 |
| 4.52 | 115.16 |
| 4.53 | 115.15 |
| 4.54 | 115.15 |
| 4.55 | 115.15 |
| 4.56 | 115.14 |
| 4.57 | 115.14 |
| 4.58 | 115.13 |
| 4.59 | 115.13 |
| 4.60 | 115.13 |
| 4.61 | 115.12 |
| 4.62 | 115.12 |
| 4.63 | 115.11 |
| 4.64 | 115.11 |
| 4.65 | 115.10 |
| 4.66 | 115.10 |
| 4.67 | 115.10 |
| 4.68 | 115.09 |
| 4.69 | 115.09 |
| 4.70 | 115.08 |
| 4.71 | 115.08 |
| 4.72 | 115.07 |
| 4.73 | 115.07 |
| 4.74 | 115.07 |
| 4.75 | 115.06 |
| 4.76 | 115.06 |
| 4.77 | 115.05 |
| 4.78 | 115.05 |
| 4.79 | 115.05 |
| 4.80 | 115.04 |
| 4.81 | 115.04 |
| 4.82 | 115.03 |
| 4.83 | 115.03 |
| 4.84 | 115.02 |
| 4.85 | 115.02 |
| 4.86 | 115.02 |
| 4.87 | 115.01 |
| 4.88 | 115.01 |
| 4.89 | 115.00 |
| 4.90 | 115.00 |
| 4.91 | 115.00 |
| 4.92 | 114.99 |
| 4.93 | 114.99 |
| 4.94 | 114.98 |
| 4.95 | 114.98 |
| 4.96 | 114.97 |
| 4.97 | 114.97 |
| 4.98 | 114.97 |
| 4.99 | 114.96 |
| 5.00 | 114.96 |
| 5.01 | 114.95 |
| 5.02 | 114.95 |
| 5.03 | 114.95 |
| 5.04 | 114.94 |
| 5.05 | 114.94 |
| 5.06 | 114.93 |
| 5.07 | 114.93 |
| 5.08 | 114.92 |
| 5.09 | 114.92 |
| 5.10 | 114.92 |
| 5.11 | 114.91 |
| 5.12 | 114.91 |
| 5.13 | 114.90 |
| 5.14 | 114.90 |
| 5.15 | 114.90 |
| 5.16 | 114.89 |
| 5.17 | 114.89 |
| 5.18 | 114.88 |
| 5.19 | 114.88 |
| 5.20 | 114.87 |
| 5.21 | 114.87 |
| 5.22 | 114.87 |
| 5.23 | 114.86 |
| 5.24 | 114.86 |
| 5.25 | 114.85 |
| 5.26 | 114.85 |
| 5.27 | 114.85 |
| 5.28 | 114.84 |
| 5.29 | 114.84 |
| 5.30 | 114.83 |
| 5.31 | 114.83 |
| 5.32 | 114.82 |
| 5.33 | 114.82 |
| 5.34 | 114.82 |
| 5.35 | 114.81 |
| 5.36 | 114.81 |
| 5.37 | 114.80 |
| 5.38 | 114.80 |
| 5.39 | 114.79 |
| 5.40 | 114.79 |
| 5.41 | 114.79 |
| 5.42 | 114.78 |
| 5.43 | 114.78 |
| 5.44 | 114.77 |
| 5.45 | 114.77 |
| 5.46 | 114.77 |
| 5.47 | 114.76 |
| 5.48 | 114.76 |
| 5.49 | 114.75 |
| 5.50 | 114.75 |
| 5.51 | 114.74 |
| 5.52 | 114.74 |
| 5.53 | 114.74 |
| 5.54 | 114.73 |
| 5.55 | 114.73 |
| 5.56 | 114.72 |
| 5.57 | 114.72 |
| 5.58 | 114.72 |
| 5.59 | 114.71 |
| 5.60 | 114.71 |
| 5.61 | 114.70 |
| 5.62 | 114.70 |
| 5.63 | 114.69 |
| 5.64 | 114.69 |
| 5.65 | 114.69 |
| 5.66 | 114.68 |
| 5.67 | 114.68 |
| 5.68 | 114.67 |
| 5.69 | 114.67 |
| 5.70 | 114.67 |
| 5.71 | 114.66 |
| 5.72 | 114.66 |
| 5.73 | 114.65 |
| 5.74 | 114.65 |
| 5.75 | 114.64 |
| 5.76 | 114.64 |
| 5.77 | 114.64 |
| 5.78 | 114.63 |
| 5.79 | 114.63 |
| 5.80 | 114.62 |
| 5.81 | 114.62 |
| 5.82 | 114.62 |
| 5.83 | 114.61 |
| 5.84 | 114.61 |
| 5.85 | 114.60 |
| 5.86 | 114.60 |
| 5.87 | 114.59 |
| 5.88 | 114.59 |
| 5.89 | 114.59 |
| 5.90 | 114.58 |
| 5.91 | 114.58 |
| 5.92 | 114.57 |
| 5.93 | 114.57 |
| 5.94 | 114.57 |
| 5.95 | 114.56 |
| 5.96 | 114.56 |
| 5.97 | 114.55 |
| 5.98 | 114.55 |
| 5.99 | 114.54 |
| 6.00 | 114.54 |
| 6.01 | 114.54 |
| 6.02 | 114.53 |
| 6.03 | 114.53 |
| 6.04 | 114.52 |
| 6.05 | 114.52 |
| 6.06 | 114.51 |
| 6.07 | 114.51 |
| 6.08 | 114.51 |
| 6.09 | 114.50 |
| 6.10 | 114.50 |
| 6.11 | 114.49 |
| 6.12 | 114.49 |
| 6.13 | 114.49 |
| 6.14 | 114.48 |
Treatment
Evidence of underuse of statin treatment among those at high risk of cardiovascular disease
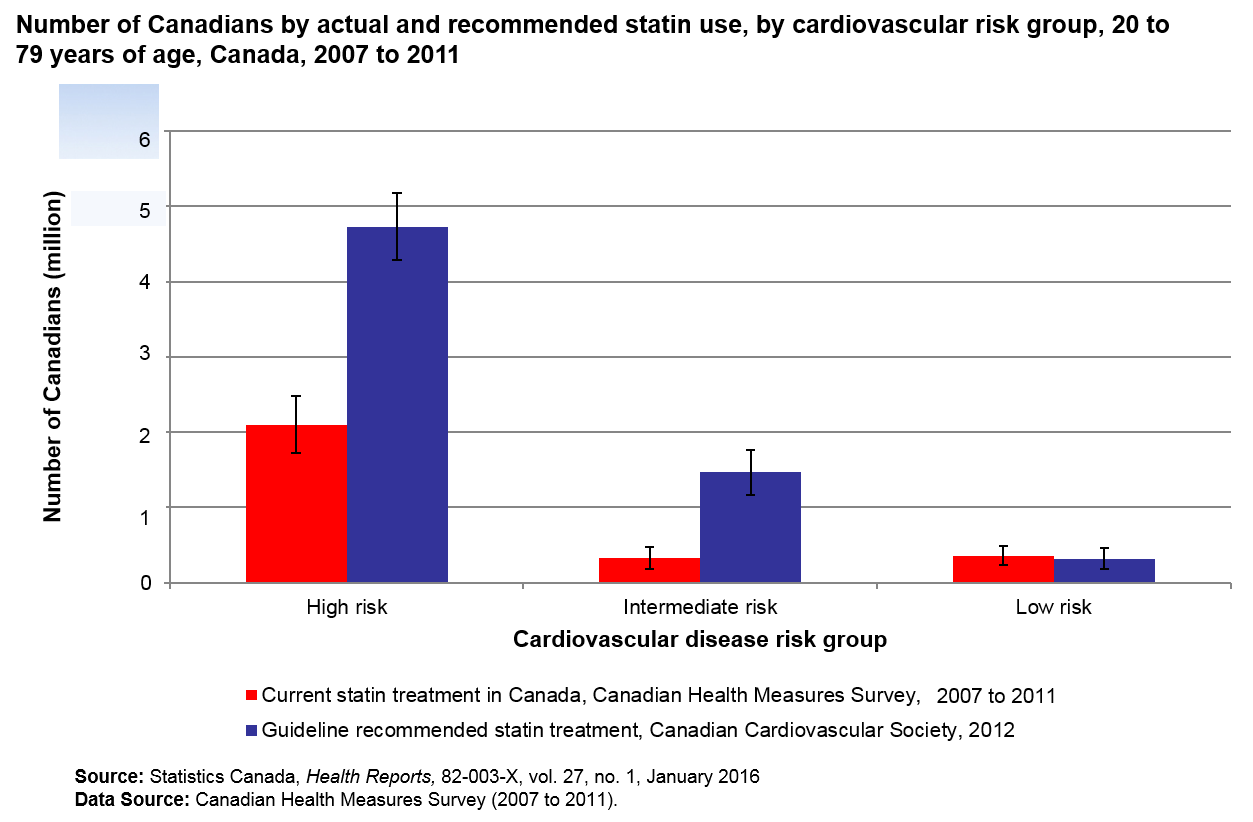
Description for Chart 12
| Risk | Current statin treatment in Canada, Canadian Health Measures Survey, 2007 to 2011 | Guideline recommended statin treatment, Canadian Cardiovascular Society, 2012 |
|---|---|---|
| Source: Statistics Canada, Health Reports, 82-003-X, vol. 27, no. 1, January 2016 Data Source: Canadian Health Measures Survey (2007 to 2011). |
||
| High risk | 2,101,876 | 4,729,580 |
| Intermediate risk | 323,594 | 1,467,193 |
| Low risk | 360,007 | 321,426 |
Health care use
Immigrant seniors less likely to be hospitalized for circulatory disease

Description for Chart 13
| Proportion of seniors (%) | |
|---|---|
| Source: Statistics Canada, Health Reports, 82-003-X, vol. 25, no. 10, October 2014 Data Source: Linked census–hospital discharge database, Ontario (2006 to 2009). |
|
| Canadian Born | 6.4 |
| Immigrants | 5.3 |
| Source Country | |
| Europe | 5.9 |
| East Asia | 2.0 |
| South Asia | 5.5 |
| Other | 4.5 |
Social isolation
Social isolation varies among older adults
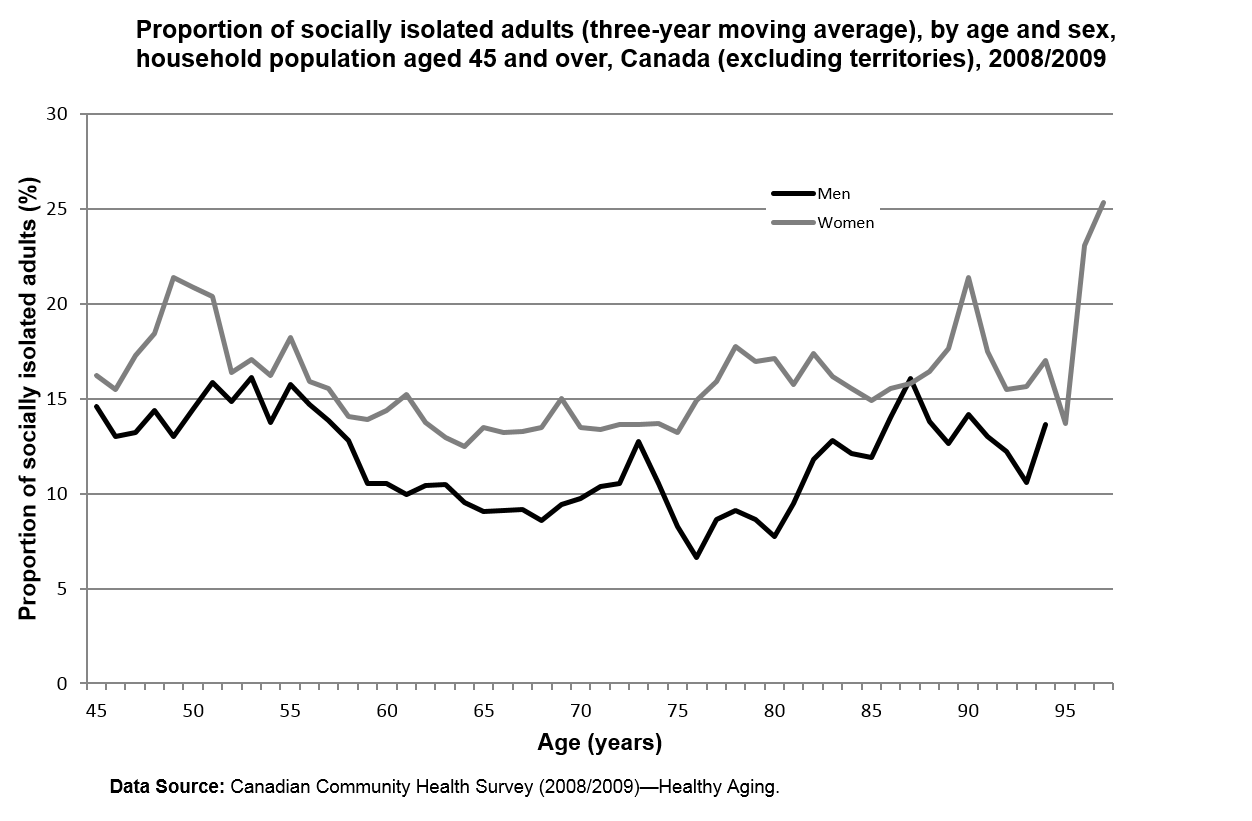
Description for Chart 14
| Age (years) | Men | Women |
|---|---|---|
| Data Source: Canadian Community Health Survey (2008/2009)—Healthy Aging | ||
| 45 | ... | ... |
| 46 | ... | ... |
| 47 | 14.58 | 16.24 |
| 48 | 13.00 | 15.49 |
| 49 | 13.22 | 17.31 |
| 50 | 14.36 | 18.41 |
| 51 | 13.01 | 21.37 |
| 52 | 14.46 | 20.89 |
| 53 | 15.86 | 20.37 |
| 54 | 14.84 | 16.39 |
| 55 | 16.11 | 17.05 |
| 56 | 13.76 | 16.22 |
| 57 | 15.74 | 18.23 |
| 58 | 14.71 | 15.93 |
| 59 | 13.87 | 15.51 |
| 60 | 12.82 | 14.08 |
| 61 | 10.52 | 13.89 |
| 62 | 10.55 | 14.38 |
| 63 | 9.93 | 15.22 |
| 64 | 10.45 | 13.76 |
| 65 | 10.50 | 12.98 |
| 66 | 9.55 | 12.48 |
| 67 | 9.07 | 13.48 |
| 68 | 9.12 | 13.20 |
| 69 | 9.19 | 13.28 |
| 70 | 8.61 | 13.50 |
| 71 | 9.44 | 15.03 |
| 72 | 9.76 | 13.48 |
| 73 | 10.39 | 13.40 |
| 74 | 10.55 | 13.64 |
| 75 | 12.74 | 13.65 |
| 76 | 10.56 | 13.67 |
| 77 | 8.25 | 13.22 |
| 78 | 6.63 | 14.90 |
| 79 | 8.66 | 15.91 |
| 80 | 9.14 | 17.77 |
| 81 | 8.66 | 16.96 |
| 82 | 7.74 | 17.13 |
| 83 | 9.46 | 15.76 |
| 84 | 11.77 | 17.37 |
| 85 | 12.81 | 16.19 |
| 86 | 12.10 | 15.56 |
| 87 | 11.90 | 14.91 |
| 88 | 14.00 | 15.54 |
| 89 | 16.05 | 15.81 |
| 90 | 13.80 | 16.43 |
| 91 | 12.65 | 17.64 |
| 92 | 14.17 | 21.41 |
| 93 | 13.04 | 17.50 |
| 94 | 12.22 | 15.50 |
| 95 | 10.58 | 15.66 |
| 98 | 13.63 | 17.00 |
Range of factors associated with social isolation
- Factors associated with social isolation
- Hearing difficulty: OR=1.4 (men); OR=1.5 (women)
- Pain: OR=1.5 (women only)
- Emotion: OR=4.3 (men); OR=4.4 (women)
- Cognition: OR=2.5 (men); OR=1.9 (women)
- Fear of falling: OR=1.5 (men); OR=1.4 (women)
OR = odds ratio
Data Source: Canadian Community Health Survey (2008/2009)—Healthy Aging
Hearing loss
Hearing loss associated with speech frequency more prevalent among older Canadians
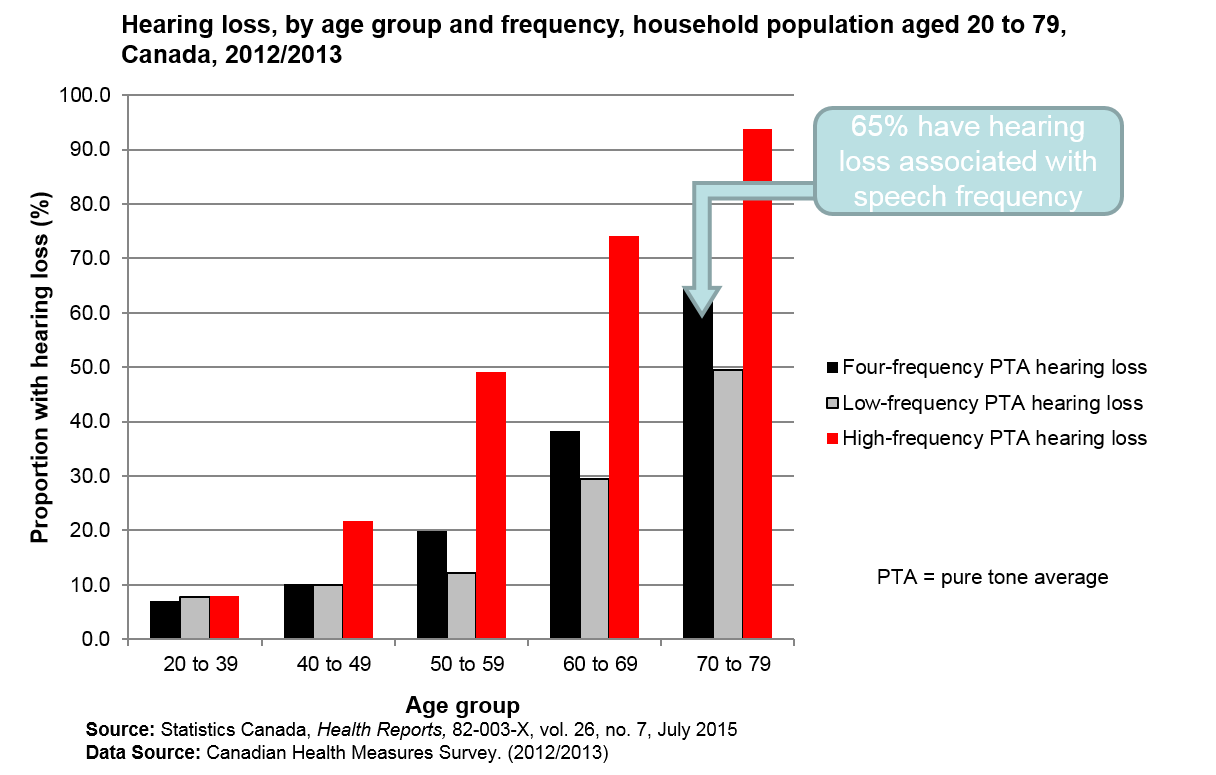
Description for Chart 15
65% have hearing loss associated with speech frequency
| Age Group | Four-frequency PTA hearing loss | Low frequency PTA hearing loss | High frequency PTA hearing loss |
|---|---|---|---|
| PTA = pure tone average Source: Statistics Canada, Health Reports, 82-003-X, vol. 26, no. 7, July 2015 Data Source: Canadian Health Measures Survey. (2012/2013) |
|||
| 20 to 39 | 7.1 | 7.7 | 8.0 |
| 40 to 49 | 10.1 | 9.9 | 21.8 |
| 50 to 59 | 19.9 | 12.2 | 49.1 |
| 60 to 69 | 38.3 | 29.5 | 74.1 |
| 70 to 79 | 65.0 | 49.5 | 93.8 |
Fear of falling
One in three seniors is concerned or worried about falling

Description for Chart 16
| Age Group | Men | Women |
|---|---|---|
| Source: Statistics Canada, Health at a Glance, 82-624-X, October 2014 Data Source: Canadian Community Health Survey (2008/2009)—Healthy Aging |
||
| 65 to 69 | 18 | 33 |
| 70 to 74 | 21 | 41 |
| 75 to 79 | 25 | 45 |
| 80 to 84 | 33 | 47 |
| 85 and over | 35 | 51 |
Home care
Chronic conditions associated with higher use of home-care services and need for formal-care providers

Description for Chart 17
| Type of provider | Personal and medical care | Other care (e.g., housework, meal preparation) | ||||||
|---|---|---|---|---|---|---|---|---|
| Number of chronic conditions | ||||||||
| 0 | 1 | 2 | 3+ | 0 | 1 | 2 | 3+ | |
| Data Source: Canadian Community Health Survey (2008/2009)—Healthy Aging. | ||||||||
| Formal | 1.80% | 4.77% | 5.61% | 8.95% | 3.37% | 4.83% | 5.46% | 7.63% |
| Informal | 3.33% | 3.55% | 4.73% | 8.80% | 10.83% | 17.22% | 20.75% | 28.33% |
| Mixed | 1.51% | 1.59% | 3.17% | 7.37% | 3.75% | 5.32% | 7.64% | 14.10% |
Caregivers
One in four caregivers reports providing care related to aging

Description for Chart 18
| Health conditions or problems | Percentage distribution among all health conditions or problems |
|---|---|
| Source: Statistics Canada, Spotlight on Canadians, 89-652-X, September 2013 Data Source: General Social Survey. (2012) |
|
| Aging | 27.8 |
| Cancer | 11.2 |
| Cardiovascular disease | 9.3 |
| Mental illness | 6.8 |
| Alzheimer's disease or dementia | 5.9 |
| Neurological diseases | 5.3 |
| Injury from an accident | 4.1 |
| Athritis | 3.8 |
| Diabetes | 3.0 |
| Back problems | 2.6 |
| Developmental disability or disorder | 2.3 |
| Respiratory problems | 2.3 |
| Mobility or physical disability | 2.2 |
| Other health problem | 12.2 |
Higher levels of stress and poor health associated with increased hours of care provided

Description for Chart 19
| Number of hours per week | Feelings of stress related to caregiving duties | Feelings that their own health suffered because of caregiving duties |
|---|---|---|
| Source: Statistics Canada, Spotlight on Canadians, 89-652-X, September 2013 Data Source: General Social Survey. (2012) |
||
| 2 to 4 | 17% | 10% |
| 5 to 9 | 27% | 17% |
| 10 to 14 | 32% | 23% |
| 15 to 19 | 39% | 31% |
| 20 or more | 50% | 37% |
Neurological disease
Dementia
An estimated 227,500 Canadians aged 45 and over reported a diagnosis of Alzheimer's disease or other dementia
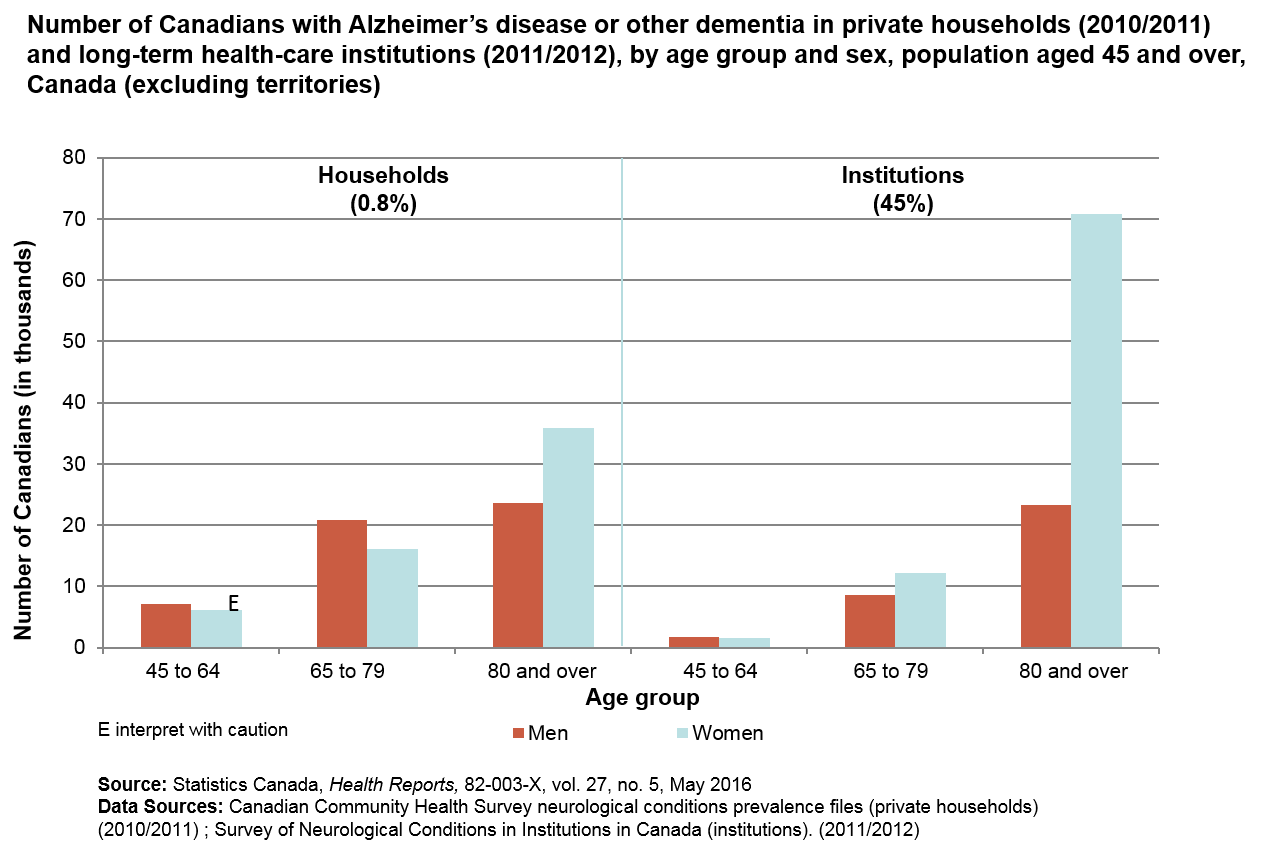
Description for Chart 20
| Age Group | Men | Women |
|---|---|---|
| E interpret with caution Source: Statistics Canada, forthcoming, Data Sources: Canadian Community Health Survey neurological conditions prevalence files (private households) (2010/2011) ; Survey of Neurological Conditions in Institutions in Canada (institutions). (2011/2012) |
||
| Household (0.8%) | ||
| 45 to 64 | 7.127 | 6.103E |
| 65 to 79 | 20.842 | 16.059 |
| 80 and over | 23.537 | 35.835 |
| Institutions (45%) | ||
| 45 to 64 | 1.643 | 1.502 |
| 65 to 79 | 8.527 | 12.248 |
| 80 and over | 23.237 | 70.757 |
Parkinson's
An estimated 65,700 Canadians aged 45 and over reported a diagnosis of Parkinson's disease

Description for Chart 21
| Age Group | Men | Women |
|---|---|---|
| E interpret with caution Source: Statistics Canada, Health Reports, 82-003-X, vol. 25, no. 11, November 2014, Data sources: Canadian Community Health Survey neurological conditions prevalence files (private households) (2010/2011); Survey of Neurological Conditions in Institutions in Canada (institutions). (2011/2012) |
||
| Households (0.4%) | ||
| 45 to 64 | 6.44 | 3.18E |
| 65 to 79 | 18.12 | 9.71E |
| 80 and over | 9.32E | 6.42E |
| Institutions (2.9%) | ||
| 45 to 64 | 0.27 | 0.17 |
| 65 to 79 | 2.00 | 1.63 |
| 80 and over | 3.44 | 5.00 |
Projections
Expect increases in the prevalence of both Parkinson's and Alzheimer's (aging population)

Description for Chart 22
| Year | Prevalent cases (person years) | Prevalence rate (age 65 years and over) |
|---|---|---|
| Source: Mapping Connections, Public Health Agency of Canada, September 2014 Data Source: Statistics Canada population health model (neurological)*. *Demographic changes as projected by Demography Division. Age/sex specific incidence rates and relative mortality rate ratios constant over time. |
||
| Parkinson's disease | ||
| 2011 | 84,690 | 1.03 |
| 2016 | 99,022 | 1.03 |
| 2021 | 116,822 | 1.06 |
| 2026 | 138,760 | 1.14 |
| 2031 | 163,704 | 1.28 |
| Alzheimer's disease | ||
| 2011 | 340,170 | 4.56 |
| 2016 | 394,996 | 4.52 |
| 2021 | 461,651 | 4.55 |
| 2026 | 554,189 | 4.91 |
| 2031 | 673,991 | 5.62 |
Costs
Cost of health-care services higher among those with Alzheimer's, especially long-term care costs
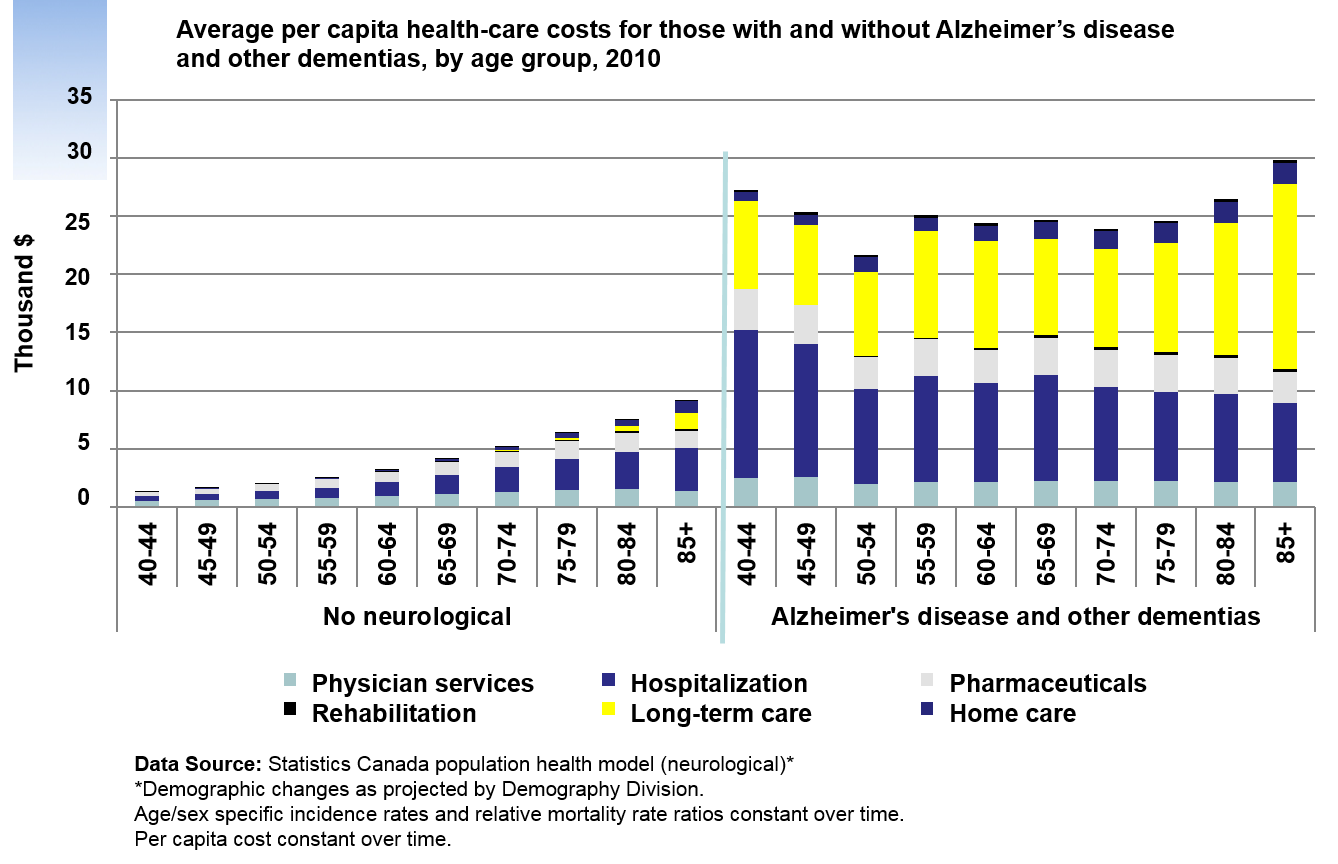
Description for Chart 23
| Age group | Physician services | Hospitalization | Pharmaceuticals | Rehabilitation | Long term care | Homecare |
|---|---|---|---|---|---|---|
| Data Source: Statistics Canada population health model (neurological)*. *Demographic changes as projected by Demography Division. Age/sex specific incidence rates and relative mortality rate ratios constant over time. Per capita cost constant over time. |
||||||
| No neurological | ||||||
| 40-44 | 0.47 | 0.42 | 0.37 | 0.00 | 0.00 | 0.02 |
| 45-49 | 0.54 | 0.51 | 0.47 | 0.01 | 0.00 | 0.04 |
| 50-54 | 0.64 | 0.68 | 0.59 | 0.01 | 0.01 | 0.06 |
| 55-59 | 0.75 | 0.88 | 0.75 | 0.02 | 0.01 | 0.08 |
| 60-64 | 0.90 | 1.20 | 0.92 | 0.03 | 0.02 | 0.12 |
| 65-69 | 1.10 | 1.63 | 1.12 | 0.05 | 0.04 | 0.16 |
| 70-74 | 1.28 | 2.11 | 1.35 | 0.07 | 0.09 | 0.24 |
| 75-79 | 1.44 | 2.68 | 1.52 | 0.11 | 0.17 | 0.38 |
| 80-84 | 1.50 | 3.24 | 1.60 | 0.16 | 0.40 | 0.59 |
| 85+ | 1.36 | 3.72 | 1.42 | 0.21 | 1.41 | 1.01 |
| Alzheimer's disease and other dementias | ||||||
| 40-44 | 2.45 | 12.73 | 3.52 | 0.00 | 7.63 | 0.73 |
| 45-49 | 2.55 | 11.49 | 3.29 | 0.02 | 6.92 | 0.85 |
| 50-54 | 1.94 | 8.20 | 2.71 | 0.08 | 7.28 | 1.25 |
| 55-59 | 2.08 | 9.14 | 3.20 | 0.11 | 9.21 | 1.09 |
| 60-64 | 2.16 | 8.46 | 2.82 | 0.20 | 9.23 | 1.32 |
| 65-69 | 2.24 | 9.11 | 3.19 | 0.22 | 8.26 | 1.45 |
| 70-74 | 2.20 | 8.07 | 3.20 | 0.30 | 8.37 | 1.58 |
| 75-79 | 2.17 | 7.68 | 3.18 | 0.29 | 9.39 | 1.69 |
| 80-84 | 2.16 | 7.50 | 3.11 | 0.26 | 11.38 | 1.85 |
| 85+ | 2.09 | 6.81 | 2.69 | 0.25 | 15.93 | 1.78 |
Additional cost of health-care services used by patients with Alzheimer's is projected to reach about $13.3 billion by 2031
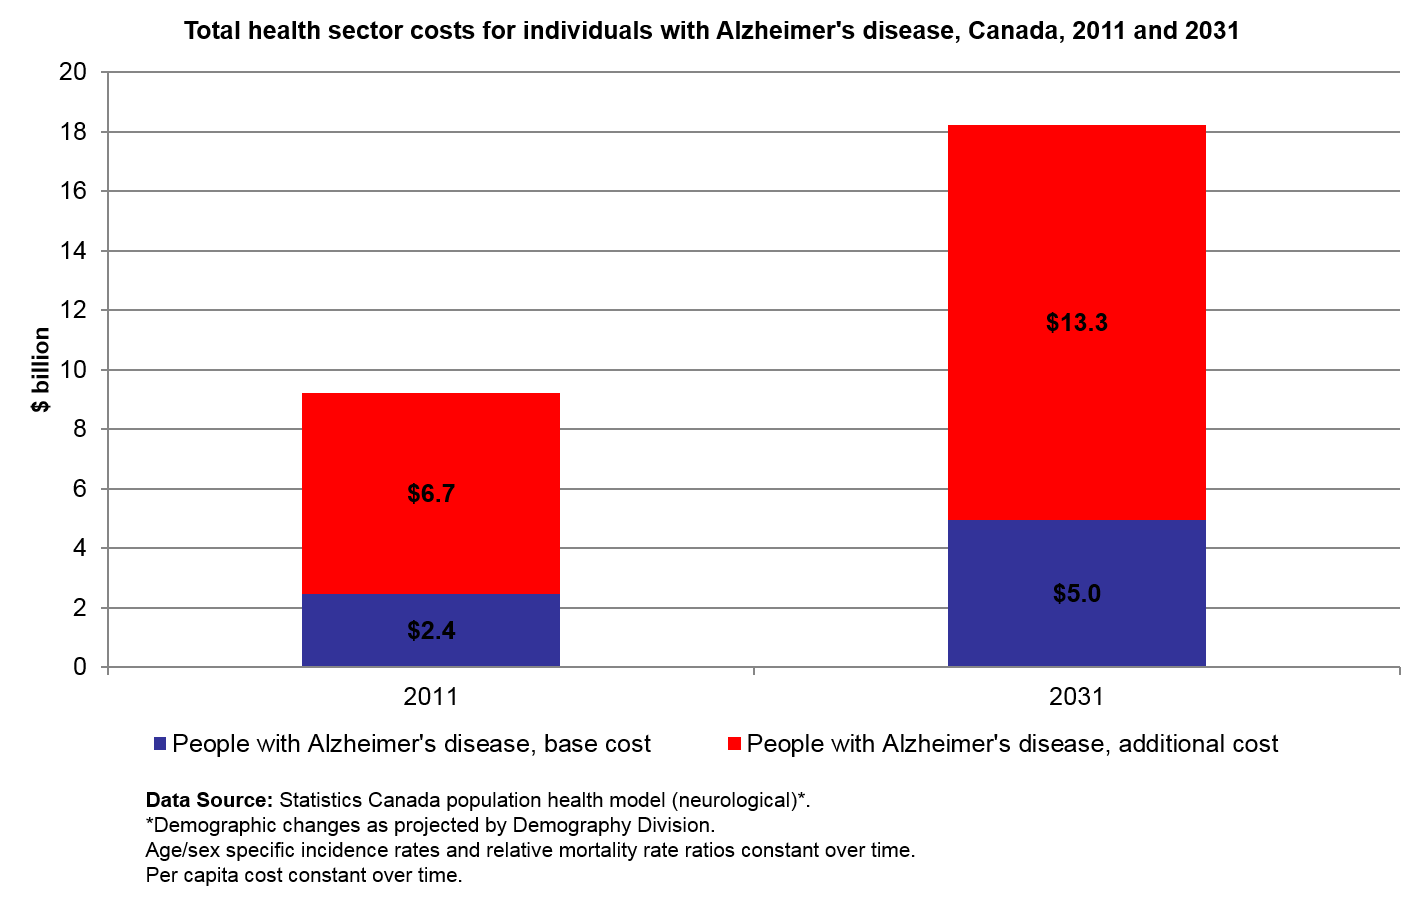
Description for Chart 24
| Year | People with Alzheimer's disease, base cost | People with Alzheimer's disease, additional cost |
|---|---|---|
| Data Source: Statistics Canada population health model (neurological)*. *Demographic changes as projected by Demography Division. Age/sex specific incidence rates and relative mortality rate ratios constant over time. Per capita cost constant over time. |
||
| 2011 | 2.4 | 6.7 |
| 2031 | 5.0 | 13.3 |
Transitions to institutions
Understanding factors associated with transitions to institutions will inform future projections

Description for Chart 25
| Alzheimer's | Lost partner, CCHS to Census | Gained partner, CCHS to Census | Received home care | Immigrant | ||||||
|---|---|---|---|---|---|---|---|---|---|---|
| No | Yes | No | Yes | No | Yes | No | Yes | No | Yes | |
| Source: Statistics Canada, linked 2007/2008 Canadian Community Health Survey (Cycle 3.1) and 2011 Census. | ||||||||||
| Nursing home | 9.35 | 52.16 | 4.1 | 11.67 | 13.46 | 17.78 | 8.87 | 14.45 | 10.92 | 7.79 |
| Residence for senior citizens | 8.4 | 16.45 | 4.75 | 11.94 | 10.16 | 0.01 | 7.92 | 10.77 | 10.09 | 4.14 |
- Date modified: