
Nunavut tourism, July to September 2025
Description: Nunavut tourism, July to September 2025
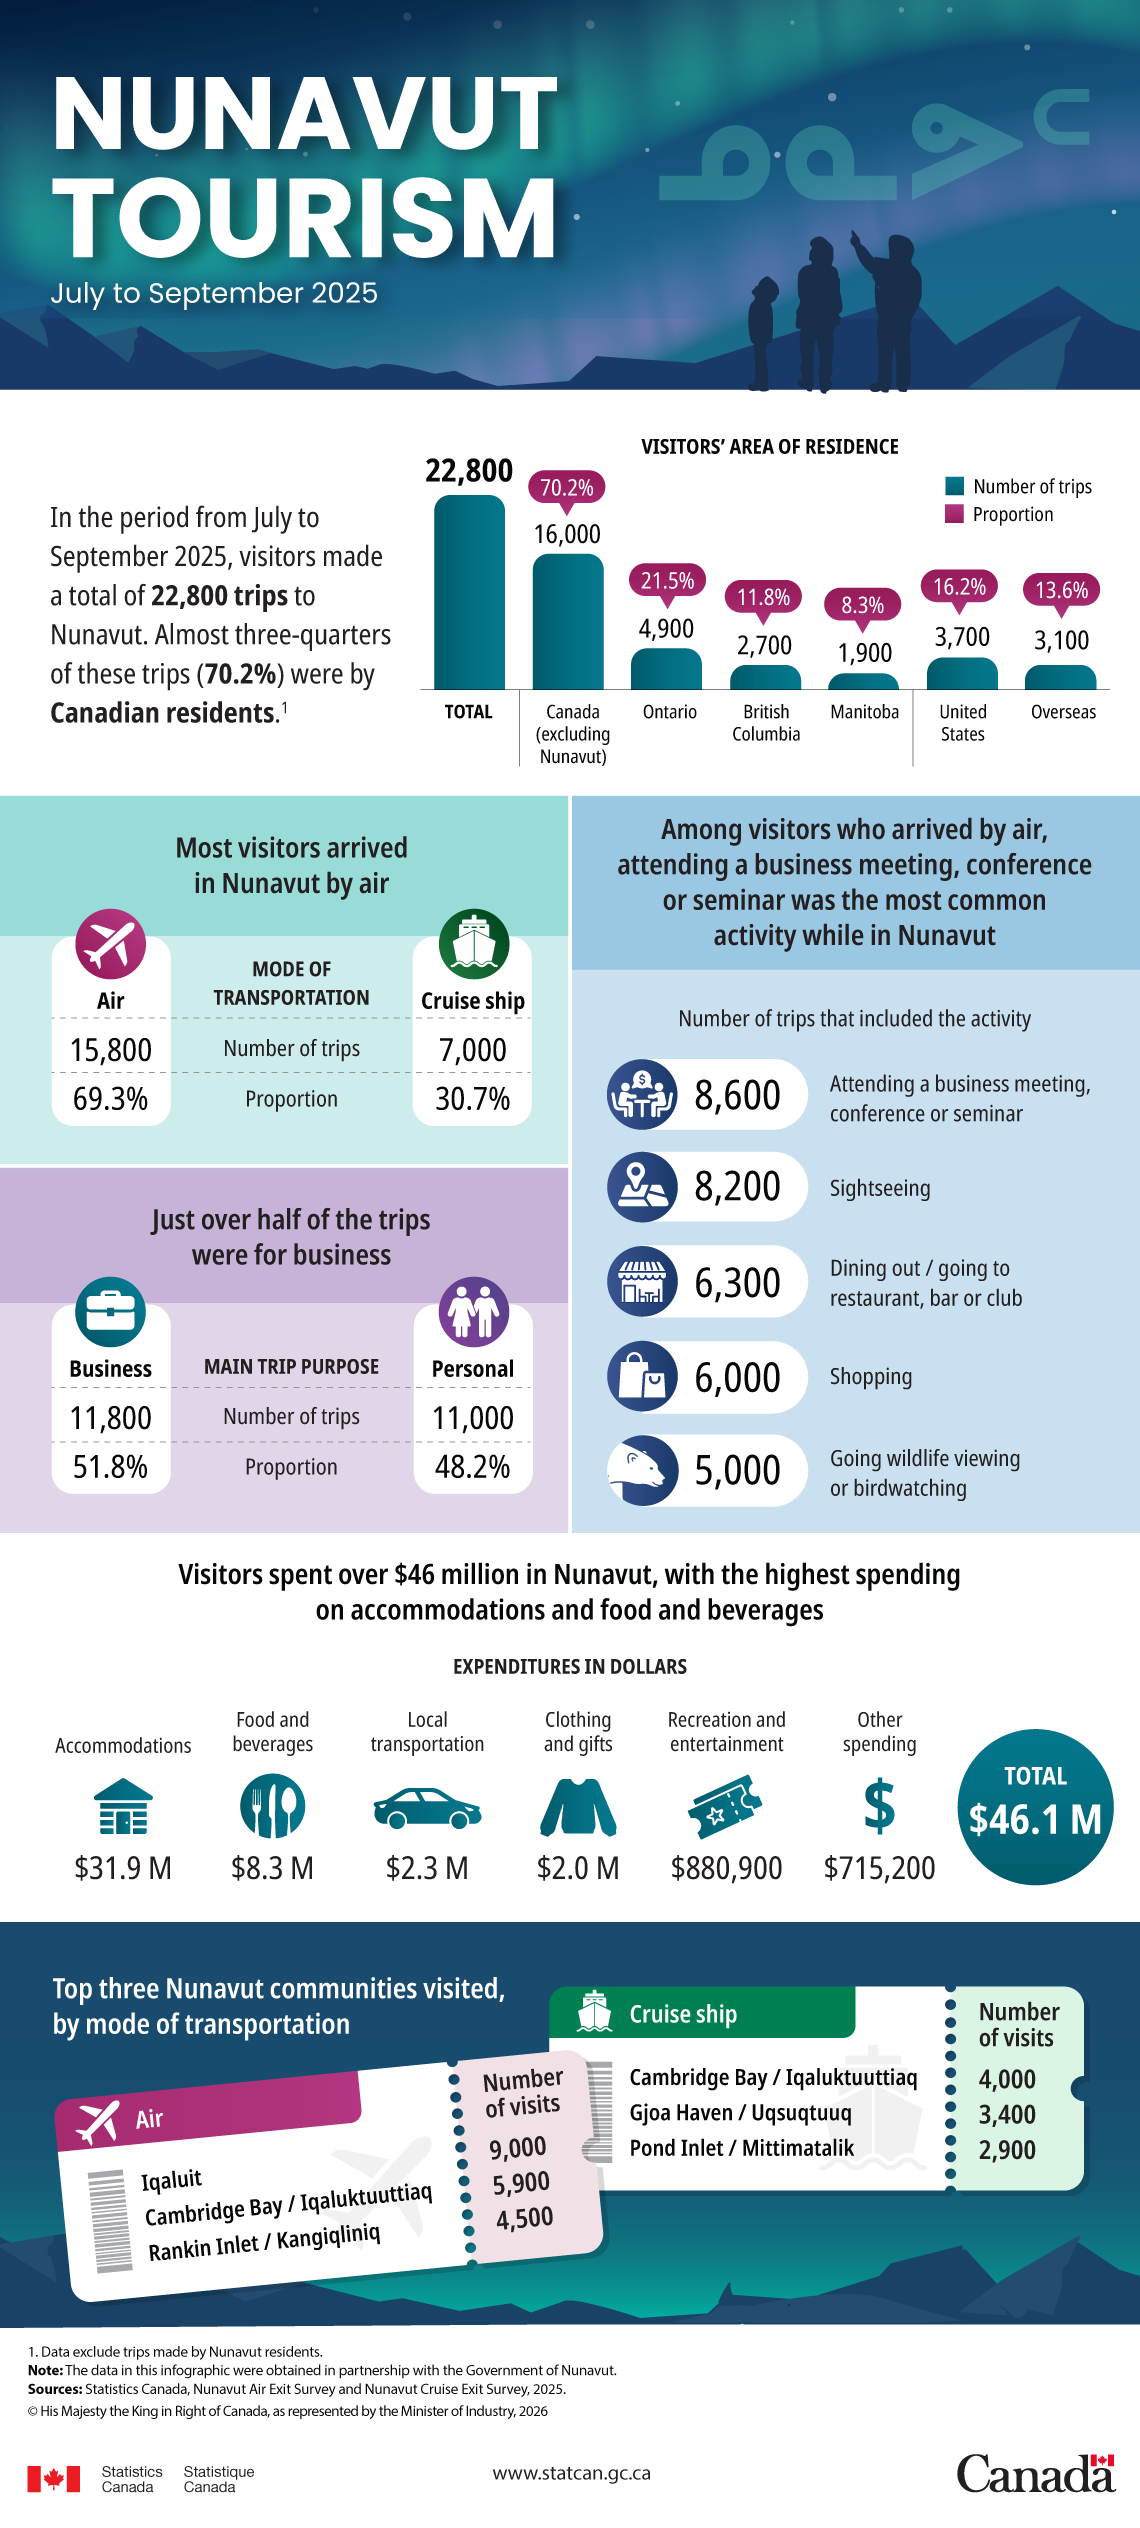
In the period from July to September 2025, visitors made a total of 22,800 trips to Nunavut. Almost three-quarters of these trips (70.2%) were by Canadian residents.Note 1
| Visitors’ area of residence | Number of trips | Proportion |
|---|---|---|
|
||
| Total | 22,800 | ... not applicable |
| Canada (excluding Nunavut) | 16,000 | 70.2% |
| Ontario | 4,900 | 21.5% |
| British Columbia | 2,700 | 11.8% |
| Manitoba | 1,900 | 8.3% |
| United States | 3,700 | 16.2% |
| Overseas | 3,100 | 13.6% |
Most visitors arrived in Nunavut by air
| Mode of transportation | Number of trips | Proportion |
|---|---|---|
| Air | 15,800 | 69.3% |
| Cruise ship | 7,000 | 30.7% |
Just over half of the trips were for business
| Main trip purpose | Number of trips | Proportion |
|---|---|---|
| Business | 11,800 | 51.8% |
| Personal | 11,000 | 48.2% |
Among visitors who arrived by air, attending a business meeting, conference or seminar was the most common activity while in Nunavut
| Number of trips that included the activity | |
|---|---|
| Attending a business meeting, conference or seminar | 8,600 |
| Sightseeing | 8,200 |
| Dining out / going to restaurant, bar or club | 6,300 |
| Shopping | 6,000 |
| Going wildlife viewing or birdwatching | 5,000 |
Visitors spent over $46 million in Nunavut, with the highest spending on accommodations and food and beverages
| Expenditures in dollars | |
|---|---|
| Accommodations | $31.9 million |
| Food and beverages | $8.3 million |
| Local transportation | $2.3 million |
| Clothing and gifts | $2.0 million |
| Recreation and entertainment | $880,900 |
| Other spending | $715,200 |
| Total | $46.1 million |
Top three Nunavut communities visited, by mode of transportation
| Community | Number of visits by air |
|---|---|
| Iqaluit | 9,000 |
| Cambridge Bay / Iqaluktuuttiaq | 5,900 |
| Rankin Inlet / Kangiqliniq | 4,500 |
| Number of visits by cruise ship | |
| Cambridge Bay / Iqaluktuuttiaq | 4,000 |
| Gjoa Haven/ Uqsuqtuuq | 3,400 |
| Pond Inlet / Mittimatalik | 2,900 |
Note: The data in this infographic were obtained in partnership with the Government of Nunavut.
Sources: Statistics Canada, Nunavut Air Exit Survey and Nunavut Cruise Exit Survey, 2025.
- Date modified: