
Co-operatives in Canada, 2023
Release date: March 30, 2026
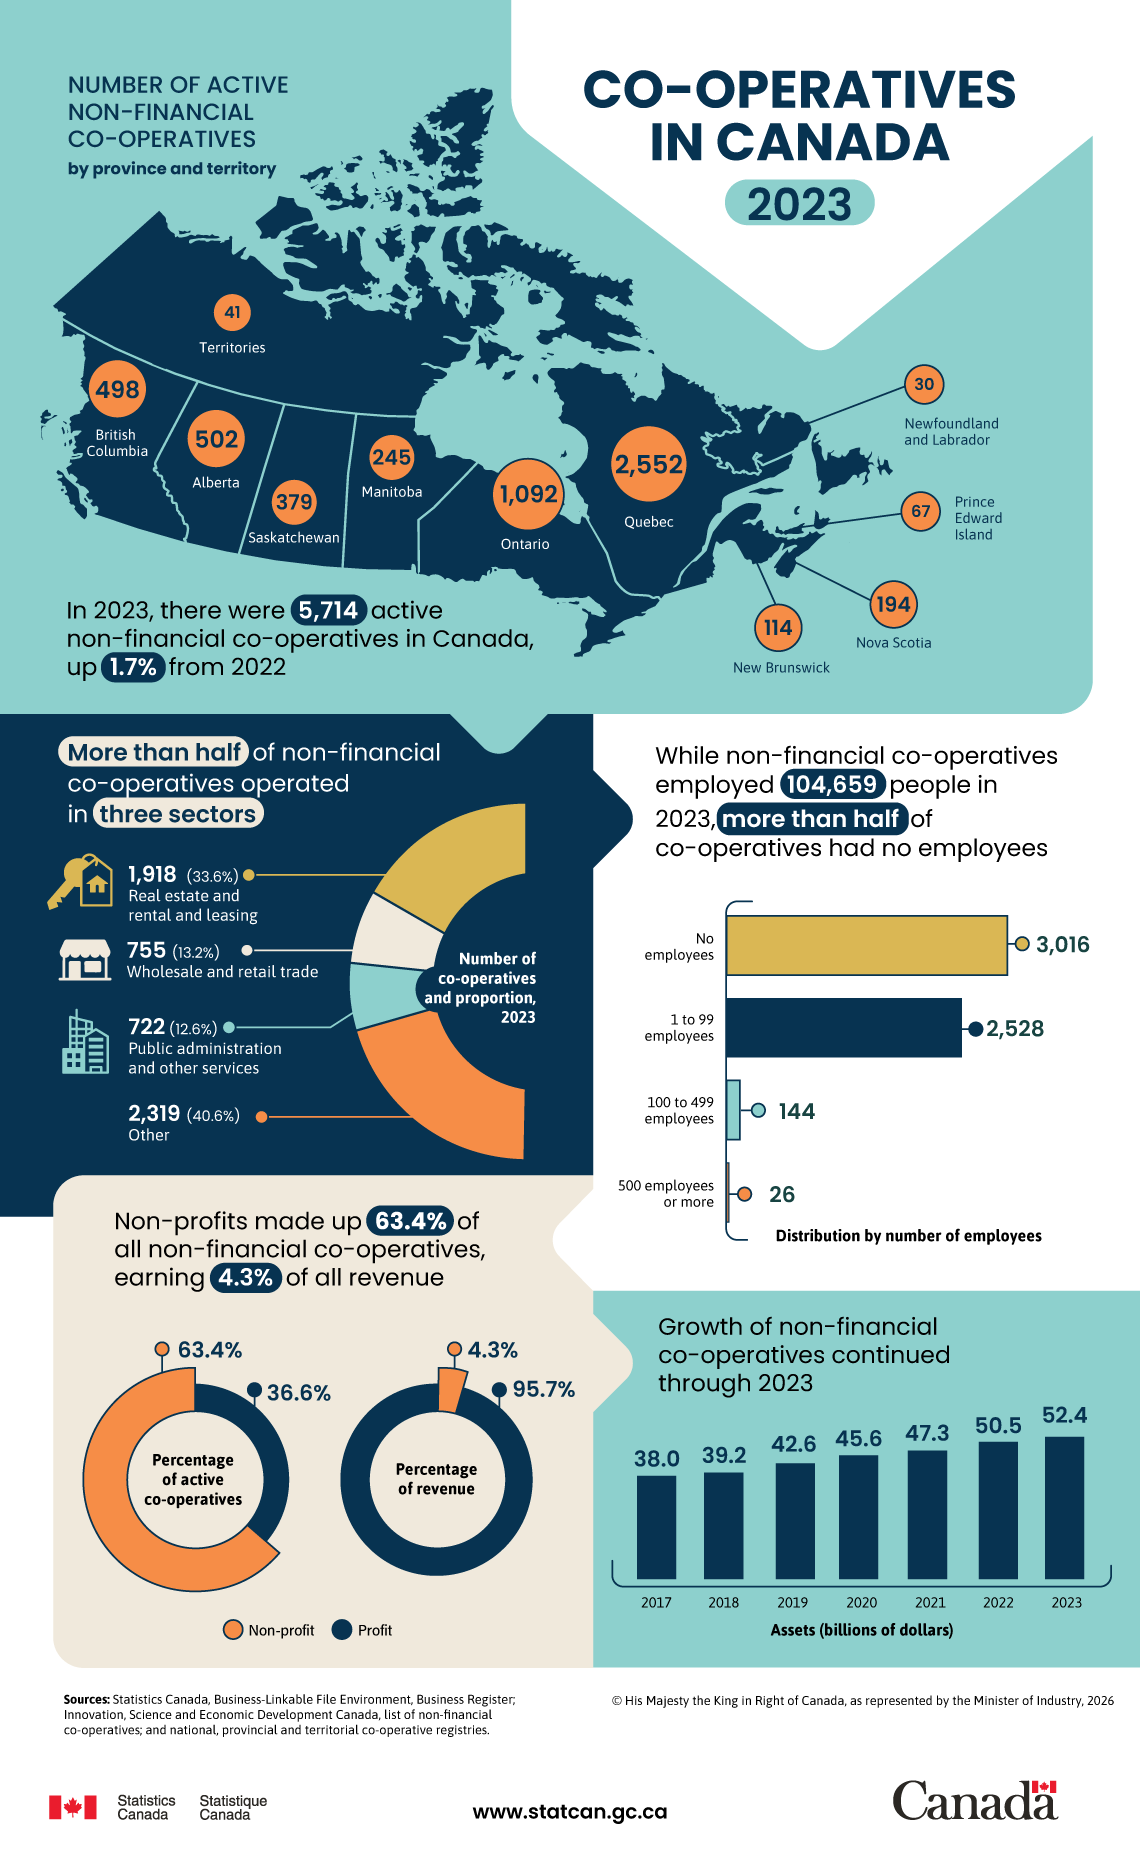
Description: Co-operatives in Canada, 2023
In 2023, there were 5,714 active non-financial co-operatives in Canada, up 1.7% from 2022.
| Region | Count of active co-operatives, 2023 |
|---|---|
| Alberta | 502 |
| British Columbia | 498 |
| Manitoba | 245 |
| New Brunswick | 114 |
| Newfoundland and Labrador | 30 |
| Nova Scotia | 194 |
| Ontario | 1,092 |
| Prince Edward Island | 67 |
| Quebec | 2,552 |
| Saskatchewan | 379 |
| Territories | 41 |
More than half of non-financial co-operatives operated in three sectors.
| Industry sector | Number and proportion of co-operatives |
|---|---|
| Real estate and rental and leasing | 1,918 (33.6%) |
| Wholesale and retail trade | 755 (13.2%) |
| Public administration and other services | 722 (12.6%) |
| Other | 2,319 (40.6%) |
While non-financial co-operatives employed 104,659 people in 2023, more than half of co-operatives had no employees.
| Employment size group | Number of active co-operatives |
|---|---|
| No employees | 3,016 |
| 1 to 99 employees | 2,528 |
| 100 to 499 employees | 144 |
| 500 employees or more | 26 |
| Percentage of active cooperatives | Percentage of revenue | |
|---|---|---|
| Non-profit | 63.4% | 4.3% |
| Profit | 36.6% | 95.7% |
| Assets (billions of dollars) | |
|---|---|
| 2017 | 38.0 |
| 2018 | 39.2 |
| 2019 | 42.6 |
| 2020 | 45.6 |
| 2021 | 47.3 |
| 2022 | 50.5 |
| 2023 | 52.4 |
Sources: Statistics Canada, Business-Linkable File Environment, Business Register; Innovation, Science and Economic Development Canada, list of non-financial co-operatives; and national, provincial and territorial co-operative registries.
- Date modified: