
How cannabis use changed in Canada, 2018 to 2020

Archived Content
Information identified as archived is provided for reference, research or recordkeeping purposes. It is not subject to the Government of Canada Web Standards and has not been altered or updated since it was archived. Please "contact us" to request a format other than those available.
Description: How cannabis use changed in Canada, 2018 to 2020
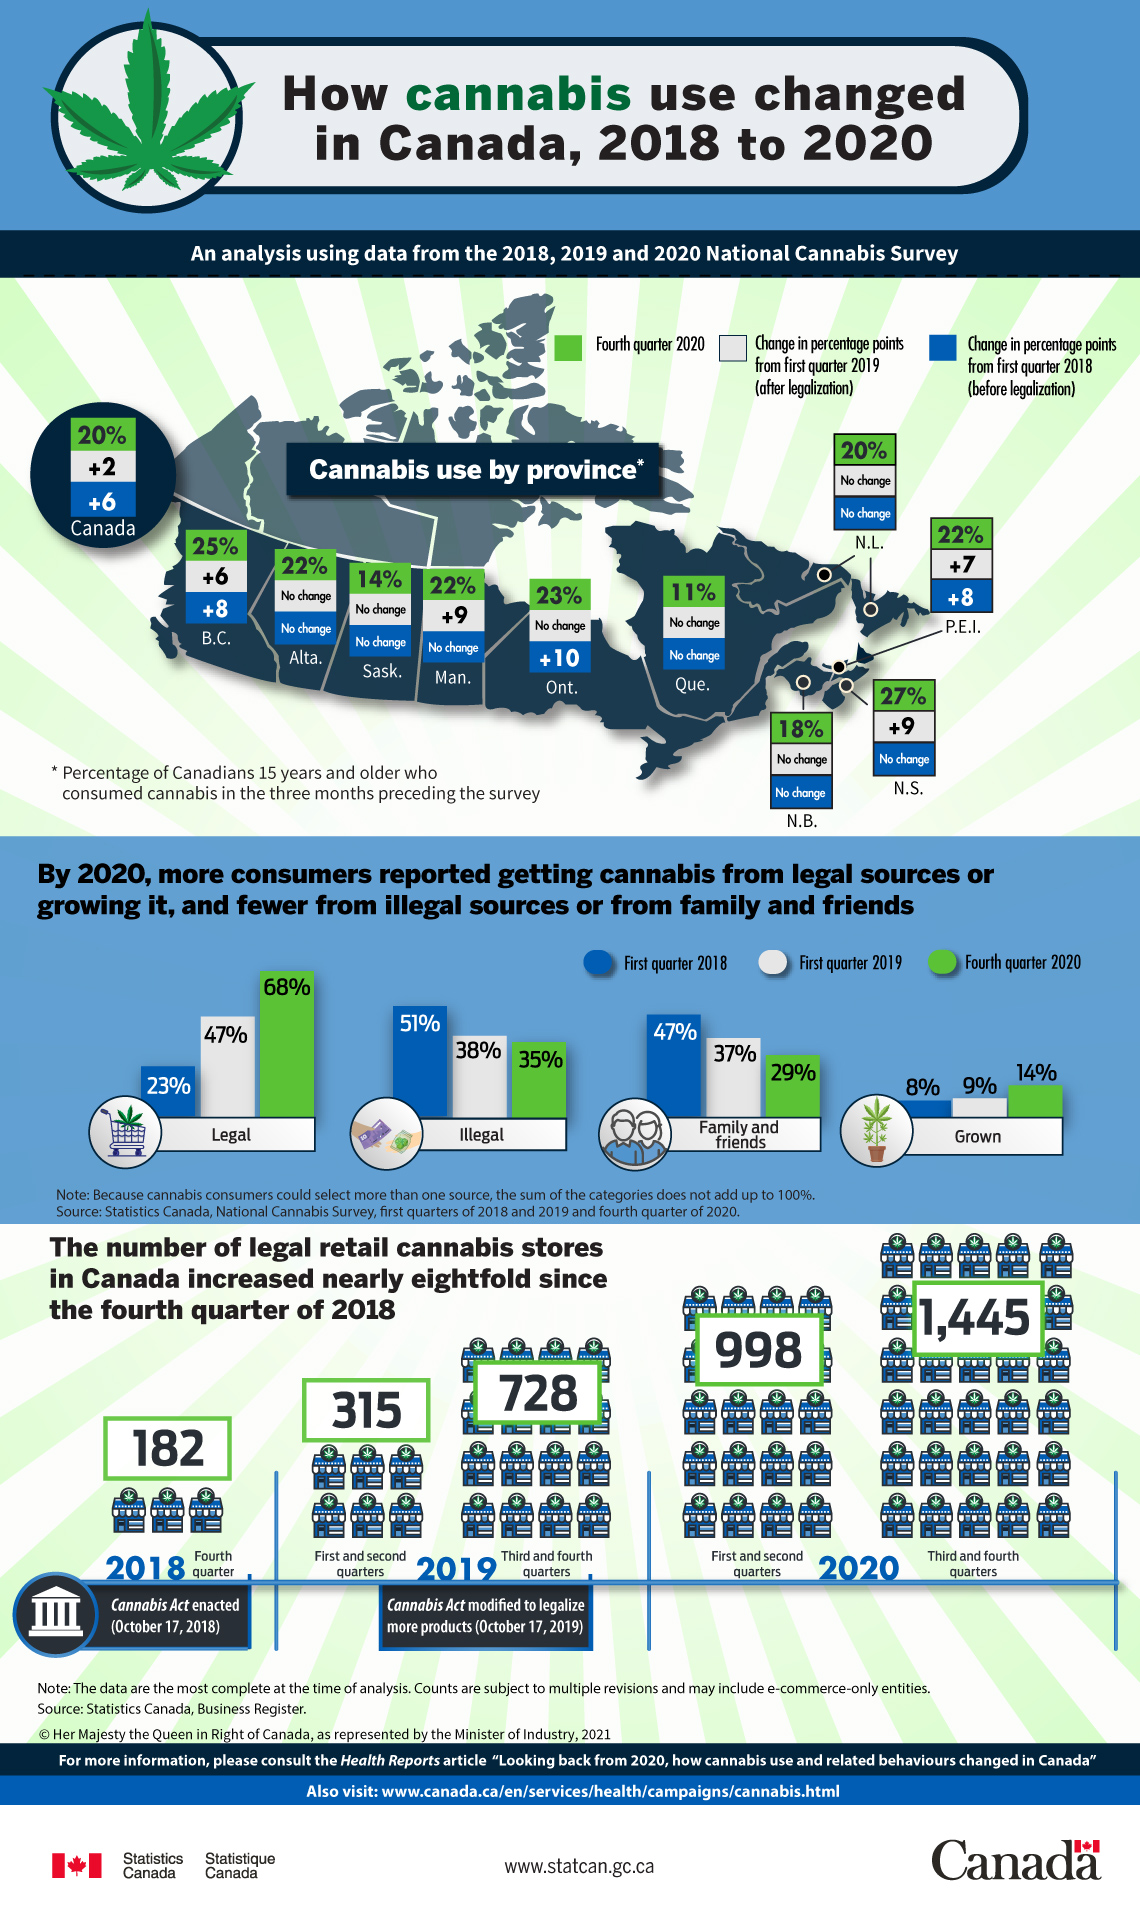
How cannabis use changed in Canada, 2018 to 2020
An analysis using data from the 2018, 2019 and 2020 National Cannabis Survey
Cannabis use by province
Percentage of Canadians 15 years and older who consumed cannabis in the three months preceding the survey
| Fourth quarter 2020 | Change in percentage points from first quarter 2019 (after legalization) | Change in percentage points from first quarter 2018 (before legalization) | |
|---|---|---|---|
| Canada | 20% | +2 | +6 |
| British Columbia | 25% | +6 | +8 |
| Alberta | 22% | No change | No change |
| Saskatchewan | 14% | No change | No change |
| Manitoba | 22% | +9 | No change |
| Ontario | 23% | No change | +10 |
| Quebec | 11% | No change | No change |
| New Brunswick | 18% | No change | No change |
| Nova Scotia | 27% | +9 | No change |
| Prince Edward Island | 22% | +7 | +8 |
| Newfoundland and Labrador | 20% | No change | No change |
By 2020, more consumers reported getting cannabis from legal sources or growing it, and fewer from illegal sources or from family and friends
| Source | First quarter of 2018 | First quarter 2019 | Fourth quarter 2020 |
|---|---|---|---|
| Legal | 23% | 47% | 68% |
| Illegal | 51% | 38% | 35% |
| Family and friends | 47% | 37% | 29% |
| Grown | 8% | 9% | 14% |
|
Note: Because cannabis consumers could select more than one source, the sum of the categories does not add up to 100%. Source: Statistics Canada, National Cannabis Survey, first quarters of 2018 and 2019 and fourth quarter of 2020. |
|||
The number of legal retail cannabis stores in Canada increased nearly eightfold since the fourth quarter of 2018
| 2018Note * | 2019Note ** | 2020 | |||
|---|---|---|---|---|---|
| Fourth quarter | First and second quarters | Third and fourth quarters | First and second quarters | Third and fourth quarters | |
| Legal retail cannabis stores | 182 | 315 | 728 | 998 | 1,445 |
Source: Statistics Canada, Business Register. |
|||||
For more information, please consult the Health Reports article “Looking back from 2020, how cannabis use and related behaviours changed in Canada”
Also visit Cannabis in Canada: https://www.canada.ca/en/services/health/campaigns/cannabis.html
- Date modified: