Canadians in the workforce, 2016 Census of Population
Release date: November 29, 2017

Description: Canadians in the workforce, 2016 Census of Population
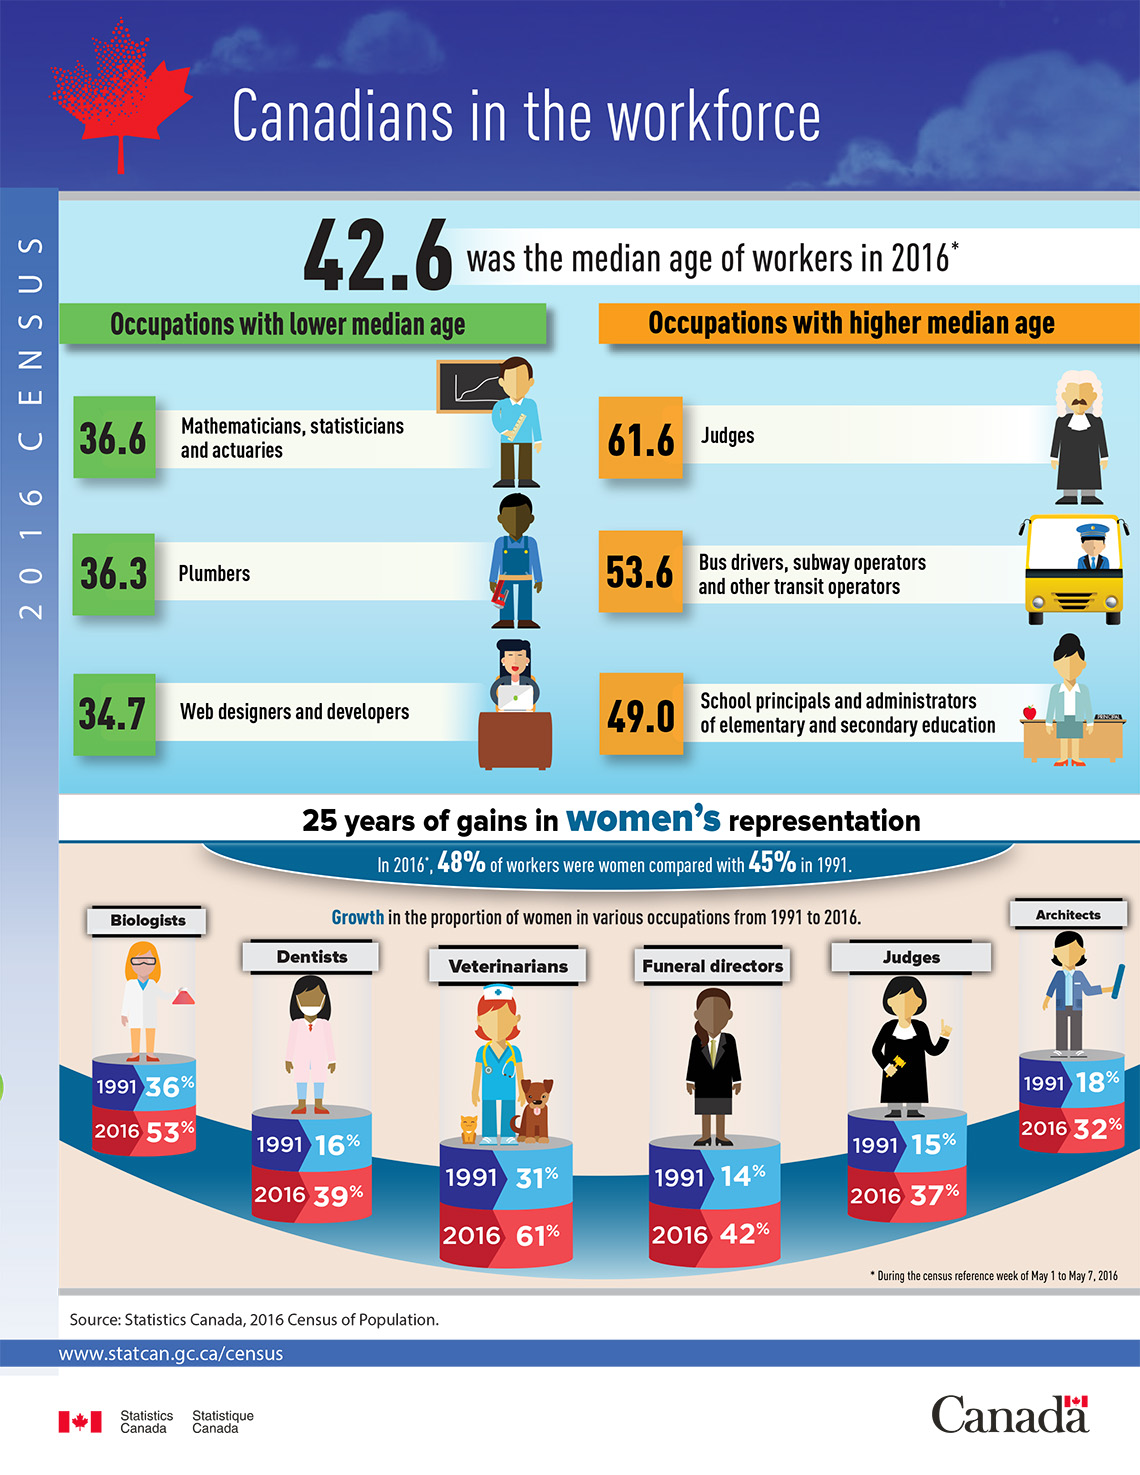
42.6 was the median age of workers in 2016.Footnote 1
| Occupation | Age |
|---|---|
| Mathematicians, statisticians and actuaries | 36.6 |
| Plumbers | 36.3 |
| Web designers and developers | 34.7 |
| Occupation | Age |
|---|---|
| Judges | 61.6 |
| Bus drivers, subway operators and other transit operators | 53.6 |
| School principals and administrators of elementary and secondary education | 49.0 |
25 years of gains in women's representation
In 2016Footnote 1, 48% of workers were women compared with 45% in 1991.
| Occupation | 1991 | 2016 |
|---|---|---|
| Biologists | 36% | 53% |
| Dentists | 16% | 39% |
| Veterinarians | 31% | 61% |
| Funeral directors | 14% | 42% |
| Judges | 15% | 37% |
| Architects | 18% | 32% |
Source: Statistics Canada, 2016 Census of Population.
- Date modified: