
Canadian Agriculture at a Glance
A closer look at dairy goat farming in Ontario
by Michael Campbell and Kathryn Reid
Skip to text
Text begins
Goats are raised to produce dairy, meat, fibre and skin products. The demand for these products has risen over time in Canada. Results from the Census of Agriculture show that despite a decline in the number of farms reporting goats, the overall number of goats reported on farms in Canada has significantly increased over the last 30 years—largely because of increases in Ontario, where the greatest share of goats has been reported.
This article provides insights on dairy goat farming in Ontario, by linking administrative Ontario dairy goat farm registration information to Census of Agriculture data.
The number of goats reported in Canada is increasing
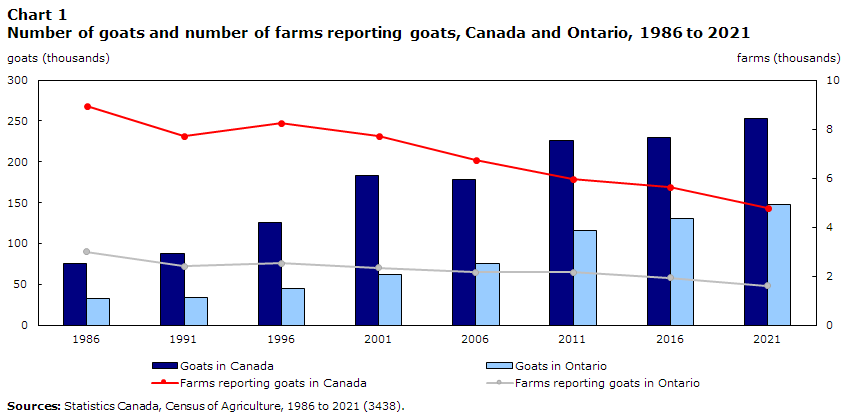
In 2021, there were 253,278 goats reported on farms in Canada, up 10.1% from 2016. Meanwhile, there were 4,801 farms that reported goats in Canada in 2021, down 14.7% from 2016 (Chart 1). As a result, there were on average 52.8 goats per farm that reported goats in Canada in 2021, an increase from 40.9 in 2016.
Data table for Chart 1
| Farms reporting goats in Canada | Goats in Canada | Farms reporting goats in Ontario | Goats in Ontario | |
|---|---|---|---|---|
| number | ||||
| 1986 | 8,936 | 75,788 | 2,999 | 32,460 |
| 1991 | 7,735 | 88,116 | 2,400 | 33,405 |
| 1996 | 8,252 | 125,819 | 2,521 | 45,258 |
| 2001 | 7,706 | 182,851 | 2,342 | 62,310 |
| 2006 | 6,725 | 177,698 | 2,169 | 76,114 |
| 2011 | 5,949 | 225,461 | 2,152 | 116,260 |
| 2016 | 5,627 | 230,034 | 1,936 | 130,219 |
| 2021 | 4,801 | 253,278 | 1,611 | 148,109 |
| Sources: Statistics Canada, Census of Agriculture, 1986 to 2021 (3438). | ||||
Ontario is driving the increase in Canada’s goat numbers
The increase in the number of goats reported in Canada was largely driven by Ontario. In 2021, there were 148,109 goats reported on farms in Ontario, up 13.7% from 2016.
In fact, farms in Ontario accounted for over half (58.5%) of total goats reported in Canada in 2021. This was followed by Alberta, with 33,527 goats reported in 2021. Overall, the Prairie provinces reported 52,775 goats, accounting for 20.8% of Canada’s total.
The number of goats on Ontario’s registered dairy goat farms increases
In 2021, the number of goats reported on registered dairy goat farms in Ontario was 85,673, representing 57.8% of total goats in the province. This was a 2.2% increase from the 83,841 goats reported in 2016.
While the number of goats in Ontario increased, the number of registered dairy goat farms declined. In 2021, a total of 141 registered dairy goat farms were identified in Ontario, down from 206 in 2016. However, the average number of goats per registered dairy goat farm increased from 407.0 to 607.6 over the five-year period.
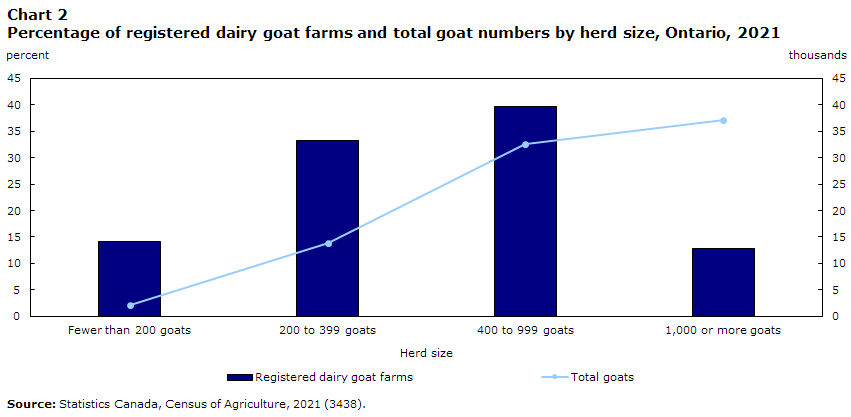
In 2021, 39.7% of registered dairy goat farms held 400 to 999 goats, and 12.8% held 1,000 goats or more—the smallest share. However, while registered dairy goat farms reporting 1,000 goats or more were fewer in number, they accounted for the largest proportion (43.4%) of total goats on registered dairy goat farms in the province (Chart 2).
Data table for Chart 2
| Herd size | Registered dairy goat farms | Total goats |
|---|---|---|
| percent | number | |
| Fewer than 200 goats | 14.2 | 2,076 |
| 200 to 399 goats | 33.3 | 13,909 |
| 400 to 999 goats | 39.7 | 32,501 |
| 1,000 or more goats | 12.8 | 37,187 |
| Source: Statistics Canada, Census of Agriculture, 2021 (3438). | ||
Dairy goat farm operators are younger on average than total farm operators in Ontario
In 2021, the average age of farm operators working on registered dairy goat farms (dairy goat farm operators) in Ontario was 44.8 years, up from 42.8 years in 2016. This follows the overall trend of total farm operators in Canada, who have shown an increase in their average age from 55.0 years in 2016 to 56.0 years in 2021.
In Ontario, the average age of dairy goat farm operators in 2021 was 11.9 years lower than that of total farm operators (56.7 years) in the province. This could in part be attributable to the lower costs associated with entering this farming industry, compared with other livestock farming industries.
In 2021, younger farm operators (under 35 years) were more prevalent in Ontario registered dairy goat farms, compared with total farms in the province. Just over one-fifth (21.9%) of dairy goat farm operators were under 35 years, more than double the proportion for total farm operators in Ontario (8.3%).
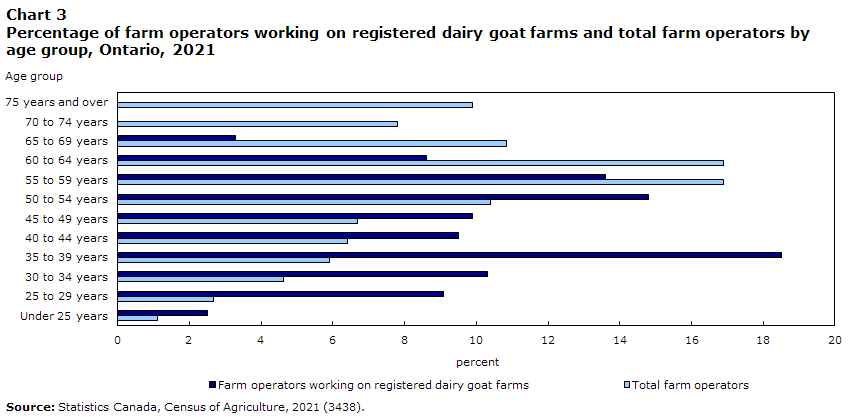
In terms of detailed age groups, dairy goat farm operators aged 35 to 39 years represented the largest age group among total dairy goat farm operators in Ontario in 2021, at 18.5%. In contrast, the largest age groups among total farm operators in the province were the 55-to-59 and 60-to-64 age groups, at 16.9% each (Chart 3).
Data table for Chart 3
| Age group | Farm operators working on registered dairy goat farms | Total farm operators |
|---|---|---|
| percent | ||
| Under 25 years | 2.5 | 1.1 |
| 25 to 29 years | 9.1 | 2.7 |
| 30 to 34 years | 10.3 | 4.6 |
| 35 to 39 years | 18.5 | 5.9 |
| 40 to 44 years | 9.5 | 6.4 |
| 45 to 49 years | 9.9 | 6.7 |
| 50 to 54 years | 14.8 | 10.4 |
| 55 to 59 years | 13.6 | 16.9 |
| 60 to 64 years | 8.6 | 16.9 |
| 65 to 69 years | 3.3 | 10.8 |
| 70 to 74 years | 0.0 | 7.8 |
| 75 years and over | 0.0 | 9.9 |
| Source: Statistics Canada, Census of Agriculture, 2021 (3438). | ||
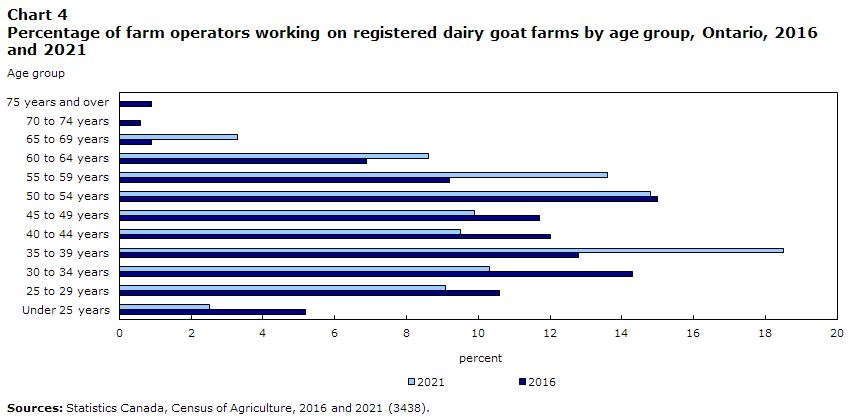
Over time, the age distribution of dairy goat farm operators in Ontario has changed. In 2021, operators aged 35 to 39 (18.5%) accounted for the largest proportion of dairy goat farm operators in Ontario, followed by those aged 50 to 54 (14.8%). In contrast, in 2016, the largest group was those aged 50 to 54 years at 15.0%, followed by those aged 30 to 34 (14.3%) (Chart 4).
Data table for Chart 4
| Age group | 2016 | 2021 |
|---|---|---|
| percent | ||
| Under 25 years | 5.2 | 2.5 |
| 25 to 29 years | 10.6 | 9.1 |
| 30 to 34 years | 14.3 | 10.3 |
| 35 to 39 years | 12.8 | 18.5 |
| 40 to 44 years | 12.0 | 9.5 |
| 45 to 49 years | 11.7 | 9.9 |
| 50 to 54 years | 15.0 | 14.8 |
| 55 to 59 years | 9.2 | 13.6 |
| 60 to 64 years | 6.9 | 8.6 |
| 65 to 69 years | 0.9 | 3.3 |
| 70 to 74 years | 0.6 | 0.0 |
| 75 years and over | 0.9 | 0.0 |
| Sources: Statistics Canada, Census of Agriculture, 2016 and 2021 (3438). | ||
Most registered dairy goat farms in Ontario are co-managed by female and male farm operators
There were 243 farm operators that worked on 141 registered dairy goat farms in Ontario in 2021, of whom 60.5% were male and 39.5% were female. By comparison, 69.0% of total farm operators in Ontario were male and 31.0% were female.
Of the 141 registered dairy goat farms in Ontario in 2021, 33.3% were operated solely by male farm operators, compared with 57.1% of total farms in Ontario. In addition, 7.1% of registered dairy goat farms were operated exclusively by female farm operators, compared with 8.8% of total farms in Ontario. Notably, it was more common for registered dairy goat farms to have mixed-sex farm operators. More than half of registered dairy goat farms (59.6%) reported at least one male and one female farm operator, compared with 34.1% of total farms in Ontario.
Dairy goat farm operators work longer hours on the farm than total farm operators in Ontario
It was more common for dairy goat farm operators in Ontario to report working more than 40 hours per week on the farm than for total farm operators in the province. In 2020, 72.4% of dairy goat farm operators in Ontario reported working more than 40 hours per week on the farm, compared with 32.7% for total farm operators in the province (Chart 5).

Data table for Chart 5
| Average weekly hours | Registered dairy goat farms | Total farms |
|---|---|---|
| percent | ||
| More than 40 hours | 72.4 | 32.7 |
| 30 to 40 hours | 12.3 | 14.4 |
| 20 to 29 hours | 6.6 | 16.2 |
| Less than 20 hours | 8.6 | 36.6 |
| Source: Statistics Canada, Census of Agriculture, 2021 (3438). | ||
In terms of working off the farm, 30.9% of dairy goat farm operators in Ontario reported working off the farm in 2020, compared with 49.2% of total farm operators in the province.
Two-thirds of registered dairy goat farms’ land is owned in Ontario
Land tenure for registered dairy goat farms did not differ notably from that seen for total farms in Ontario. In 2021, 66.2% of the total area of land (includes land used by the operation and may include land used by others) for registered dairy goat farms was owned, compared with 68.1% for all Ontario farms. The area rented from others comprised 32.1% of the total area of land for registered dairy goat farms and 26.7% for all Ontario farms. Registered dairy goat farms with 1,000 or more goats had more land rented from others than land owned, while those with fewer than 1,000 goats collectively owned more land than they rented from others (Table 1).
| Herd size | Area owned | Area rented | ||
|---|---|---|---|---|
| number of farms | acres | number of farms | acres | |
| Fewer than 200 goats | 19 | 1,570 | 5 | 109 |
| 200 to 399 goats | 44 | 5,608 | 21 | 1,981 |
| 400 to 999 goats | 53 | 7,711 | 21 | 2,164 |
| 1,000 or more goats | 15 | 3,002 | 13 | 4,425 |
| Total | 131 | 17,891 | 60 | 8,679 |
| Source: Statistics Canada, Census of Agriculture, 2021 (3438). | ||||
The vast majority of registered dairy goat farms in Ontario report $100,000 or more in operating revenues
A higher proportion of registered dairy goat farms had operating revenues of $100,000 or more, compared with all farms in Ontario in 2020. Farms reporting operating revenues between $100,000 and $249,999, and farms reporting operating revenues between $250,000 and $499,999 both accounted for the largest proportions of registered dairy goat farms in the province (29.1% each). Notably, registered dairy goat farms with $1,000,000 in operating revenues accounted for 7.1% of total goat farms in the province but over a quarter (26.2%) of total operating revenues (Chart 6).

Data table for Chart 6
| Revenue class | Registered dairy goat farms | Operating revenues |
|---|---|---|
| percent | ||
| Less than $10,000 | 0.7 | 0.0 |
| $10,000 to $24,999 | 2.1 | 0.1 |
| $25,000 to $49,999 | 2.1 | 0.2 |
| $50,000 to $99,999 | 9.2 | 1.8 |
| $100,000 to $249,999 | 29.1 | 12.4 |
| $250,000 to $499,999 | 29.1 | 24.7 |
| $500,000 to $999,999 | 20.6 | 34.6 |
| $1,000,000 and over | 7.1 | 26.2 |
| Source: Statistics Canada, Census of Agriculture, 2021 (3438). | ||
Registered dairy goat farms with 400 to 999 goats are the most profitable in 2020
The majority of registered dairy goat farms in Ontario had fewer than 1,000 goats in 2021, and farms with 400 to 999 dairy goats had the most favourable expense-to-revenue ratio (0.83), followed by farms with 1,000 goats or more (Table 2). The overall ratio for registered dairy goat farms in Ontario was 0.86, while the ratio for total farms in Ontario was 0.83.
| Herd size | Expense-to-revenue ratio | |
|---|---|---|
| 2015 | 2020 | |
| dollar | ||
| Fewer than 200 goats | 0.85 | 0.96 |
| 200 to 399 goats | 0.83 | 0.89 |
| 400 to 999 goats | 0.86 | 0.83 |
| 1,000 or more goats | 0.88 | 0.86 |
| Sources: Statistics Canada, Census of Agriculture, 2016 and 2021 (3438). | ||
Registered dairy goat farms with 1,000 or more goats account for the majority of employees
While the number of registered dairy farms with 1,000 or more goats was relatively small (18 farms) in Ontario, they employed the majority of the 137 year-round employees in 2020. Only farms with 400 goats or more had any seasonal employees, for a total of 30. This is likely because of the year-round strict milking requirements on registered dairy goat farms.
Partnership is the most frequently reported operating arrangement for registered dairy goat farms
In 2021, Ontario registered dairy goat farms were most likely to be classified as partnerships (61.0%), followed by sole proprietorships (21.3%) and family corporations (16.3%). In contrast, partnerships accounted for 30.2%, sole proprietorships for 49.0% and family corporations for 18.7% of total farms in Ontario in 2021 (Table 3).
| Operating arrangement | Registered dairy goat farms | Dairy goats | |
|---|---|---|---|
| number | percent | number | |
| Sole proprietorship | 30 | 21.3 | 11,621 |
| Partnership | 86 | 61.0 | 42,990 |
| Family corporation | 22 | 15.6 | 29,162 |
| Non-family corporation | 3 | 2.1 | 1,900 |
| Source: Statistics Canada, Census of Agriculture, 2021 (3438). | |||
Note to readers
The Census of Agriculture is conducted every five years.
All estimates presented in this article exclude data from cannabis operations and data from Canada’s three territories.
Ontario dairy goat linkage methodology
The Census of Agriculture produces a comprehensive record of total goat inventories in Canada but cannot distinguish goat farms by the type of product produced (e.g., dairy, meat, fibre or other products); if goats are raised for milk production; or if they are for meat production.
A record linkage was established between administrative Ontario dairy goat farm registration data and the Census of Agriculture. The linkage was conducted using a probabilistic match approach based on multiple matching fields, such as contact names, business names, addresses and phone numbers.
Linkages proven to be strong matches to unique census records were accepted, while linkages to multiple census records were further examined to determine the best single-record match. In instances where automatic matches were unsuccessful, records were reviewed manually to establish a linkage.
The linkage rate between the administrative Ontario dairy goat farm registration data and the Census of Agriculture was 86.5%.
To ensure the integrity of the data, only records that were successfully matched were included for analysis in this study. Furthermore, all goats located on matched census farms were considered dairy goats, since the Census of Agriculture data do not identify goat inventories by their specific purpose.
In cases where matched farms reported no goats on the Census of Agriculture, tax data (principally milk and cream tax indicators) were used to identify alternative potential matches.
These matches would then be reviewed manually to establish a linkage.
Finally, some dairy goat farms from the administrative Ontario dairy goat farm registration data failed all matching attempts to Census of Agriculture goat farms and were excluded from further analysis.
As a result of these linkage procedures, the accuracy of the data estimates included in this article could be affected by linkage methodology limitations and differences in the collection time frame between the administrative data source and the Census of Agriculture.
Definitions and concepts
Expense-to-revenue ratio
The farm expense-to-revenue ratio is the average amount of total operating expenses incurred for a dollar in total operating revenues.
Farm
A significant conceptual change has been introduced for the 2021 Census of Agriculture: a “farm” or an “agricultural holding” (i.e., the census farm) now refers to a unit that produces agricultural products and reports revenues or expenses for tax purposes to the Canada Revenue Agency. Before 2021, a “farm” was defined as an agricultural operation that produced at least one agricultural product intended for sale.
Farm operator
Farm operator refers to any person responsible for the management decisions in operating a farm or agricultural operation, also registered as an agricultural operator, farmer, operator or rancher.
Farm operating revenues
The Census of Agriculture collects total gross farm operating revenues (i.e., revenues before deducting expenses), in current dollars, for the calendar or accounting year prior to the census. Farm operating revenues include operating revenues from all agricultural products sold, program payments and custom work revenues.
The following items are not considered farm operating revenues: sales of forestry products (e.g., firewood, pulpwood, logs, fence posts and pilings); sales of capital items (e.g., quota, land, machinery); and revenues from the sale of any goods purchased only for retail sales.
Farm operating expenses
The Census of Agriculture collects total farm operating expenses, in current dollars, for the calendar or accounting year prior to the census. Farm operating expenses include any expenses associated with producing agricultural products (such as the cost of seed, feed, fuel and fertilizers).
The following items are not considered operating expenses: the purchase of land, buildings or equipment, depreciation, and capital cost allowance.
Goat farms refer to farms that reported one goat or more. It does not refer to farms classified to be goat farms by the North American Industry Classification System (NAICS).
Registered dairy goat farms refer to farms on the Ontario administrative goat list that were successfully linked to the Census of Agriculture. They do not necessarily constitute the full universe of dairy goat farms.
- Date modified: