
Canadian Agriculture at a Glance
A story about the diversity of Canada’s farm operators
Skip to text
Text begins
This article provides insights on the ethnocultural diversity of farm operators, according to various socioeconomic characteristics, such as racialized group or Indigenous self-identification, mother tongue, place of birth, immigrant status, gender, age, educational attainment, farm type, and revenue class. The article is based on data from the 2001 to 2021 Agriculture–Population Linkage (i.e., the linkage between the Census of Agriculture and the Census of Population).
Start of text boxMeasuring the ethnocultural diversity of farm operators
The measure used to present the ethnocultural diversity of farm operators is the Diversity Index (DI), which is derived using information from the 2021 Census of Population. To construct the DI, farm operators are classified into the following 14 mutually exclusive categories: 12 racialized groups (South Asian; Chinese; Black; Filipino; Arab; Latin American; Southeast Asian; West Asian; Korean; Japanese; racialized groups, n.i.e. [not included elsewhere]; and multiple racialized groups), plus Indigenous peoples and other (Caucasian in race or White in colour). The following formula is used to create the DI:
where is the share of farm operators belonging to ethnocultural group .
The DI ranges from 0% to 100%, with 0% indicating that every farm operator is in the same ethnocultural group and 100% indicating that all farm operators are in different ethnocultural groups. The larger the DI, the more diverse the farm operator group.
For example, a DI of 10.0% suggests that there is a 10.0% chance that two farm operators chosen at random (within the population being studied) will be from different ethnocultural groups.
British Columbia has the most diverse farm operator group
In 2021, British Columbia had the most diverse farm operator group among the provinces, with a DI of 30.8%. This comparatively high DI was attributable to the relatively large share (10.1%) of South Asian farm operators in British Columbia. Newfoundland and Labrador had the second-highest DI (13.7%) in 2021, largely because of a high proportion of farm operators who self-identified as Indigenous (6.0%).
By comparison, Prince Edward Island had the least diverse farm operator group among the provinces in 2021, with a DI of 2.1%. This low DI was attributable to the fact that 99.0% of farm operators in the province were from the “other” ethnocultural group (Table 1).
| Geography | Percent |
|---|---|
| Newfoundland and Labrador | 13.7 |
| Prince Edward Island | 2.1 |
| Nova Scotia | 3.6 |
| New Brunswick | 3.2 |
| Quebec | 3.5 |
| Ontario | 5.4 |
| Manitoba | 8.8 |
| Saskatchewan | 5.9 |
| Alberta | 5.1 |
| British Columbia | 30.8 |
| Canada | 7.9 |
| Source: Statistics Canada, Agriculture–Population Linkage, 2021. | |
Farm operators working on fruit and tree nut farms are more diverse
In 2021, fruit and tree nut farms had the most diverse farm operator group, with a DI of 37.3%, followed by greenhouse, nursery and floriculture farms (20.6%) and vegetable and melon farms (17.8%). Of the 11,235 farm operators who worked on fruit and tree nut farms, 2,010 self-identified as South Asian. This was the driving force behind the relatively high DI.
The higher the revenue class, the less diverse the farm operator group
In 2021, farms with less than $10,000 in operating revenues had the highest DI (12.3%) among revenue classes. An overall declining trend in the DI was observed as operating revenues increased along the revenue class distribution (Table 2).
| Revenue class | Percent |
|---|---|
| Less than $10,000 | 12.3 |
| $10,000 to $24,999 | 9.2 |
| $25,000 to $49,999 | 7.9 |
| $50,000 to $99,999 | 7.9 |
| $100,000 to $249,999 | 7.2 |
| $250,000 to $499,999 | 6.4 |
| $500,000 to $999,999 | 4.8 |
| $1,000,000 to $1,999,999 | 4.8 |
| $2,000,000 and over | 5.4 |
| Source: Statistics Canada, Agriculture–Population Linkage, 2021. | |
Racialized groups and Indigenous peoples represent less than 5% of Canada’s farm operators
Compared with nearly one-third (31.4%) of Canada’s total population, 4.1% of Canada’s farm operators self-identified as racialized or Indigenous in 2021.
Among the 5,390 farm operators who self-identified as being from a racialized group in 2021, over half were South Asian (53.7%), followed by Chinese (21.4%) and Black (4.9%) (Table 3).
In 2021, there were 5,405 farm operators who self-identified as Indigenous. Of these, 3,765 were Métis and 1,315 were First Nations people.
| Racialized group | Number | Percent |
|---|---|---|
| South Asian | 2,895 | 53.7 |
| Chinese | 1,155 | 21.4 |
| Black | 265 | 4.9 |
| Japanese | 225 | 4.2 |
| Latin American | 145 | 2.7 |
| Southeast Asian | 135 | 2.5 |
| Filipino | 125 | 2.3 |
| Racialized groups, n.i.e. | 100 | 1.9 |
| Multiple racialized groups | 95 | 1.8 |
| Korean | 95 | 1.8 |
| Arab | 80 | 1.5 |
| West Asian | 75 | 1.4 |
|
Note: Totals may not equal 100% due to rounding. Source: Statistics Canada, Agriculture–Population Linkage, 2021. |
||
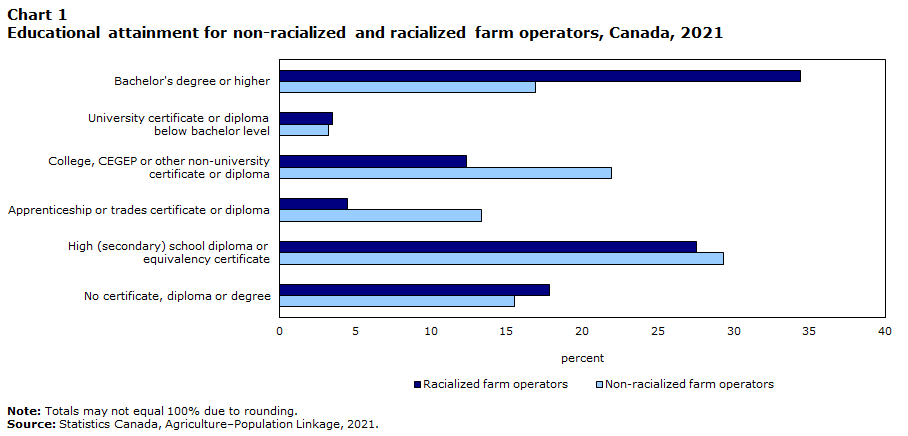
The percentage of racialized farm operators holding a bachelor’s degree or higher is more than double that of their non-racialized counterparts
In 2021, over one-third (34.4%) of racialized farm operators reported having a bachelor’s degree or higher, compared with 16.9% of their non-racialized counterparts. Meanwhile, one in five non-racialized farm operators (21.9%) had obtained a college, CEGEP or other non-university certificate or diploma, compared with 12.3% of racialized farm operators (Chart 1).
Data table for Chart 1
| Educational attainment | Racialized farm operators | Non-racialized farm operators |
|---|---|---|
| percent | ||
| Bachelor's degree or higher | 34.4 | 16.9 |
| University certificate or diploma below bachelor level | 3.5 | 3.2 |
| College, CEGEP or other non-university certificate or diploma | 12.3 | 21.9 |
| Apprenticeship or trades certificate or diploma | 4.5 | 13.3 |
| High (secondary) school diploma or equivalency certificate | 27.5 | 29.3 |
| No certificate, diploma or degree | 17.8 | 15.5 |
|
Note: Totals may not equal 100% due to rounding. Source: Statistics Canada, Agriculture–Population Linkage, 2021. |
||
The percentage of farm operators reporting French as their mother tongue is increasing
Over the past 20 years, farm operators reporting French as their mother tongue had the largest percentage point increase among official language mother tongues. In 2021, 17.3% of farm operators reported French as their mother tongue (French-speaking farm operators), up from 15.3% in 2001. This increase was caused by the relatively slow rate of decline in the number of French-speaking farm operators, compared with English and other mother tongues (Table 4).
| Mother tongue | 2001 | 2006 | 2011 | 2016 | 2021 |
|---|---|---|---|---|---|
| percent | |||||
| English | 71.0 | 71.3 | 71.7 | 72.2 | 72.5 |
| French | 15.3 | 15.4 | 16.7 | 16.9 | 17.3 |
| English and French | 0.2 | 0.1 | 0.1 | 0.2 | 0.2 |
| English and non-official language | 0.5 | 0.4 | 0.4 | 0.4 | 0.5 |
| French and non-official language | 0.0 | 0.0 | 0.0 | 0.0 | 0.0 |
| English, French and non-official language | 0.0 | 0.0 | 0.0 | 0.0 | 0.0 |
| All other mother tongues | 13.1 | 12.7 | 11.1 | 10.3 | 9.4 |
|
Note: Totals may not equal 100% due to rounding. Sources: Statistics Canada, Agriculture–Population Linkage, 2001 to 2021. |
|||||
Quebec was home to most of Canada’s French-speaking farm operators, accounting for 86.6% of the total in 2021, up from 81.5% in 2001. Notably, the number of French-speaking farm operators in Quebec increased from 38,825 in 2016 to 39,305 in 2021.
In 2001, dairy cattle and milk farms made up the largest share (28.0%) of farms managed by French-speaking farm operators in Canada, followed by other crop farms (16.2%). By comparison, more than one-quarter (27.7%) of Canada’s French-speaking farm operators worked on other crop farms in 2021, while 18.6% worked on dairy cattle and milk farms. The shift toward other crop farms was caused, in part, by the growth in the number of maple syrup farms in Quebec.
Start of text boxKey facts from 2021
Among the 45,385 farm operators reporting French exclusively as their mother tongue in 2021:
- 97.9% were born in Canada
- 54.4 years was the average age
- 27.8% were women
- 13.3% reported a bachelor’s degree or higher as their highest level of educational attainment
- 45.7% worked off the farm
- $40,973 was the median total income
- $50,831 was the average total income.
The share of farm operators with a mother tongue other than French or English declines
In 2021, 9.4% of all farm operators (24,650) were in the “all other mother tongues” category, down from 13.1% in 2001 (Table 4).
Over the past 20 years, farm operators whose mother tongue was neither English nor French most frequently reported German as their mother tongue. In 2021, this was still the case, with 40.9% reporting German as their mother tongue the highest share followed by Dutch (18.4%).
Notably, Punjabi became the third most common non-official mother tongue reported among farm operators, at 8.7% in 2021, up from 2.3% in 2001. This increase reflected the rise in the number of farm operators born in India, which more than doubled over this period, reaching 2,255 in 2021. By contrast, the share of farm operators reporting Ukrainian as their mother tongue decreased from 14.0% to 7.8% over the same period (Table 5).
Start of text boxKey facts from 2021
Among the 2,150 farm operators reporting Punjabi as their mother tongue in 2021:
- 94.0% worked in British Columbia
- 80.7% worked on fruit and tree nut farms
- 90.9% were born in India
- 55.1 years was the average age
- 30.7% were women
- 23.7% reported a bachelor’s degree or higher as their highest level of educational attainment
- 57.2% worked off the farm
- $37,662 was the median total income
- $49,742 was the average total income.
| Mother tongue | 2001 | 2006 | 2011 | 2016 | 2021 |
|---|---|---|---|---|---|
| percent | |||||
| German | 41.4 | 42.2 | 42.2 | 42.6 | 40.9 |
| Dutch | 18.5 | 18.6 | 20.8 | 20.0 | 18.4 |
| Punjabi (Panjabi) | 2.3 | 3.3 | 4.8 | 6.4 | 8.7 |
| Ukrainian | 14.0 | 12.0 | 10.7 | 8.6 | 7.8 |
| Italian | 2.4 | 3.1 | 2.9 | 2.7 | 3.4 |
| Mandarin | 0.1 | 0.2 | 0.4 | 1.2 | 2.3 |
| Polish | 2.4 | 2.7 | 2.4 | 2.0 | 2.0 |
| Cantonese | 0.4 | 0.6 | 0.6 | 1.4 | 1.5 |
| Russian | 0.7 | 0.8 | 0.6 | 1.0 | 1.4 |
| Portuguese | 1.8 | 1.7 | 1.2 | 1.6 | 1.1 |
| Sources: Statistics Canada, Agriculture–Population Linkage, 2001 to 2021. | |||||
Ontario continues to be the top provincial destination for immigrant farm operators
In 2021, Ontario was home to 34.0% of Canada’s immigrant farm operators, down from 38.5% in 2001. By contrast, British Columbia accounted for 28.2% of Canada’s immigrant farm operators in 2021, up from 24.2% in 2001.
Despite the growing presence of immigrants in the total population, the percentage of immigrant farm operators has decreased over time. In 2021, immigrants made up nearly one-quarter (23.1%) of the total population in Canada, which was the largest proportion in over 150 years, up from 18.7% in 2001. By contrast, immigrants accounted for 8.2% of Canada’s farm operators in 2021, down from 9.4% in 2001.
Immigrant farm operators have higher levels of educational attainment and are more likely to be women than their non-immigrant counterparts
In 2021, women accounted for 36.7% of Canada’s immigrant farm operators, up from 31.1% in 2001. By comparison, 29.9% of Canada’s non-immigrant farm operators were women in 2021, up from 26.1% in 2001.
Farm operators have higher levels of educational attainment than they did 20 years ago. Specifically, 16.7% of Canada’s non-immigrant farm operators reported a bachelor’s degree or higher in 2021, up from 8.4% in 2001. A similar but more prominent trend was seen among immigrant farm operators. From 2001 to 2021, the proportion of immigrant farm operators with a bachelor’s degree or higher increased from 11.4% to nearly one-quarter (23.5%).
Immigrant farm operators are older than their non-immigrant counterparts
In 2021, the average age of immigrant farm operators was 60.1 years, up from 54.3 years in 2001. By comparison, the average age of non-immigrant farm operators in 2021 was 56.2 years, up from 49.4 years in 2001.
Looking at detailed age groups, the proportion of immigrant farm operators aged 55 years and over increased from 49.5% in 2001 to 66.7% in 2021. Meanwhile, the proportion of non-immigrant farm operators in this age group increased from one-third (33.3%) in 2001 to 59.9% in 2021.
Conversely, the proportion of younger immigrant farm operators (under 35 years) dropped from 7.3% in 2001 to 4.7% in 2021. Over the same period, the proportion of younger non-immigrant farm operators decreased from 12.2% to 9.0% (Table 6).
| Age group | Immigrant farm operators | Non-immigrant farm operators | ||||||||
|---|---|---|---|---|---|---|---|---|---|---|
| 2001 | 2006 | 2011 | 2016 | 2021 | 2001 | 2006 | 2011 | 2016 | 2021 | |
| percent | ||||||||||
| Under 35 years | 7.3 | 5.0 | 4.3 | 4.9 | 4.7 | 12.2 | 9.5 | 8.6 | 9.6 | 9.0 |
| 35 to 54 years | 43.2 | 40.8 | 36.8 | 33.7 | 28.6 | 54.5 | 51.2 | 44.2 | 36.6 | 31.1 |
| 55 years and over | 49.5 | 54.2 | 58.9 | 61.4 | 66.7 | 33.3 | 39.3 | 47.2 | 53.8 | 59.9 |
|
Note: Totals may not equal 100% due to rounding. Sources: Statistics Canada, Agriculture–Population Linkage, 2001 to 2021. |
||||||||||
Announcement
More details on the Indigenous farm population will be available in a separate upcoming glance article.
Note to readers
The data in this article exclude people residing in Canada's three territories and collective dwellings.
The diversity index is based on the Herfindahl-Hirschman Index.
Definitions and concepts
Farm definition
A significant conceptual change has been introduced for the 2021 Census of Agriculture: a “farm” or an “agricultural holding” (i.e., the census farm) now refers to a unit that produces agricultural products and reports revenues or expenses for tax purposes to the Canada Revenue Agency. Before 2021, a “farm” was defined as an agricultural operation that produced at least one agricultural product intended for sale. For more information, refer to the Census of Population dictionary.
Farm operator
Farm operator refers to any person responsible for the management decisions in operating a farm or agricultural operation. Also known as an agricultural operator, farmer, operator or rancher.
Farm type
The type of farm is established through a procedure that classifies each census farm according to the predominant type of production. This is done by estimating the potential revenues from the inventories of crops and livestock reported on the questionnaire and determining the product or group of products that makes up the majority of the estimated receipts. For example, a census farm with total potential revenues of 60% from hogs, 20% from beef cattle and 20% from wheat would be classified as a hog and pig farm. The farm types presented in this document are derived based on the 2017 North American Industry Classification System. For more information, refer to the Census of Population dictionary.
Indigenous peoples
This includes those who identify as First Nations (North American Indian), Métis and/or Inuk (Inuit), and/or those who report being Registered or Treaty Indians (that is, registered under the Indian Act of Canada), and/or those who have membership in a First Nation or Indian band.
Men
This gender category includes men (and/or boys) and may include some non-binary persons as well.
Racialized group
The concept of "racialized group" is derived directly from the detailed "visible minority" variable in the census. The variable "visible minority" comes from the Employment Equity Act and refers to whether a person is a visible minority. The act defines visible minorities as "persons, other than Aboriginal peoples, who are non-Caucasian in race or non-white in colour." The visible minority population consists of the following 12 groups: South Asian, Chinese, Black, Filipino, Arab, Latin American, Southeast Asian, West Asian, Korean, Japanese, Visible minority, n.i.e., or Multiple visible minorities.
Women
This gender category includes women (and/or girls) and may include some non-binary persons as well.
- Date modified: