
Canadian Agriculture at a Glance
Female farm operator numbers increase for the first time in 30 years
by Susana Aclan and Zong Jia Chen
Skip to text
Text begins
Female farm operators play a pivotal role in Canadian agriculture. Their tireless work ethic, leadership skills and organizational expertise are shaping the landscape of the agriculture industry across Canada.
Recent federal government initiatives such as the Women Entrepreneur Program have been introduced to support female entrepreneurs involved in the agriculture and agri-food sector. This program was launched in March 2019 and invested $500 million over a three-year period.
At the same time, the number of female supervisors and workers in technical occupations increased in recent years. The Labour Force Survey reported a 19.4% increase from 2017 to 2021 in the number of combined female supervisors and workers in Canada working in natural resources, agriculture and related production.
Data from the 2021 Census of Agriculture show that female farm operator numbers increased for the first time since 1991, when the Census of Agriculture started collecting data for up to three farm operators. In 2021, there were 79,795 female farm operators reported in Canada, up from 77,970 in 2016. This number was an increase of 2.3% (+1,825). By comparison, male farm operator numbers dropped by 5.8% over the same period.
This article identifies where the net increase in female farm operators is coming from. It then looks at how female farm operator numbers are reflected in the face of the modernization and adaptation of the agriculture industry.
A steady increase in the proportion of female farm operators
In 2021, 30.4% of Canada’s farm operators were female, up from 28.7% in 2016. It is not the first time that the proportion of female farm operators has increased between census periods. In fact, there have been several increases in the proportion of female farm operators over the previous seven census periods.
Historical data from the Census of Agriculture show that total farm operator numbers have declined by 32.9% over the past 30 years. In 2021, there were 262,455 total farm operators reported in Canada, down from 390,875 in 1991. While the number of female and male farm operators both declined during this period (from 1991 to 2021), the rate of decline was steeper for male farm operators, which resulted in an increase in the proportion of female farm operators (Chart 1).

Data table for Chart 1
| Female farm operators | Total farm operators | Female farm operators | |
|---|---|---|---|
| number | percent | ||
| 1991 | 100,325 | 390,875 | 25.7 |
| 1996 | 97,345 | 385,610 | 25.2 |
| 2001 | 91,180 | 346,195 | 26.3 |
| 2006 | 90,840 | 327,060 | 27.8 |
| 2011 | 80,665 | 293,925 | 27.4 |
| 2016 | 77,970 | 271,935 | 28.7 |
| 2021 | 79,795 | 262,455 | 30.4 |
|
Source: Statistics Canada, Census of Agriculture, 1991 to 2021 (3438). |
|||
One-operator farms account for the entire increase of female farm operators
In 2021, 16,590 female farm operators reported managing one-operator farms in Canada, an increase of 26.5% (+3,480) from 2016. About one in seven (14.9%) one-operator farms in Canada were managed by female operators in 2021, up from 11.5% in 2016. Meanwhile, the number of male operators managing one-operator farms decreased by 5.9% (-5,960) over the same period.
The net increase between 2016 and 2021 in female farm operators managing one-operator farms was driven by Alberta (+1,065), followed by Saskatchewan (+855). Correspondingly, the two farm types that contributed the most to the net increase of female farm operators managing one-operator farms were beef farms (+1,495) and oilseed and grain farms (+1,035). These two farm types are heavily concentrated in these two provinces.
Conversely, the number of female farm operators managing multiple-operator farms decreased by 2.6% (-1,655) from 2016 to 2021. The number of male farm operators working on multiple-operator farms also decreased, but at a larger rate (-5.7%).
The biggest increase in female farm operators is coming from the top three revenues classes
In Canada, the largest net increase in female farm operators from 2016 to 2021 was reported among farms with revenues from $1,000,000 to $1,999,999 (+1,325), followed by farms with revenues of $2,000,000 and over (+1,195).
The next largest net increase in female farm operators from 2016 to 2021 was reported among farms with revenues from $500,000 to $999,999 (+815), followed by farms with under $10,000 in revenues (+410). Likewise, a similar trend was seen for male farm operators in the $2,000,000 and over revenues class (+2,600) (Table 1).
| Revenues class | 2016 | 2021 | 2016 to 2021 | |
|---|---|---|---|---|
| number | change | % | ||
| $0 to $9,999 | 17,585 | 17,995 | 410 | 2.3 |
| $10,000 to $24,999 | 11,495 | 10,930 | -565 | -4.9 |
| $25,000 to $49,999 | 9,495 | 9,235 | -260 | -2.7 |
| $50,000 to $99,999 | 9,240 | 9,160 | -80 | -0.9 |
| $100,000 to $249,999 | 10,960 | 10,580 | -380 | -3.5 |
| $250,000 to $499,999 | 8,275 | 7,650 | -625 | -7.6 |
| $500,000 to $999,999 | 6,330 | 7,145 | 815 | 12.9 |
| $1,000,000 to $1,999,999 | 3,195 | 4,520 | 1,325 | 41.5 |
| $2,000,000 and over | 1,385 | 2,580 | 1,195 | 86.3 |
|
Sources: Statistics Canada, Census of Agriculture, 2016 and 2021 (3438). |
||||
The increase in female farm operators comes from the older age group
From 2016 to 2021, the number of female farm operators in Canada aged 55 years and over increased by 7,245 (+17.7%). The rate of increase for older female farm operators was more than five times the rate of their male counterparts (+3.1%).
In 2021, around 6 in 10 (60.5%) female farm operators in Canada were 55 years and over. It was an increase from 52.6% in 2016. Among provinces, Newfoundland and Labrador had the largest share (65.2%) of female farm operators in the older age group in 2021, while Quebec had the smallest share (51.5%).
From 2016 to 2021, the number of female farm operators aged younger than 35 years (younger group) and those aged 35 to 54 years (middle-aged group) decreased by 620 (-9.5%) and 4,790 (-15.8%), respectively.
This same trend was reported in male farm operators. From 2016 to 2021, the number of male farm operators declined in these two categories; the younger group of male farm operators decreased by 1,590 (-8.7%) while the middle-aged group decreased by 13,005 (-19.0%) (Chart 2).

Data table for Chart 2
| Under 35 years | 35 to 54 years | 55 years and over | |
|---|---|---|---|
| percent | |||
| N.L. | 5.4 | 29.5 | 65.2 |
| P.E.I | 5.3 | 36.4 | 58.3 |
| N.S. | 7.0 | 29.4 | 63.6 |
| N.B. | 5.6 | 34.8 | 59.6 |
| Que. | 8.2 | 40.3 | 51.5 |
| Ont. | 7.0 | 30.1 | 62.9 |
| Man. | 9.3 | 34.2 | 56.5 |
| Sask. | 7.7 | 30.6 | 61.7 |
| Alta. | 8.2 | 30.3 | 61.5 |
| B.C. | 4.9 | 30.3 | 64.8 |
|
Source: Statistics Canada, Census of Agriculture, 2021 (3438). |
|||
A growing number of female farm operators working on farms report direct sales or organic products
In 2020, 14,475 female farm operators worked on farms that reported direct sales, up from 13,200 in 2015. The proportion of female farm operators on farms reporting direct sales also increased. In 2020, 37.2% of total farm operators working on farms that reported direct sales were female, up from 35.6% in 2015.
The female farm operator presence on farms that reported organic products also increased. In 2021, there were 2,560 female farm operators working on farms that reported organic products, up by 30.4% from 2016. Most of this net increase (+595) of female farm operators was from multiple-operator farms (85.0%).
An increasing number of female farm operators working on farms use sustainable energy sources or technology
Female farm operators in Canada have wide-ranging skills and expertise that help them play multiple roles on the farm. They use leading-edge technology to improve efficiencies on the farm and sustain the environment.
The number of female operators working on farms that reported renewable energy production more than doubled since the previous census, totalling 10,340 in 2021. Meanwhile, the share of female operators among the total of farm operators who reported working on farms with renewable energy production also grew from 29.9% to 32.0%.
In 2020, over a quarter (25.7%) of Canada’s farm operators who worked on farms reporting fully-robotic milkers were female farm operators, up from 24.0% in 2015.
Additionally, the number of female farm operators who worked on farms with automated guidance steering systems (auto-steer) increased by 45.0% from the previous census. In 2020, there were 17,755 female farm operators who worked on farms reporting auto-steer, an increase of 5,510 female farm operators from 2015.
There was also a 72.3% increase in the number of female farm operators that worked on farms reporting geographic information systems (GIS) mapping. From 2015 to 2020, there was an increase of 4,050 female farm operators who worked on farms with GIS mapping.
Ontario reported the highest increase in Canada in the number of female operators that worked on farms with GIS mapping (+1,420) and auto-steer (+1,865). Saskatchewan and Alberta followed closely with a contribution of 2,295 and 2,410, respectively (Chart 3).

Data table for Chart 3
| 2016 | 2021 | |
|---|---|---|
| number | ||
| Automated guidance steering systems | 12,246 | 17,756 |
| Geographic Information System mapping | 5,599 | 9,650 |
| Fully-robotic milkers | 488 | 1,052 |
|
Source: Statistics Canada, Census of Agriculture, 2016 and 2021 (3438). |
||
The number of female farm operators working off the farm is increasing at a faster rate than that of their male counterparts
In 2020, 38,610 female farm operators reported working off the farm in Canada, a 10.2% increase (+3,570) from 2015. This rise was nearly nine times higher than that of their male counterparts (+1.2%). Additionally, the proportion of female farm operators who reported off-farm work increased from 44.9% in 2015 to 48.4% in 2020, which was a slightly higher rise than that of their male counterparts (47.5%).
Over the past five years, the net increase in the number of off-farm female operators was reflected largely in full-time employment (+2,445). In 2020, 27.9% of female farm operators worked full-time off the farm, up from 25.5% in 2015. Among provinces, female farm operators in Newfoundland and Labrador reported the highest full-time employment rate (33.0%) for off-farm work in 2020, whereas Alberta saw the lowest rate (26.6%). However, there is no data available on the type of work female farm operators do while working off the farm (Chart 4).
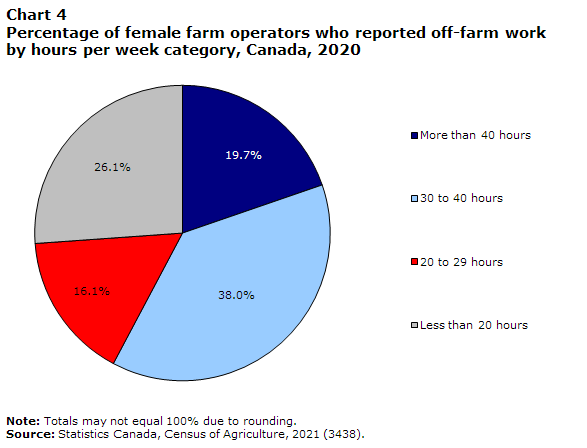
Data table for Chart 4
| More than 40 hours | 30 to 40 hours | 20 to 29 hours | Less than 20 hours | |
|---|---|---|---|---|
| percent | ||||
| 2020 | 19.7 | 38.0 | 16.1 | 26.1 |
| Source: Statistics Canada, Census of Agriculture, 2021 (3438). | ||||
Operators aged 55 years and over are driving the net increase in the number of female farm operators working off the farm
The net increase in the number of female farm operators working off the farm is entirely in those aged 55 years and over (older group). In 2020, there were 19,300 female farm operators aged 55 years and over who worked off the farm, an increase of 5,520 from 2015. As a result, this group’s share of total female farm operators who reported off-farm work increased from 39.3% to 50.0% over the same period. Likewise, the increase in the number of male farm operators working off the farm was also only in the older group (+6,830) (Chart 5).
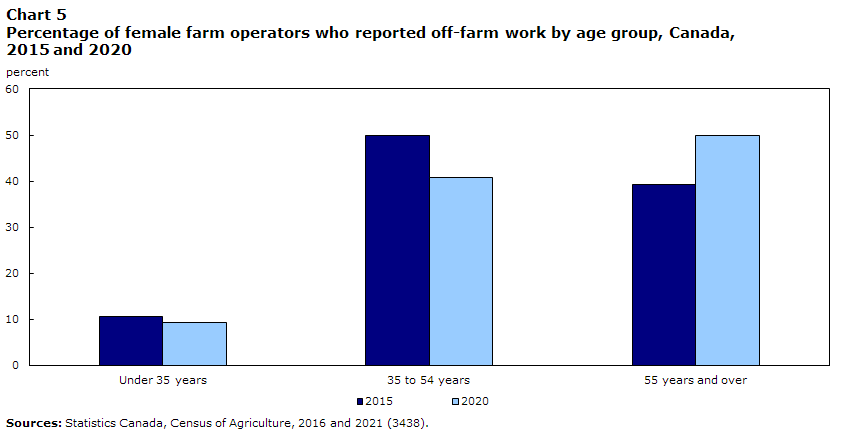
Data table for Chart 5
| 2015 | 2020 | |
|---|---|---|
| percent | ||
| Under 35 years | 10.7 | 9.2 |
| 35 to 54 years | 50.0 | 40.8 |
| 55 years and over | 39.3 | 50.0 |
|
Source: Statistics Canada, Census of Agriculture, 2016 and 2021 (3438). |
||
Where are female farm operators located in Canada?
As was the case in 2016, Ontario had the most female farm operators. In 2021, this province had 20,895 female farm operators, representing 26.2% of the national total. Alberta was second with 18,525 female farm operators (23.2% of total), followed by Saskatchewan and Quebec (Table 2).
The proportion of female farm operators in each province varied across the country (Chart 6). In 2021, British Columbia had the highest proportion of female farm operators (39.7%). Of the 9,390 female farm operators working in British Columbia, the largest portion of them worked on other crops farms.
By contrast, one-fifth (20.0%) of total farm operators in Prince Edward Island were female in 2021. It was the lowest mark among provinces. Of the 320 female farm operators in Prince Edward Island, the largest portion of them worked on dairy and milk farms (Chart 6).
What types of farms do female farm operators work on in Canada?
With respect to farm type, sheep and goat farms had the highest percentage of female farm operators. In 2021, 41.1% of farm operators working on farms classified as sheep and goat were female, up from 39.7% in 2016. Conversely, oilseed and grain farms had the lowest percentage of female farm operators (25.6%) in 2021 (Chart 7).
For more information on female farm operators, visit the Census of Agriculture: Farm and Farm Operator Data Visualization Tool and the infographic, “A portrait of Canada’s female farm operators”.
| Province | 2016 | 2021 | 2016 to 2021 | |
|---|---|---|---|---|
| number | change | % | ||
| Newfoundland and Labrador | 115 | 115 | 0 | 0.0 |
| Prince Edward Island | 330 | 320 | -10 | -3.0 |
| Nova Scotia | 1,265 | 1,115 | -150 | -11.9 |
| New Brunswick | 665 | 585 | -80 | -12.0 |
| Quebec | 10,945 | 11,690 | 745 | 6.8 |
| Ontario | 20,905 | 20,895 | -10 | 0.0 |
| Manitoba | 4,785 | 5,150 | 365 | 7.6 |
| Saskatchewan | 11,275 | 12,010 | 735 | 6.5 |
| Alberta | 17,760 | 18,525 | 765 | 4.3 |
| British Columbia | 9,925 | 9,390 | -535 | -5.4 |
|
Sources: Statistics Canada, Census of Agriculture, 2016 and 2021 (3438). |
||||
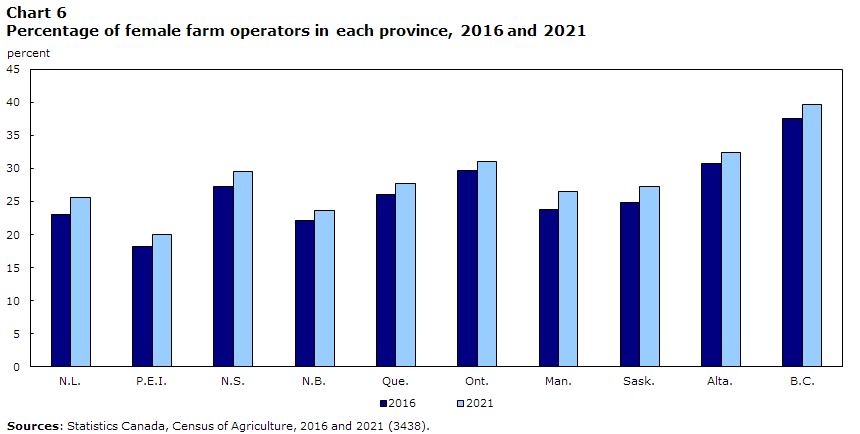
Data table for Chart 6
| 2016 | 2021 | |
|---|---|---|
| percent | ||
| N.L. | 23.0 | 25.6 |
| P.E.I | 18.2 | 20.0 |
| N.S. | 27.3 | 29.5 |
| N.B. | 22.1 | 23.6 |
| Que. | 26.1 | 27.7 |
| Ont. | 29.7 | 31.0 |
| Man. | 23.8 | 26.5 |
| Sask. | 24.9 | 27.2 |
| Alta. | 30.8 | 32.4 |
| B.C. | 37.6 | 39.7 |
|
Source: Statistics Canada, Census of Agriculture, 2016 and 2021 (3438). |
||

Data table for Chart 7
| 2016 | 2021 | |
|---|---|---|
| percent | ||
| Dairy and milk production | 25.9 | 27.4 |
| Beef farming and feedlots | 29.1 | 31.0 |
| Hog and pig farming | 27.7 | 29.1 |
| Poultry and egg production | 34.2 | 35.8 |
| Sheep and goat farming | 39.7 | 41.1 |
| Other animal production | 39.6 | 40.7 |
| Oilseed and grain farming | 22.9 | 25.6 |
| Vegetable and melon farming | 32.4 | 32.8 |
| Fruit and tree nut farming | 30.8 | 33.8 |
| Greenhouse, nursery and floriculture production | 33.0 | 34.7 |
| Other crop farming | 29.0 | 30.8 |
|
Source: Statistics Canada, Census of Agriculture, 2021 (3438). |
||
Note to readers
Definitions and concepts
A significant conceptual change to the main statistical unit used by Statistics Canada’s Agriculture Statistics Program has been introduced for the 2021 Census of Agriculture; a “farm”, or an “agricultural holding” (i.e., the census farm), now refers to a unit that produces agricultural products and reports revenues or expenses for tax purposes to the Canada Revenue Agency. Before 2021, the term “farm” was defined as an agricultural operation that produced at least one agricultural product intended for sale.
The data displayed by geography have undergone random tabular adjustment. The Canada total data for geographic breakdowns may differ from the Canada total data displayed in tables by North American Industry Classification System (NAICS) category and sales class.
National data presented in this article exclude data from Canada’s three territories.
The Census of Agriculture is conducted every five years and is a census of all agricultural operations that produces agricultural products and reports revenues or expenses for tax purposes to the Canada Revenue Agency.
Farm type is established through a procedure that classifies each census farm according to the predominant type of production. It is done by estimating the potential revenues from the inventories of crops and livestock reported on the questionnaire and determining the product or group of products that make up most of the estimated receipts. For example, a census farm with total potential revenues of 60% from hogs, 20% from beef cattle and 20% from wheat would be classified as a hog and pig farm. The farm types presented in this document are derived based on the 2017 NAICS.
Farm operator refers to any person responsible for the management decisions in operating a farm or an agricultural operation. It is also known as an agricultural operator, farmer, operator or rancher.
Price indexes were used to obtain constant dollar estimates of revenues in order to eliminate the impact of price change in year-to-year comparisons.
Farm operating revenues come from the Agriculture Taxation Data Program. Previously, revenues for agricultural operations were reported to the Census of Agriculture. Caution should be taken when comparing the 2021 Census of Agriculture data with those of previous censuses.
The Census of Agriculture measures farm operating revenues (in current dollars) for the calendar or accounting year before the census. Farm operating revenues (before deducting expenses) in this analysis include operating revenues from all agricultural products sold, program payments and custom work revenues.
The following are not included in farm operating revenues: sales of forestry products (e.g., firewood, pulpwood, logs, fence posts and pilings); sales of capital items (e.g., quota, land, machinery); and revenues from the sale of any goods purchased only for retail sales.
Census Day was May 11, 2021. Farmers were asked to report their operating revenues and expenses for the last complete fiscal or calendar year (2020).
Full-time employment is classified as farm operators who worked 30 hours or more per week; part-time employment is classified as farm operators who worked less than 30 hours per week.
Off-farm work is time spent doing paid work at another job or operating another business not involved with the farm operator’s agricultural operation. Off-farm work includes work for another farm operation or work for a non-farm business.
Some data refer to a reference period other than Census Day. They include financial data, direct sales data, off-farm work data, technology data and renewable energy production data.
- Date modified: