
Canadian Agriculture at a Glance
Small-scale diversified farming prominent in Yukon and the Northwest Territories
Skip to text
Text begins
Yukon and the Northwest Territories cover a large stretch of land up to the Arctic Circle, of which a significant portion is not suitable for farming or grazing. Additionally, its climate is characterized by a short summer and a long, cold winter. Despite challenges to farming in this northern region of Canada, data from the 2021 Census of Agriculture shows that agriculture covers a range of commodities and activities including: raising livestock, growing fruits and vegetables and poultry and egg farming.
Fewer farms in the North
In 2021, there were 96 farms reported in Yukon and the Northwest Territories which was a drop of 39.2% from 2016. By comparison, the number of farms declined by 1.9% in the rest of Canada. In 2021, Yukon reported 88 farms, while the Northwest Territories reported 8 farms. There were no farms reported in Nunavut.
Horse and other equine lead farm types in the North
In 2021, the most frequently reported farm type in Yukon and Northwest Territories was horse and other equine, with 15 farms. Horse and equine farms are reported under “other animal production” farms. Farms classified as other animal production accounted for the biggest proportion (29.2%) of farms reported in the territories. This was followed by other crop farms (22.9%), poultry and egg farms (11.5%) and greenhouse, nursery and floriculture farms (10.4%).
Majority of farm revenues coming from poultry and egg farms
In 2020, over half (57.7%) of reported farm operating revenues in Yukon and the Northwest Territories came from poultry and egg farms. This was followed by other crop farms (11.5%) and vegetable and melon farms (10.4%). In 2020, the two territories combined for $12.4 million in farm operating revenues.
Total farm area in Yukon and the Northwest Territories has declined
Yukon and the Northwest Territories farms reported a decrease in farm area from 2016 to 2021. In 2021, total farm area reported was 16,470 acres, down 36.3% from 2016. Almost all farm area in the North (99.3%) was located in Yukon, while the remaining 0.7% was located in the Northwest Territories. The largest portion of area in 2021 came from horse and other equine farms (35.6%), followed by “other crop" farms (31.7%) and greenhouse, nursery and floriculture operations (12.8%).
Average farm area in Yukon and the Northwest Territories is smaller than the rest of Canada
In 2021, the average total farm area in Yukon and the Northwest Territories was 171.6 acres. This was significantly lower than the average total farm area reported across Canada (809.4 acres). The only other province that had a lower average total farm area was Newfoundland and Labrador (143.7 acres). Farm size in the North is partly influenced by the fact that a significant portion of the area is not suitable for farming or grazing.
Greenhouse area is increasing
Despite a decline in total farm area from 2016 to 2021, greenhouse area in Yukon and the Northwest Territories increased by 54.8%. This was higher than the increase seen across Canada over the same period (23.2%). Farms in these two territories reported 76,007 square feet of greenhouse area.
Woodland, pasture and cropland acreage in the North has decreased
The largest decrease in total farm area in Yukon and the Northwest Territories came from woodland and wetlands. In 2021, the territories reported 2,196 acres of woodland and wetlands, down 57.1% from 5,119 acres in 2016.
The territories reported 6,461 acres of natural land for pasture in 2021, down 26.2% from 2016. Yukon and the Northwest Territories also had a 20.7% decrease in tame and seeded pasture area, with 1,556 acres reported in 2021.
In 2021, 5,240 acres of cropland was reported in the territories, down 17.1% from 2016. Other tame hay (42.0%) made up the biggest part of cropland in the territories. This was followed by alfalfa (23.7%).
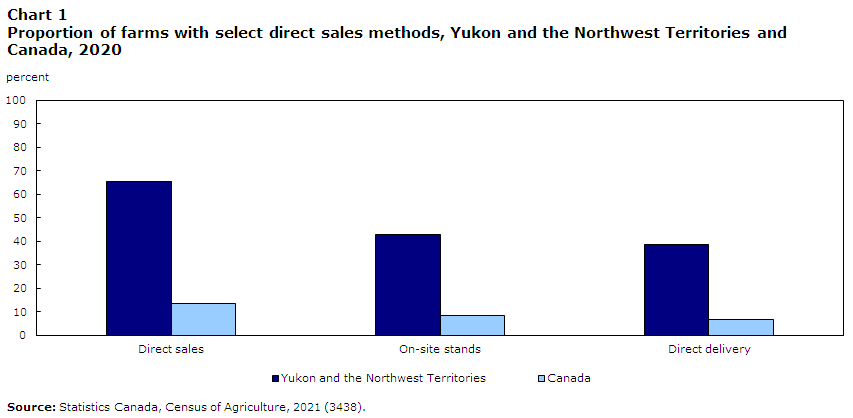
Yukon and the Northwest Territories lead Canada in direct sales rate
In 2020, 65.6% of farms (63 of 96 farms) in Yukon and the Northwest Territories reported direct sales, up from 48.1% in 2015. By comparison, 13.6% of farms in Canada reported direct sales. The high rate of direct sales in the North is a reflection of the community’s engagement in agricultural activities.
Yukon had 55 farms with direct sales, while the Northwest Territories made up the remaining 8 farms. In the territories, the most frequently reported method of direct sales was on-site farm stands, which were reported by 41 farms in 2020. This was closely followed by direct delivery (37 farms).
Data table for Chart 1
| Direct sales | On-site stands | Direct delivery | |
|---|---|---|---|
| percent | |||
| Yukon and the Northwest Territories | 65.6 | 42.7 | 38.5 |
| Canada | 13.6 | 8.2 | 6.8 |
| Source: Statistics Canada, Census of Agriculture, 2021 (3438). | |||
More farms in the North are producing renewable energy
The proportion of farms in Yukon and Northwest Territories reporting renewable energy production more than doubled. In 2021, 37.5% of farms in the Yukon and Northwest Territories reported renewable energy production, up from 15.2% in the previous census.
In Yukon and the Northwest Territories, the most frequently reported type of renewable energy production was solar energy. In 2021, 35 farms (36.5%) reported solar energy production, up from 23 farms (14.6%) in the previous census.
The rate of technology use in the North is rising
In 2020, 27.1% of farms in the Yukon and Northwest Territories reported using at least one technology.
The most frequently reported technology was soil sample testing. Around one-fifth (19.8%) of farms (19 farms) in the Yukon and Northwest Territories reported the use of soil sample testing in 2020. Soil sample testing is used to gather information about the level of plant nutrients in the soil. Soil testing may also be used to determine whether contaminants are present in the soil.
The next most frequently reported technology in the territories was slow-release fertilizer. In 2020, 13 farms (13.5%) in the North reported the use of slow-release fertilizer. Slow or controlled-release fertilizer is a granulated fertilizer that releases nutrients gradually into the soil. Controlled-release fertilizers do not dissolve in water as easily as conventional fertilizers.
Farm operator numbers in the Yukon and the Northwest Territories are declining
There were 150 farm operators reported in the North in 2021, down from 230 in 2016. In 2021, 90.0% of farm operators reported in the North were in Yukon, while the other 10.0% were in the Northwest Territories.
The North has the highest proportion of female farm operators in the country
In 2021, over two-fifths (43.3%) of the 150 farm operators reported in the Yukon and Northwest Territories were female. This was an increase in the proportion of female operators, up from 41.3% in 2016.
The average farm operator is younger than the rest of Canada
The average age of farm operators in 2021 in the Yukon was 54.5 and in the Northwest Territories it was 51.7. The average age for both territories was younger than the average age of 56.0 in Canada.
In 2021, 53.3% of farm operators reported in Yukon and the Northwest Territories were 55 years old or older (older farm operators), up from 50.0% in 2016. Despite the increase, the North still had a smaller proportion of older farm operators than the rest of Canada (60.5%).

Data table for Chart 2
| Under 35 years | 35 to 54 years | 55 years and older | |
|---|---|---|---|
| percent | |||
| Yukon and the Northwest Territories | 3.3 | 40.0 | 53.3 |
| Canada | 8.6 | 30.9 | 60.5 |
|
Note: Totals may not equal 100% due to rounding. Source: Statistics Canada, Census of Agriculture, 2021 (3438). |
|||
The proportion of farm operators working off the farm is decreasing
In 2020, 60.0% of farm operators in Yukon and the Northwest Territories reported working off the farm, down from 71.7% in 2015. This rate was still above the national average (47.7%). Among those who worked off the farm, there was a decrease in the proportion of farm operators in Yukon and the Northwest Territories working 30 to 40 hours per week off the farm from 36.4% to 33.3%. Conversely, there was an increase in the proportion of farm operators working more than 40 hours per week off the farm from 27.3% to 27.8%.

Data table for Chart 3
| 2015 | 2020 | |
|---|---|---|
| percent | ||
| More than 40 hours | 27.3 | 27.8 |
| 30 to 40 hours | 36.4 | 33.3 |
| 20 to 29 hours | 15.2 | 11.1 |
| Less than 20 hours | 21.2 | 27.8 |
|
Note: Totals may not equal 100% due to rounding. Sources: Statistics Canada, Census of Agriculture, 2016 and 2021 (3438). |
||
Definitions and concepts
A significant conceptual change to the main statistical unit used by Statistics Canada’s Agriculture Statistics Program has been introduced for the 2021 Census of Agriculture: a “farm” or an “agricultural holding” (i.e., the census farm) now refers to a unit that produces agricultural products and reports revenues or expenses for tax purposes to the Canada Revenue Agency. Before 2021, a “farm” was defined as an agricultural operation that produced at least one agricultural product intended for sale
In 2021, there have been changes to the definition of a census farm; in Yukon and Northwest Territories, some activities that were previously included within the definition are not included in 2021. Caution should be taken when comparing the 2021 Census of Agriculture data with data from previous censuses.
The data displayed by geography have undergone random tabular adjustment. The Canada total data for geographic breakdowns may differ from the Canada total data displayed in tables by North American Industry Classification System (NAICS) category and sales class.
The data for Yukon and the Northwest Territories are not included in the national totals; they are presented separately.
The Census of Agriculture is conducted every five years and is a census of all agricultural operations that produces agricultural products and reports revenues or expenses for tax purposes to the Canada Revenue Agency. Important concepts used in this analysis include:
Total farm area, which is land owned or operated by an agricultural operation, includes: cropland, summer fallow, improved and unimproved pasture, woodlands and wetlands, all other land (including idle land and land on which farm buildings are located).
Total farm area includes the total area of land owned, leased, rented, crop-shared or used by this operation minus land area used by others.
Cropland is the total area of field crops, hay, field vegetables, fruits, berries, nuts, sod, nursery products and Christmas trees.
Farm type is established through a procedure that classifies each census farm according to the predominant type of production. This is done by estimating the potential revenues from the inventories of crops and livestock reported on the questionnaire and determining the product or group of products that make up the majority of the estimated receipts. For example, a census farm with total potential revenues of 60% from hogs, 20% from beef cattle and 20% from wheat, would be classified as a hog and pig farm. The farm types presented in this document are derived based on the 2017 NAICS.
Farm operator refers to any person responsible for the management decisions in operating a farm or agricultural operation. Also known as an agricultural operator, farmer, operator or rancher.
Farm employees include both farm operators and agricultural workers.
Price indexes were used to obtain constant dollar estimates of sales, export values and farm assets in order to eliminate the impact of price change in year-to-year comparisons.
Farm operating revenues
Farm operating revenues come from the Agriculture Taxation Data Program (ATDP). Previously, revenues for agricultural operations were reported to the Census of Agriculture. Caution should be taken when comparing the 2021 Census of Agriculture data with previous censuses.
The Census of Agriculture measures farm operating revenues (in current dollars) for the calendar or accounting year prior to the census. Farm operating revenues (before deducting expenses) in this analysis include: operating revenues from all agricultural products sold, program payments and custom work revenues.
The following are not included in farm operating revenues: sales of forestry products (for example: firewood, pulpwood, logs, fence posts and pilings); sales of capital items (for example: quota, land, machinery); and revenues from the sale of any goods purchased only for retail sales.
Total operating expenses
Total operating expenses come from the ATDP. Previously, expenses for agricultural operations were reported to the Census of Agriculture. Caution should be taken when comparing the 2021 Census of Agriculture data with previous censuses.
The Census of Agriculture measures operating expenses (in current dollars) for the calendar or accounting year prior to the census. Total operating expenses include any expense associated with producing agricultural products (such as the cost of seed, feed, fuel, fertilizers).
The following are not included in total operating expenses: the purchase of land, buildings or equipment, and depreciation or capital cost allowance. Depreciation represents economic "wear and tear" expense. Capital cost allowance represents the amount of depreciation written off by the tax filer as allowed by tax regulations.
Expenses-to-revenues ratio
The expenses-to-revenues ratio is the average amount of operating expenses incurred for a dollar in farm operating revenues. The ratio is calculated in current dollars.
Census Day was May 11, 2021. Farmers were asked to report their operating revenues and expenses for the last complete fiscal or calendar year (2020).
Full-time employment is classified as farm operators who worked 30 hours or more per week; part-time employment is classified as farm operators who worked less than 30 hours per week.
Some data refer to a reference period other than Census Day. For example, for financial data the reference period is the calendar or accounting (fiscal) year prior to the census.
- Date modified: