
Canadian Agriculture at a Glance
Saskatchewan continues to live up to the title of breadbasket of Canada
Skip to text
Text begins
Saskatchewan is often referred to as the breadbasket of Canada because of all the grains produced in this Prairie province. Its vast array of wide open spaces, flat land and rich agricultural soil makes it an ideal place to grow field crops. The province is also among the world’s largest exporters of various field crops, such as canola. Data from the 2021 Census of Agriculture show how the province leads the country in the cultivation of cereal grains, oilseeds and pulses.
Saskatchewan makes up the most farm area in Canada
Farms in the province accounted for the biggest share of Canada’s total farm area (39.2%). In 2021, farms in Saskatchewan reported 60.3 million acres of total farm area, down 2.1% from 2016. The vast majority of Saskatchewan’s total farm area was made up of cropland (66.9%). This was slightly higher than what was reported across the country. In 2021, cropland accounted for 60.9% of Canada’s total farm area.
Saskatchewan is home to more than two-fifths of Canada’s total cropland
In 2021, farms in Saskatchewan accounted for 43.1% of Canada’s cropland. Farms in the province reported 40.3 million acres of cropland, down 0.4% from 2016.
Farms classified as oilseed and grain accounted for 90.2% of the province’s total cropland. Canola was the province’s largest crop, which accounted for 29.7% of the province’s total cropland. This was followed by spring wheat (17.6%), durum wheat (11.6%), lentils (9.3%) and barley (9.0%).
| 2016 | 2021 | Change | |
|---|---|---|---|
| acres | |||
| Dairy and milk production | 110,700 | 120,132 | 9,432 |
| Beef farming and feedlots | 2,651,629 | 1,943,982 | -707,647 |
| Hog and pig farming | 9,552 | 385 | -9,167 |
| Poultry and egg production | 36,357 | 21,690 | -14,668 |
| Sheep and goat farming | 12,863 | 7,259 | -5,604 |
| Other animal production | 341,628 | 195,082 | -146,546 |
| Oilseed and grain farming | 35,931,549 | 36,370,167 | 438,618 |
| Vegetable and melon farming | 11,058 | 17,312 | 6,254 |
| Fruit and tree nut farming | 2,076 | 1,503 | -573 |
| Greenhouse, nursery and floriculture production | 9,280 | 4,667 | -4,613 |
| Other crop farming | 1,373,263 | 1,633,779 | 260,516 |
| Total cropland area | 40,489,955 | 40,315,957 | -173,998 |
| Sources: Statistics Canada, Census of Agriculture, 2016 and 2021 (3438). | |||
Saskatchewan has the most canola in Canada
The biggest crop in Saskatchewan was canola. In 2021, farms in Saskatchewan reported the largest canola area in Canada with 12.0 million acres, up 8.2% from 2016. The province accounted for over half (53.8%) of Canada’s canola area.
In addition to price increases, another factor impacting canola farming in Saskatchewan has been the increase in exports of canola oil.Note From 2017 to 2021, exports of canola oil from Canada increased by 1.6%.
The province also accounted for 78.5% of Canada’s flaxseed area. In 2021, farms in the province reported 784,381 acres in flaxseed area, down 5.1% since 2016. At the national level, flaxseed area increased by 0.6% from the previous census.
The province accounts for the vast majority of Canada’s cereal grain area
Cereal grain includes wheat, barley and oats, among other crops. In 2021, farms in Saskatchewan reported the largest spring wheat area in the country, with 7.1 million acres, up 6.0% from 2016. Meanwhile, at the national level, spring wheat area increased by 2.1%. In 2021, Saskatchewan accounted for 44.3% of Canada’s total spring wheat area.
The province also made up a significant share of the country’s durum wheat area. In 2021, the province accounted for 81.4% of Canada’s total durum wheat area, with 4.7 million acres, down 5.6% since 2016.
Saskatchewan reported the second largest barley area in Canada, with 3.6 million acres of barley, up 45.8% since 2016. At the national level, barley area increased by 24.3% since 2016. The province accounted for 43.7% of Canada’s total barley area.
In 2021, farms in Saskatchewan reported 1.7 million acres of oats. This was an increase of 14.2% in area, which was almost at par with the Canada-level increase of 17.5%. As was the case in 2016, the province reported the largest oats area; it accounted for 46.0% of Canada’s total oats area.
Saskatchewan accounts for the largest pulse crop area in Canada
Lentils, faba beans and chickpeas are classified as pulse crops. Pulses are annual crops that yield between 1 and 12 grains or seeds. In 2021, farms in Saskatchewan reported the largest lentil area, with 3.8 million acres, despite a 26.5% decrease in total area from 2016. The province accounted for 89.3% of Canada’s total lentil area.
In 2021, farms in Saskatchewan also reported the largest faba bean area, with 61,301 acres, which accounted for 50.5% of Canada’s total faba bean area. Farms in that province also reported the largest chickpea area, with 168,654 acres in 2021, down 3.4% from 2016. The province accounted for 76.0% of Canada’s total chickpea area.
Number of farms declining at a slower rate than the rest of Canada
In 2021, the total number of farms reported in Saskatchewan decreased by 1.1% from 2016. By comparison, the number of farms reported across Canada decreased by 1.9% over the same period. There were 34,128 farms reported in Saskatchewan in 2021, accounting for 18.0% of Canada’s total.
Oilseed and grain farms account for majority of farm operating revenues
In 2020, farms classified as oilseed and grain accounted for more than three-quarters ($13.6 billion) of the province’s total farm operating revenues. This was followed by farms classified as beef and feedlots ($1.8 billion) and other crops ($454.3 million).
In 2020, farms in Saskatchewan reported $16.8 billion in total farm operating revenues, accounting for 19.3% of Canada’s total farm operating revenues.

Data table for Chart 1
| Revenues | Expenses | |
|---|---|---|
| percent | ||
| Oilseed and grain farming | 80.8 | 77.5 |
| Beef farming and feedlots | 11.0 | 13.1 |
| Other crop farming | 2.7 | 3.0 |
| Source: Statistics Canada, Census of Agriculture, 2021 (3438). | ||
Saskatchewan among Canada’s leaders in several livestock categories
In 2021, farms in Saskatchewan reported the second largest number (2.7 million) of cattle and calves in Canada. Moreover, the number of cattle and calves reported in the province increased by 2.2% from the previous census. This was greater than the increase seen at the national level (+0.9%). The province accounted for over one-fifth (21.0%) of cattle and calves in Canada.
The province also reported the second largest number (1.1 million) of beef cows. The province accounted for close to one-third (29.3%) of Canada’s beef cows in 2021.
Meanwhile, farms in Saskatchewan also reported the second largest number of bison (52,860) and elk (5,507). The province made up 35.3% of Canada’s total bison and 27.3% of its total elk.
Almost half of all Saskatchewan farms use auto-steer equipment
Of all provinces and territories, Saskatchewan had the highest rate of use of automated guidance steering systems (auto-steer). Auto-steer equipment is Global Positioning System-based tractor systems for vehicle navigation and control. In 2020, 47.6% of farms in Saskatchewan reported using auto-steer equipment. This rate was higher than in 2015 (41.5%) and was higher than the rate reported across Canada (26.8%).
One possible reason for Saskatchewan’s higher-than-average rate of auto-steer equipment use is because of the prevalence of farms classified as oilseed and grain in the province. Farms classified as oilseed and grain made up the biggest proportion (88.1%) of farms in Saskatchewan that reported auto-steer equipment in 2020.
Saskatchewan has the highest rate of use for many technologies
Farms in Saskatchewan were the most likely to use Geographic Information System (GIS) mapping, tied only with Ontario. GIS assigns data to a specific location, enabling farmers to generate maps and interpret trends in soil fertility, yields and numerous other parameters. GIS mapping has many uses in farm management, including precision farming, yield maps, crop monitoring, insurance and water resource management. In 2020, 17.7% of farms in Saskatchewan reported using GIS, up from 9.0% in 2015, and higher than the Canadian average of 13.2%.
Saskatchewan also reported the highest rate of use for drones and variable-rate input application among provinces. Drones are unmanned aerial vehicles used for field scouting and data collection. In 2020, 5.2% of farms in the province reported using drones. This was higher than the national average (3.6%). Variable-rate input application includes any equipment that applies fertilizer, chemicals or other inputs at a variable rate based on data from sensors or from GIS mapping. In 2020, 21.9% of farms in Saskatchewan reported the use of variable-rate input application, more than the Canadian average of 16.1%.

Data table for Chart 2
| Auto-steer | Variable-rate input application | Geographic Information System mapping | Drones | |
|---|---|---|---|---|
| percent | ||||
| Saskatchewan | 47.6 | 21.9 | 17.7 | 5.2 |
| Canada | 26.8 | 16.1 | 13.2 | 3.6 |
| Source: Statistics Canada, Census of Agriculture, 2021 (3438). | ||||
Saskatchewan has the highest rate of succession planning in Canada
In 2021, 14.1% of farms in the province reported a succession plan, up from 8.8% in 2016, and more than any other province. By comparison, 12.0% of farms in Canada reported a succession plan in 2021. Farms in Saskatchewan accounted for over one-fifth (21.1%) of Canada’s share of farms that reported a succession plan in 2021, up from 18.8% in 2016.
Farms classified as oilseed and grain reported having a succession plan at the highest rate (16.6%) in the province in 2021. Given this rate and the high proportion of oilseed and grain farms in the province (59.9%), oilseed and grain farms made up 70.3% of all farms in Saskatchewan that reported a succession plan in 2021.
As was the case across Canada, farms in the larger revenue classes were more likely to report a succession plan in Saskatchewan. The revenue class with the highest rate of farms with a succession plan was the $2 million and over revenue class, in which 31.2% of farms had a succession plan.
The average age of farm operators increases
In 2021, the average age reported for farm operators in Saskatchewan was 55.8 years old, up from 55.0 in 2016, but just below the Canadian average of 56.0 years old. Meanwhile, the proportion of farm operators aged 35 to 54 years old in the province decreased. In 2021, 29.6% of farm operators were 35 to 54 years old, down from 34.4% in 2016.
Female farm operator numbers are on the rise
Despite the total number of farm operators in Saskatchewan having decreased by 2.7% from the previous census to 44,140 operators in 2021, the number of female farm operators increased (+735). In 2021, females accounted for 27.2% of farm operators in the province, up from 24.9% in 2016. By comparison, females made up 30.4% of total farm operators in Canada in 2021.
In Saskatchewan, farms with smaller revenues had higher rates of female farm operators than those with larger revenues. The revenue class with the largest proportion of female farm operators was that with less than $10,000 in revenues, in which 36.8% of reported farm operators were female in 2021.
Saskatchewan has the second-lowest proportion of farm operators working off the farm
In 2020, 43.6% of farm operators in Saskatchewan reported working off the farm, up slightly from 42.0% in 2015. This rate remained below the national average (47.7%) and was the lowest of all the provinces, except for Prince Edward Island (43.4%).
In 2020, there was an increase in the proportion of farm operators in Saskatchewan working less than 20 hours per week off the farm, from 20.8% to 23.2% in 2020. Conversely, there was a decrease in the proportion of farm operators working 40 hours or more per week off the farm, from 34.0% to 31.2% in 2020.
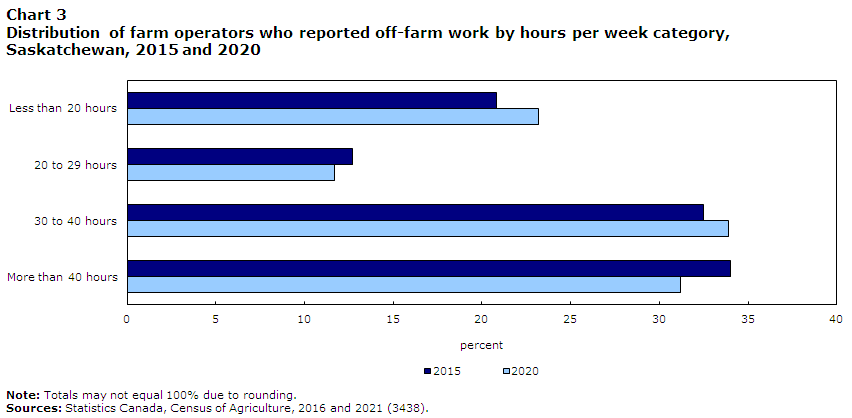
Data table for Chart 3
| More than 40 hours | 30 to 40 hours | 20 to 29 hours | Less than 20 hours | |
|---|---|---|---|---|
| percent | ||||
| 2015 | 34.0 | 32.5 | 12.7 | 20.8 |
| 2020 | 31.2 | 33.9 | 11.7 | 23.2 |
|
Note: Totals may not equal 100% due to rounding. Sources: Statistics Canada, Census of Agriculture, 2016 and 2021 (3438). |
||||
Definitions and concepts
A significant conceptual change to the main statistical unit used by Statistics Canada’s Agriculture Statistics Program has been introduced for the 2021 Census of Agriculture: a “farm” or an “agricultural holding” (i.e., the census farm) now refers to a unit that produces agricultural products and reports revenues or expenses for tax purposes to the Canada Revenue Agency. Before 2021, a “farm” was defined as an agricultural operation that produced at least one agricultural product intended for sale
In 2021, there have been changes to the definition of a census farm; in Yukon and Northwest Territories, some activities that were previously included within the definition are not included in 2021. Caution should be taken when comparing the 2021 Census of Agriculture data with data from previous censuses.
The data displayed by geography have undergone random tabular adjustment. The Canada total data for geographic breakdowns may differ from the Canada total data displayed in tables by North American Industry Classification System (NAICS) category and sales class.
The data for Yukon and the Northwest Territories are not included in the national totals; they are presented separately.
The Census of Agriculture is conducted every five years and is a census of all agricultural operations that produces agricultural products and reports revenues or expenses for tax purposes to the Canada Revenue Agency. Important concepts used in this analysis include:
Total farm area, which is land owned or operated by an agricultural operation, includes: cropland, summer fallow, improved and unimproved pasture, woodlands and wetlands, all other land (including idle land and land on which farm buildings are located).
Total farm area includes the total area of land owned, leased, rented, crop-shared or used by this operation minus land area used by others.
Cropland is the total area of field crops, hay, field vegetables, fruits, berries, nuts, sod, nursery products and Christmas trees.
Farm type is established through a procedure that classifies each census farm according to the predominant type of production. This is done by estimating the potential revenues from the inventories of crops and livestock reported on the questionnaire and determining the product or group of products that make up the majority of the estimated receipts. For example, a census farm with total potential revenues of 60% from hogs, 20% from beef cattle and 20% from wheat, would be classified as a hog and pig farm. The farm types presented in this document are derived based on the 2017 NAICS.
Farm operator refers to any person responsible for the management decisions in operating a farm or agricultural operation. Also known as an agricultural operator, farmer, operator or rancher.
Farm employees include both farm operators and agricultural workers.
Price indexes were used to obtain constant dollar estimates of sales, export values and farm assets in order to eliminate the impact of price change in year-to-year comparisons.
Farm operating revenues
Farm operating revenues come from the Agriculture Taxation Data Program (ATDP). Previously, revenues for agricultural operations were reported to the Census of Agriculture. Caution should be taken when comparing the 2021 Census of Agriculture data with previous censuses.
The Census of Agriculture measures farm operating revenues (in current dollars) for the calendar or accounting year prior to the census. Farm operating revenues (before deducting expenses) in this analysis include: operating revenues from all agricultural products sold, program payments and custom work revenues.
The following are not included in farm operating revenues: sales of forestry products (for example: firewood, pulpwood, logs, fence posts and pilings); sales of capital items (for example: quota, land, machinery); and revenues from the sale of any goods purchased only for retail sales.
Total operating expenses
Total operating expenses come from the ATDP. Previously, expenses for agricultural operations were reported to the Census of Agriculture. Caution should be taken when comparing the 2021 Census of Agriculture data with previous censuses.
The Census of Agriculture measures operating expenses (in current dollars) for the calendar or accounting year prior to the census. Total operating expenses include any expense associated with producing agricultural products (such as the cost of seed, feed, fuel, fertilizers).
The following are not included in total operating expenses: the purchase of land, buildings or equipment, and depreciation or capital cost allowance. Depreciation represents economic "wear and tear" expense. Capital cost allowance represents the amount of depreciation written off by the tax filer as allowed by tax regulations.
Expenses-to-revenues ratio
The expenses-to-revenues ratio is the average amount of operating expenses incurred for a dollar in farm operating revenues. The ratio is calculated in current dollars.
Census Day was May 11, 2021. Farmers were asked to report their operating revenues and expenses for the last complete fiscal or calendar year (2020).
Full-time employment is classified as farm operators who worked 30 hours or more per week; part-time employment is classified as farm operators who worked less than 30 hours per week.
Some data refer to a reference period other than Census Day. For example, for financial data the reference period is the calendar or accounting (fiscal) year prior to the census.
- Date modified: