
Canadian Agriculture at a Glance
Manitoba has the highest proportion of young farm operators in Canada
by Michelle St. Pierre and Mike McComb
Skip to text
Text begins
Manitoba has a rich history of farming. In addition to being the birthplace of canola (this plant was bred at the University of Manitoba), this prairie province has a robust agricultural sector characterized by the third largest farm area in Canada. Data from the 2021 Census of Agriculture also shows that Manitoba’s agricultural industry is getting a boost from both younger farm operators and female farm operators.
Manitoba had the highest proportion of operators under the age of 35 of any province. The reported proportion was 11.5%, which was higher than the Canadian proportion of 8.6%. Manitoba also had the highest proportion of young operators in 2016, at 10.8%.
Female farm operators are increasing in number and proportion
From 2016 to 2021, the proportion of female operators reported in Manitoba increased from 23.8% to 26.5%, while the number of female operators increased from 4,785 to 5,150. Meanwhile, the total number of farm operators reported in the province decreased. In 2016, there were 20,140 farm operators, and in 2021, there were 19,465. Its national share of female farm operators increased from 6.1% to 6.5% between 2016 and 2021.
Proportion of farm operators working off the farm increasing
From 2015 to 2020, the proportion of farm operators reporting working off the farm in Manitoba increased from 42.9% to 46.0%. However, this rate was still below the Canadian average (47.7%). In Manitoba, of those that work off the farm, there was an increase in the proportion of farm operators working less than 20 hours, from 21.2% to 24.1%, and a slight decrease in the proportion of farm operators working 40 hours or more off the farm, from 31.6% to 29.1%.
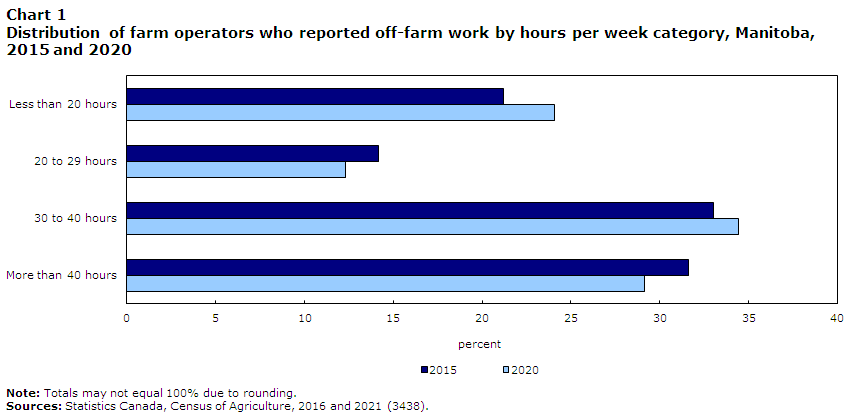
Data table for Chart 1
| More than 40 hours | 30 to 40 hours | 20 to 29 hours | Less than 20 hours | |
|---|---|---|---|---|
| percent | ||||
| 2015 | 31.6 | 33.0 | 14.2 | 21.2 |
| 2020 | 29.1 | 34.4 | 12.3 | 24.1 |
|
Note: Totals may not equal 100% due to rounding. Sources: Statistics Canada, Census of Agriculture, 2016 and 2021 (3438). |
||||
Manitoba has the fourth most oilseed and beef farms
Among provinces and territories, Manitoba reported the fourth highest number of farms classified as oilseed and grain. While the province reported more oilseed farms in 2021 than in 2016, its national share decreased slightly over the same period. In the previous census, Manitoba accounted for 10.5% of Canada’s oilseed farms, and by 2021, the proportion decreased to 10.4%. Overall, Manitoba reported a total of 14,543 farms in 2021, which was down 1.7% from 2016.
Manitoba also reported the fourth highest number of farms classified as beef and feedlots. In 2021, the province accounted for 9.0% of Canada’s beef farms. This was down from the 10.7% reported in 2016.
| number | percent | |
|---|---|---|
| Dairy and milk production | 238 | 1.6 |
| Beef farming and feedlots | 3,574 | 24.6 |
| Hog and pig farming | 245 | 1.7 |
| Poultry and egg production | 263 | 1.8 |
| Sheep and goat farming | 174 | 1.2 |
| Other animal production | 1,015 | 7.0 |
| Oilseed and grain farming | 6,749 | 46.4 |
| Vegetable and melon farming | 184 | 1.3 |
| Fruit and tree nut farming | 66 | 0.5 |
| Greenhouse, nursery and floriculture production | 137 | 0.9 |
| Other crop farming | 1,898 | 13.1 |
| Total | 14,543 | 100.0 |
| Source: Statistics Canada, Census of Agriculture, 2021 (3438). | ||
Manitoba has the third largest farm area in the country
In 2021, farms in Manitoba reported the third highest farm area, making up 11.1% of Canada’s total farm area. In 2016, Manitoba also accounted for 11.1% of Canada’s total farm area. Manitoba reported 1,177 acres per farm in 2021, a 1.3% decrease from 1,192 acres per farm in 2016, but still higher than the Canadian average of 809 acres per farm.
Manitoba reported a total farm area of 17.1 million acres in 2021, which was a 2.9% decrease from 2016. Cropland, which accounted for 67.9% of the province’s total farm area, increased slightly (+0.8%) from 2016. Meanwhile, Manitoba’s natural pasture area, which accounted for 19.1% of total farm area (3.3 million acres) in 2021, decreased 3.3% from the previous census.
Manitoba has the most acres of sunflower seeds and is among the national leaders in other field crops
In 2021, farms in Manitoba reported the largest amount of sunflower seed acreage, accounting for 90.7% of Canada’s total. Out of all the provinces and territories, Manitoba reported the second largest acreage of white beans, soybeans and potatoes. The province also reported the third largest acreage of oats, canola and spring wheat in Canada.
| Manitoba | Canada | Portion of Canada total in Manitoba | |
|---|---|---|---|
| acres | percent | ||
| Sunflower seed | 82,949 | 91,427 | 90.7 |
| Dry white beans | 46,698 | 116,305 | 40.2 |
| Soybeans | 1,287,330 | 5,157,986 | 25.0 |
| Oats | 743,384 | 3,711,811 | 20.0 |
| Potatoes | 77,927 | 388,485 | 20.1 |
| Spring wheat | 2,841,819 | 16,021,936 | 17.7 |
| Canola | 3,424,226 | 22,270,249 | 15.4 |
| Source: Statistics Canada, Census of Agriculture, 2021 (3438). | |||
Manitoba has more pigs per farm than any other province
In 2021, Manitoba farms reported an average of 6,104 pigs per farm reporting pigs. This was up from 5,087 pigs per pig-reporting farm in 2016. This was also higher than the national average of 1,963 pigs per pig-reporting farm and more than any other province and territory.
Farms in Manitoba made up 23.7% of Canada’s total reported pigs in 2021. In 2016, Manitoba accounted for 24.0% of Canada’s total pigs. Within Manitoba, farms with $2 million and over in revenues reported 84.5% of the province’s pigs. Canada-wide, farms in that revenue category accounted for 61.7% of the country’s total pigs in 2021. This suggests that the pig industry in Manitoba is more concentrated among farms in a higher revenue class than throughout Canada.
Average farm revenues in Manitoba are higher than the national average
In 2020, farms in Manitoba reported $8.2 billion in total operating revenues. This made up 9.4% of Canada’s total farm operating revenues. With 14,543 farms in the province, Manitoba reported an average of $562,929 per farm in operating revenues. This was higher than the 2020 national average of $458,320 per farm. Of all provinces and territories, Manitoba had the fifth highest total operating revenues in Canada, and the second highest average.
Grains, pigs and oilseeds lead farm revenues in Manitoba
Farms classified as oilseed and grain farms reported $4.3 billion in total operating revenues, making up 52.4% of the province’s total. Manitoba made up 12.8% of all oilseed and grain farm revenues in the country. More specifically, “other grain” farms were the largest earner in the province, with $2.8 billion in farm revenues. Farms classified as “other grain” include buckwheat, wild rice and anything else not reported under the other categories of oilseed and grain. The next highest earners were farms classified as hog and pig farms ($1.3 billion), followed by farms classified as oilseed farms ($1.2 billion).
| Manitoba | Canada | |||
|---|---|---|---|---|
| 2015 | 2020 | 2015 | 2020 | |
| percent | ||||
| Dairy and milk production | 4.1 | 4.2 | 10.1 | 9.8 |
| Beef farming and feedlots | 12.1 | 10.7 | 18.4 | 16.5 |
| Hog and pig farming | 16.8 | 15.8 | 7.1 | 6.6 |
| Poultry and egg production | 3.4 | 3.6 | 7.3 | 7.1 |
| Sheep and goat farming | 0.1 | 0.2 | 0.3 | 0.4 |
| Other animal production | 4.4 | 3.7 | 3.8 | 3.2 |
| Oilseed and grain farming | 51.7 | 52.4 | 37.8 | 38.6 |
| Vegetable and melon farming | 4.3 | 5.0 | 3.8 | 4.4 |
| Fruit and tree nut farming | 0.0 | 0.0 | 1.8 | 2.2 |
| Greenhouse, nursery and floriculture production | 1.2 | 1.2 | 5.9 | 6.8 |
| Other crop farming | 1.8 | 3.2 | 3.7 | 4.5 |
| Sources: Statistics Canada, Census of Agriculture, 2016 and 2021 (3438). | ||||
Farms in the largest revenue class make up more than half of the province’s total revenues
Despite accounting for only 5.2% of total farms reported in Manitoba, farms with revenues of $2 million and over made up over half (51.9%) of the province’s operating revenues in 2020. By comparison, farms with revenues of $100,000 to $249,999 made up the biggest share (16.2%) of farms reported in the province. However, farms in this revenue class accounted for only 4.7% of the province’s operating revenues.
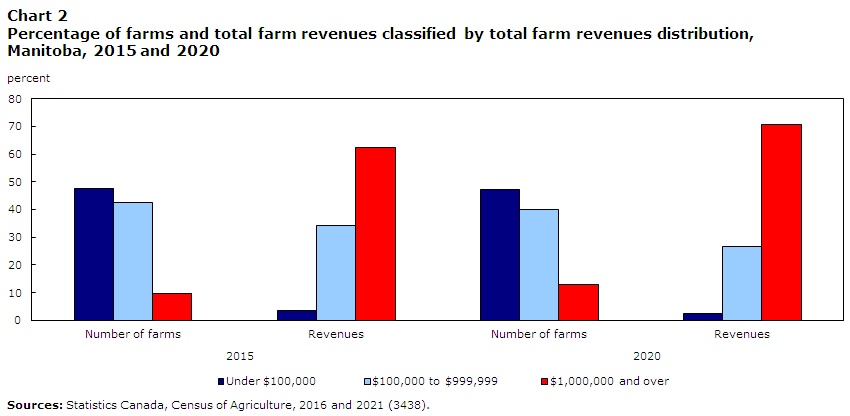
Data table for Chart 2
| Total farm revenues distribution | 2015 | 2020 | ||
|---|---|---|---|---|
| Number of farms | Revenues | Number of farms | Revenues | |
| percent | ||||
| Under $100,000 | 47.6 | 3.4 | 47.3 | 2.5 |
| $100,000 to $999,999 | 42.6 | 34.1 | 39.9 | 26.7 |
| $1,000,000 and over | 9.8 | 62.4 | 12.9 | 70.7 |
| Sources: Statistics Canada, Census of Agriculture, 2016 and 2021 (3438). | ||||
Manitoba’s succession plan rate is slightly below the national average
Among provinces and territories, Manitoba reported the fourth-highest rate of succession planning. In 2021, just over 1/10 (11.8%) of farms in Manitoba reported a succession plan, which was just below the Canadian average (12.0%). This was an increase from 2016, when 8.1% of Manitoba farms reported a succession plan.
Farms classified as dairy and milk production (24.8%) and hog and pig (22.4%) were the most likely to report a succession plan in Manitoba. However, with so many oilseed and grain farms in the province, over half (58.5%) of succession plans came from oilseed and grain farms. In 2021, nearly half (46.4%) of Manitoba’s reported farms were oilseed and grain.
More direct sales in Manitoba, but still below national average
Both the proportion and number of farms reporting direct sales in Manitoba increased from the previous census. In 2020, 7.0% of farms in Manitoba reported direct sales, up from 6.1% in 2015. By comparison, 13.6% of farms in Canada reported direct sales in 2020. This is understandable given Manitoba’s large number of oilseed and grain farms. Within the province, 1.7% of oilseed and grain farms reported direct sales in 2020, a lower rate than any other farm type. Additionally, the number of farms reporting direct sales increased from 900 in 2015 to 1,013 farms in 2020.
Manitoba among top users of windbreaks and rotational grazing
Shelterbelts and windbreaks are rows of natural or planted trees or hedges along field edges that stop prevailing winds from eroding the soil. In 2020, farms in Manitoba reported the highest rate of shelterbelts and windbreaks (70.7%) in Canada. This was an increase from the previous census (46.6%), and higher than the Canadian average (52.3%).
Rotational grazing is the practice of grazing livestock on pastures that are managed to allow for a specific recovery period following grazing. In 2020, nearly a quarter (23.3%) of farms in Manitoba reported rotational grazing, which was higher than the national rate (20.7%). As was the case with many provinces, Manitoba’s reported rate of rotational grazing decreased slightly from 2015.
The rate of renewable energy production is higher than the national level
In 2021, 14.4% of farms in Manitoba reported renewable energy production, up from 3.5% in the previous census, and higher than the national rate (11.9%). Beef farms were the most likely farm type to report renewable energy production in the province. In 2021, 17.4% of farms classified as beef and feedlots reported renewable energy production.
Manitoba had the highest rate of geothermal energy production in the country. In 2021, 4.1% of farms in the province reported geothermal energy production, compared with 1.9% of farms across Canada.
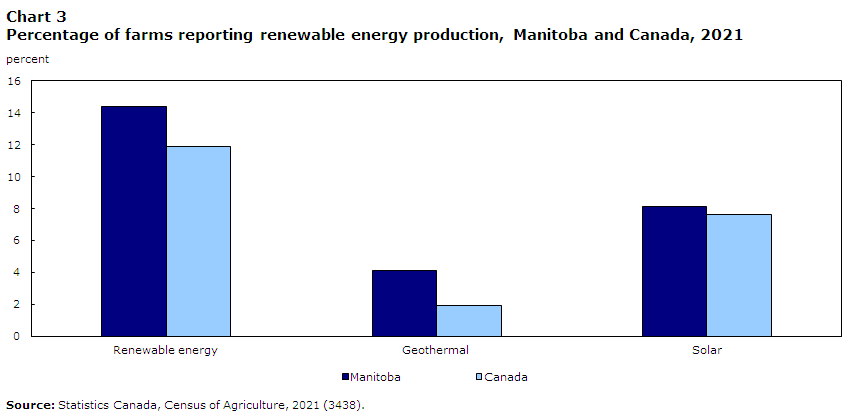
Data table for Chart 3
| Renewable energy | Geothermal | Solar | |
|---|---|---|---|
| percent | |||
| Manitoba | 14.4 | 4.1 | 8.1 |
| Canada | 11.9 | 1.9 | 7.6 |
| Source: Statistics Canada, Census of Agriculture, 2021 (3438). | |||
Manitoba has the second highest rate of use for automated guidance steering systems
In 2020, nearly half (41.4%) of farms in the province reported using automated guidance steering systems (auto-steer). This was higher than all but one province and higher than the national rate (26.8%). One possible reason for Manitoba’s high rate of auto-steer technology is because of its high proportion of farms classified as oilseed and grain. In 2020, this farm type was the most likely (71.9%) to report auto-steer equipment. Oilseed and grain farms accounted for nearly half (46.4%) of total farms reported in Manitoba.
In 2020, Manitoba reported the third-highest rate (16.1%) of use for Geospatial Information System (GIS) mapping, up from 10.0% in 2015 and higher than the national average (13.2%). As was the case with auto-steer technology, one possible reason for Manitoba’s high rate of GIS mapping is because of its high proportion of oilseed and grain farms. This farm type was more likely (27.9%) to report using this technology in Manitoba.
| Manitoba | Canada | |
|---|---|---|
| percent | ||
| Automated guidance steering systems on farm equipment | 41.4 | 26.8 |
| Geospatial Information System mapping | 16.1 | 13.2 |
| Variable-rate input application | 16.4 | 16.1 |
| Drones | 4.9 | 3.6 |
| Soil sample test | 36.1 | 32.0 |
| Slow-release fertilizer | 24.6 | 23.4 |
| Source: Statistics Canada, Census of Agriculture, 2021 (3438). | ||
Definitions and concepts
A significant conceptual change to the main statistical unit used by Statistics Canada’s Agriculture Statistics Program has been introduced for the 2021 Census of Agriculture: a “farm” or an “agricultural holding” (i.e., the census farm) now refers to a unit that produces agricultural products and reports revenues or expenses for tax purposes to the Canada Revenue Agency. Before 2021, a “farm” was defined as an agricultural operation that produced at least one agricultural product intended for sale
In 2021, there have been changes to the definition of a census farm; in Yukon and Northwest Territories, some activities that were previously included within the definition are not included in 2021. Caution should be taken when comparing the 2021 Census of Agriculture data with data from previous censuses.
The data displayed by geography have undergone random tabular adjustment. The Canada total data for geographic breakdowns may differ from the Canada total data displayed in tables by North American Industry Classification System (NAICS) category and sales class.
The data for Yukon and the Northwest Territories are not included in the national totals; they are presented separately.
The Census of Agriculture is conducted every five years and is a census of all agricultural operations that produces agricultural products and reports revenues or expenses for tax purposes to the Canada Revenue Agency. Important concepts used in this analysis include:
Total farm area, which is land owned or operated by an agricultural operation, includes: cropland, summer fallow, improved and unimproved pasture, woodlands and wetlands, all other land (including idle land and land on which farm buildings are located).
Total farm area includes the total area of land owned, leased, rented, crop-shared or used by this operation minus land area used by others.
Cropland is the total area of field crops, hay, field vegetables, fruits, berries, nuts, sod, nursery products and Christmas trees.
Farm type is established through a procedure that classifies each census farm according to the predominant type of production. This is done by estimating the potential revenues from the inventories of crops and livestock reported on the questionnaire and determining the product or group of products that make up the majority of the estimated receipts. For example, a census farm with total potential revenues of 60% from hogs, 20% from beef cattle and 20% from wheat, would be classified as a hog and pig farm. The farm types presented in this document are derived based on the 2017 NAICS.
Farm operator refers to any person responsible for the management decisions in operating a farm or agricultural operation. Also known as an agricultural operator, farmer, operator or rancher.
Farm employees include both farm operators and agricultural workers.
Price indexes were used to obtain constant dollar estimates of sales, export values and farm assets in order to eliminate the impact of price change in year-to-year comparisons.
Farm operating revenues
Farm operating revenues come from the Agriculture Taxation Data Program (ATDP). Previously, revenues for agricultural operations were reported to the Census of Agriculture. Caution should be taken when comparing the 2021 Census of Agriculture data with previous censuses.
The Census of Agriculture measures farm operating revenues (in current dollars) for the calendar or accounting year prior to the census. Farm operating revenues (before deducting expenses) in this analysis include: operating revenues from all agricultural products sold, program payments and custom work revenues.
The following are not included in farm operating revenues: sales of forestry products (for example: firewood, pulpwood, logs, fence posts and pilings); sales of capital items (for example: quota, land, machinery); and revenues from the sale of any goods purchased only for retail sales.
Total operating expenses
Total operating expenses come from the ATDP. Previously, expenses for agricultural operations were reported to the Census of Agriculture. Caution should be taken when comparing the 2021 Census of Agriculture data with previous censuses.
The Census of Agriculture measures operating expenses (in current dollars) for the calendar or accounting year prior to the census. Total operating expenses include any expense associated with producing agricultural products (such as the cost of seed, feed, fuel, fertilizers).
The following are not included in total operating expenses: the purchase of land, buildings or equipment, and depreciation or capital cost allowance. Depreciation represents economic "wear and tear" expense. Capital cost allowance represents the amount of depreciation written off by the tax filer as allowed by tax regulations.
Expenses-to-revenues ratio
The expenses-to-revenues ratio is the average amount of operating expenses incurred for a dollar in farm operating revenues. The ratio is calculated in current dollars.
Census Day was May 11, 2021. Farmers were asked to report their operating revenues and expenses for the last complete fiscal or calendar year (2020).
Full-time employment is classified as farm operators who worked 30 hours or more per week; part-time employment is classified as farm operators who worked less than 30 hours per week.
Some data refer to a reference period other than Census Day. For example, for financial data the reference period is the calendar or accounting (fiscal) year prior to the census.
- Date modified: