
Canadian Agriculture at a Glance
Ontario is an agricultural powerhouse that leads in many farming categories
Skip to text
Text begins
Ontario is a pivotal contributor to Canadian agriculture, as it is to many economic sectors across Canada. The province’s large size (largest population and second largest province by land area) and its abundance of natural resources help position it among the nation’s leaders in farming.
The province once again made up the largest national share of farms and farm operators. In addition, it was the second largest contributor to the country’s farm operating revenues. Moreover, Ontario was the leader among all provinces in farming commodities such as soybeans, corn for grain, and greenhouse products.
Results from the 2021 Census of Agriculture show that Ontario accounted for over one-quarter (25.5%) of total farms in Canada, while making up 7.7% of total farm area. In 2021, there were 48,346 farms reported in Ontario, down from 49,600 in 2016. The rate of decline (-2.5%) was slightly higher than the national rate (-1.9%). Over the same period, the total farm area in Ontario decreased by 4.7% from the previous census, down to 11.8 million acres in 2021.
In 2021, compared with other provinces, Ontario had the largest proportion of Canada’s farms classified as poultry and egg production (38.9%); sheep and goat (36.6%); other animal production (28.7%); vegetable and melon (30.8%); and greenhouse, nursery and floriculture (31.8%).
| Ontario | Canada | percent | |
|---|---|---|---|
| Dairy and milk production | 3,188 | 9,403 | 33.9 |
| Beef farming and feedlots | 7,986 | 39,633 | 20.2 |
| Hog and pig farming | 1,189 | 3,016 | 39.4 |
| Poultry and egg production | 2,061 | 5,296 | 38.9 |
| Sheep and goat farming | 1,309 | 3,575 | 36.6 |
| Other animal production | 4,556 | 15,873 | 28.7 |
| Oilseed and grain farming | 18,194 | 65,135 | 27.9 |
| Vegetable and melon farming | 1,562 | 5,076 | 30.8 |
| Fruit and tree nut farming | 1,211 | 7,101 | 17.1 |
| Greenhouse, nursery and floriculture production | 1,672 | 5,256 | 31.8 |
| Other crop farming | 5,418 | 30,510 | 17.8 |
| Total | 48,346 | 189,874 | 25.5 |
| Source: Statistics Canada, Census of Agriculture, 2021 (3438). | |||
Ontario is home to soybeans and corn for grain
Ontario was the leader among all provinces in the area of soybeans and corn for grain. In 2021, over half (54.4%) of Canada’s soybean acreage was reported in Ontario, up from 49.6% in 2016. Despite the overall decrease in soybean acreage at the national level (-8.2%), farms in Ontario reported a marginal increase of 0.8% in soybean acreage from the previous census. In 2021, there were 2.8 million acres of soybeans.
Corn for grain is another major crop grown in Ontario, which made up 59.9% of Canada’s total corn for grain area, up from 59.8% in 2016. The total area of corn for grain in the province increased by 1.9% from the previous census, totalling 2.2 million acres in 2021.
The increase in the area of soybeans and corn for grain in the province can be attributed to their strong prices. The Farm Product Price Index shows that Canada saw a 38.2% increase in the price index of grains between 2017 and 2021.
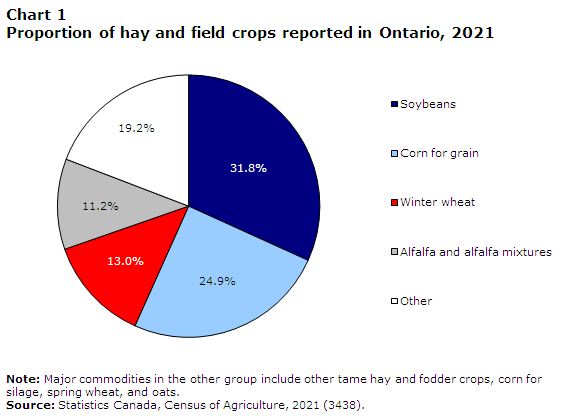
Data table for Chart 1
| percent | |
|---|---|
| Soybeans | 31.8 |
| Corn for grain | 24.9 |
| Winter wheat | 13.0 |
| Alfalfa and alfalfa mixtures | 11.2 |
| Other | 19.2 |
|
Note: Major commodities in the other group include other tame hay and fodder crops, corn for silage, spring wheat, and oats. Source: Statistics Canada, Census of Agriculture, 2021 (3438). |
|
Ontario continues to dominate the greenhouse products market
Temporary foreign workers (TFWs) have been critical to greenhouse, nursery and floriculture farming. In 2018, they accounted for 31.2% of employees working on farms in Ontario. Despite pandemic measures that inhibited border crossing for TFWs, Ontario’s greenhouse fruit and vegetable production remained resilient.
In 2021, farms in Ontario accounted for 61.8% of total greenhouse area reported in Canada. Compared with the previous census, the total greenhouse area in the province increased by 27.8%, which was 4.6 percentage points above the national rate. In 2021, farms in Ontario reported 204.2 million square feet of greenhouse area, up from 159.8 million square feet in 2016.
The total greenhouse area for fruits and vegetables, which accounted for 74.6% of Ontario’s reported greenhouse area, was highly concentrated in farms in the top revenue category. In 2021, 94.0% of total greenhouse area for fruits and vegetables was reported by farms with annual revenues of $2 million and over.
Dairy cow and hog numbers are up, while their farm numbers are declining
In 2021, farms in Ontario reported over one-third (33.4%) of Canada’s dairy cows, which made the province the second largest contributor in the country. Meanwhile, the number of dairy cows reported in the province increased by 4.9% from the previous census, up from 311,960 in 2016.
Because of the strong demand for hogs and pigs from the United States, the number of pigs in Ontario increased by 15.2%, which was more than four times the national rate (3.4%). In 2016, there were 3.5 million hogs and pigs, and by 2021, the number increased to 4.1 million. Of all types of pigs, market pigs had the highest rate of increase, at 22.8%, up from 1.8 million in 2016.
| 2016 | 2021 | percent change | |
|---|---|---|---|
| Boars kept for breeding | 5,112 | 4,412 | -13.7 |
| Sows and gilts kept for breeding | 313,698 | 326,852 | 4.2 |
| Suckling pigs, under 15 pounds | 503,771 | 498,008 | -1.1 |
| Weanling, nursery or starter pigs, 15 to 49 pounds | 882,239 | 995,701 | 12.9 |
| Market pigs, over 50 pounds | 1,829,284 | 2,246,928 | 22.8 |
| Total number of pigs | 3,534,104 | 4,071,902 | 15.2 |
| Sources: Statistics Canada, Census of Agriculture, 2016 and 2021 (3438). | |||
Despite the increase in Ontario’s dairy cow and hog numbers, the number of farms reporting dairy cows and hogs and pigs decreased 13.8% and 11.7%, respectively, from the previous census. In 2016, there were 4,400 farms reporting dairy cows, and by 2021, the number decreased to 3,793. The number of farms reporting hogs and pigs declined from 2,760 in 2016 to 2,437 in 2021. In Ontario, the decrease in the number of farms reporting dairy cows or hogs from 2016 was mainly in medium-sized farms (with revenues between $50,000 and $500,000). Meanwhile, the number of farms with revenues of at least $2 million increased, indicating farm consolidation.
Majority of Ontario farms have under $100,000 in revenues
In 2020, 59.9% of farms in Ontario had under $100,000 in revenues, down from 61.4% in 2015. By comparison, farms with less than $100,000 in revenues made up 55.8% of total farms in Canada in 2020. Consistent with the trend of fewer but larger farms from the previous census, the number of farms in Ontario with revenues of $1 million and over increased by 19.2%, up from 3,479 in 2015.
Farms expand direct marketing methods to adapt to consumer needs
During the pandemic, consumers have been more willing to buy food that can be sold online and delivered to their doorstep. With the integration of direct sales methods such as direct delivery and off-site stands, the proportion of farms in Ontario reporting direct sales increased from the previous census. In 2020, 15.9% of farms in Ontario reported direct sales, up from 15.1% in 2015. By comparison, the proportion of farms reporting direct sales in Canada was 13.6% in 2020.
In 2020, fruit and tree nut farms in Ontario surpassed vegetable and melon farms to become the most likely to report direct sales. The proportion of farms in Ontario classified as fruit and tree nut reporting direct sales increased from 46.7% in 2015 to 49.8% in 2020.
More Ontario farms are using renewable energy and sustainable land practices
One way to mitigate the risk posed by climate change is to use renewable energy and land practices to improve the sustainability of the land. The number of farms in the province reporting renewable energy production increased by 63.8% to 8,483 in 2021. These farms accounted for 17.5% of total farms in Ontario, the highest proportion in any province, and above the national rate (11.9%).
In 2020, 67.2% of farms in Ontario reported using land practices such as in-field winter grazing or feeding and rotational grazing, up from 60.1% in 2015. This was also above the national rate (64.5%). In particular, Ontario had the highest proportion (26.7%) of farms planting winter cover crops when compared with other provinces.
Ontario ranks fourth in technology use and leads in soil sample testing and geographic information system mapping
In 2020, over half (54.1%) of farms in Ontario reported technology use, making Ontario rank fourth across provinces. This was also slightly higher than the national average (50.4%). Farms have been using sophisticated agricultural technology to improve farming efficiency, help protect the environment from fertilizer over-application and stay competitive in the global market. The types of technology include but are not limited to fully robotic milking, automated guidance steering systems and geographic information system mapping.
Soil sample testing was the most used technology in Ontario. In 2020, 36.4% of farms in Ontario reported soil sample testing, and 30.5% reported the use of slow-release fertilizer. The usage of geographic information system mapping prevents fertilizer over-application, and Ontario leads in the number (8,567) of farms equipped with this technology in 2020, up from 5,436 in 2015. By comparison, the proportion at the national level was 13.2%, up from 8.2% in 2015.
Ontario is the second top contributor to the national increase in succession planning
The combination of aging farm operators and growing health concerns associated with COVID-19 may have caused more farm operators to consider succession plans. In 2021, 12.4% of farms in Ontario reported a succession plan, up from 8.5% in 2016. The total number of farms in Ontario reporting a succession plan increased by 42.3% from the previous census, up from 4,206 in 2016. By comparison, the rate of increase was 41.2% at the national level, up from 16,200 in 2016.
Ontario continues to lead Canada in the number of farm operators
As was the case in 2016, the number of farm operators reported in Ontario made up over one-quarter (25.7%) of total farm operators reported in Canada in 2021. Meanwhile, the number of farm operators in the province decreased by 4.4% from the previous census, which was slightly above the national rate (-3.5%). In 2021, there were 67,390 farm operators in Ontario, down from 70,470 in 2016. Nevertheless, farm operators of oilseed and grain farms increased by 6.6% from 2016, up to 24,115 in 2021. These farm operators accounted for over one-third (35.8%) of total farm operators reported in Ontario, up from 32.1% in 2016.
The proportion of female farm operators continues to rise
Although the total number of farm operators in Ontario decreased over time, the proportion of female farm operators increased from 29.7% in 2016 to 31.0% in 2021. This was because the number of female operators in the province remained steady over this period. There were 20,905 female farm operators in 2016, and by 2021, the number decreased marginally to 20,895. Conversely, the number of male farm operators decreased 6.2% from 2016, down to 46,490 in 2021.
Middle-aged farm operator numbers drop significantly
The number of farm operators in Ontario younger than 35 years old (younger operators) decreased by 15.0% from the previous census, down from 6,610 in 2016. By comparison, the number of farm operators aged 35 to 54 years old (middle-aged operators) decreased by 20.9%, down to 19,780 in 2021. Conversely, the number of farm operators aged 55 or older (older operators) increased by 8.1% from 2016, up to 42,000 in 2021.
The decrease in the number of younger and middle-aged operators has led to an aging farm operator population. The average age of Ontario’s farm operators increased by 1.4 years to 56.7, up from 55.3 years in 2016.

Data table for Chart 2
| Under 35 years | 35 to 54 years | 55 years and older | |
|---|---|---|---|
| percent | |||
| 2016 | 9.4 | 35.5 | 55.1 |
| 2021 | 8.3 | 29.4 | 62.3 |
|
Note: Totals may not equal 100% due to rounding. Sources: Statistics Canada, Census of Agriculture, 2016 and 2021 (3438). |
|||
Ontario has the second largest proportion of operators working off the farm
Nearly half (49.2%) of Ontario’s farm operators reported working off the farm in 2020. The number of farm operators in the province reporting off-farm work increased 1.5% from the previous census, totalling 33,150 farm operators in 2020. By comparison, the rate of increase for off-farm work at the national level was 3.8%.
The increase in operators reporting off-farm work in Ontario was driven by those who worked part time. In 2015, there were 9,555 farm operators working part time off the farm, and by 2020, the number increased to 10,295. By comparison, the number of farm operators who reported off-farm work on a full-time basis decreased slightly from 23,105 in 2015 to 22,855 in 2020. Consequently, the proportion of operators reporting part-time off-farm work increased by 1.8 percentage points from 2015, up to 31.1% in 2020.

Data table for Chart 3
| More than 40 hours | 30 to 40 hours | 20 to 29 hours | Less than 20 hours | |
|---|---|---|---|---|
| percent | ||||
| 2015 | 39.9 | 30.9 | 12.3 | 17.0 |
| 2020 | 37.1 | 31.9 | 10.7 | 20.4 |
|
Note: Totals may not equal 100% due to rounding. Sources: Statistics Canada, Census of Agriculture, 2016 and 2021 (3438). |
||||
Definitions and concepts
A significant conceptual change to the main statistical unit used by Statistics Canada’s Agriculture Statistics Program has been introduced for the 2021 Census of Agriculture: a “farm” or an “agricultural holding” (i.e., the census farm) now refers to a unit that produces agricultural products and reports revenues or expenses for tax purposes to the Canada Revenue Agency. Before 2021, a “farm” was defined as an agricultural operation that produced at least one agricultural product intended for sale
In 2021, there have been changes to the definition of a census farm; in Yukon and Northwest Territories, some activities that were previously included within the definition are not included in 2021. Caution should be taken when comparing the 2021 Census of Agriculture data with data from previous censuses.
The data displayed by geography have undergone random tabular adjustment. The Canada total data for geographic breakdowns may differ from the Canada total data displayed in tables by North American Industry Classification System (NAICS) category and sales class.
The data for Yukon and the Northwest Territories are not included in the national totals; they are presented separately.
The Census of Agriculture is conducted every five years and is a census of all agricultural operations that produces agricultural products and reports revenues or expenses for tax purposes to the Canada Revenue Agency. Important concepts used in this analysis include:
Total farm area, which is land owned or operated by an agricultural operation, includes: cropland, summer fallow, improved and unimproved pasture, woodlands and wetlands, all other land (including idle land and land on which farm buildings are located).
Total farm area includes the total area of land owned, leased, rented, crop-shared or used by this operation minus land area used by others.
Cropland is the total area of field crops, hay, field vegetables, fruits, berries, nuts, sod, nursery products and Christmas trees.
Farm type is established through a procedure that classifies each census farm according to the predominant type of production. This is done by estimating the potential revenues from the inventories of crops and livestock reported on the questionnaire and determining the product or group of products that make up the majority of the estimated receipts. For example, a census farm with total potential revenues of 60% from hogs, 20% from beef cattle and 20% from wheat, would be classified as a hog and pig farm. The farm types presented in this document are derived based on the 2017 NAICS.
Farm operator refers to any person responsible for the management decisions in operating a farm or agricultural operation. Also known as an agricultural operator, farmer, operator or rancher.
Farm employees include both farm operators and agricultural workers.
Price indexes were used to obtain constant dollar estimates of sales, export values and farm assets in order to eliminate the impact of price change in year-to-year comparisons.
Farm operating revenues
Farm operating revenues come from the Agriculture Taxation Data Program (ATDP). Previously, revenues for agricultural operations were reported to the Census of Agriculture. Caution should be taken when comparing the 2021 Census of Agriculture data with previous censuses.
The Census of Agriculture measures farm operating revenues (in current dollars) for the calendar or accounting year prior to the census. Farm operating revenues (before deducting expenses) in this analysis include: operating revenues from all agricultural products sold, program payments and custom work revenues.
The following are not included in farm operating revenues: sales of forestry products (for example: firewood, pulpwood, logs, fence posts and pilings); sales of capital items (for example: quota, land, machinery); and revenues from the sale of any goods purchased only for retail sales.
Total operating expenses
Total operating expenses come from the ATDP. Previously, expenses for agricultural operations were reported to the Census of Agriculture. Caution should be taken when comparing the 2021 Census of Agriculture data with previous censuses.
The Census of Agriculture measures operating expenses (in current dollars) for the calendar or accounting year prior to the census. Total operating expenses include any expense associated with producing agricultural products (such as the cost of seed, feed, fuel, fertilizers).
The following are not included in total operating expenses: the purchase of land, buildings or equipment, and depreciation or capital cost allowance. Depreciation represents economic "wear and tear" expense. Capital cost allowance represents the amount of depreciation written off by the tax filer as allowed by tax regulations.
Expenses-to-revenues ratio
The expenses-to-revenues ratio is the average amount of operating expenses incurred for a dollar in farm operating revenues. The ratio is calculated in current dollars.
Census Day was May 11, 2021. Farmers were asked to report their operating revenues and expenses for the last complete fiscal or calendar year (2020).
Full-time employment is classified as farm operators who worked 30 hours or more per week; part-time employment is classified as farm operators who worked less than 30 hours per week.
Some data refer to a reference period other than Census Day. For example, for financial data the reference period is the calendar or accounting (fiscal) year prior to the census.
- Date modified: