
Skip to text
Text begins
Correction notice
On February 3, 2023, two corrections were made to the following sentences in the section “Significant increase in renewable energy production”: “More than a quarter (28.8%) of total farms in Canada reporting renewable energy production using a bioenergy system were in Quebec. The majority of these farms (60.4%) reported annual revenues of less than $100,000." The "28.8%" value replaced the "28.4%" value previously published, and the "60.4%" value replaced the "60.9%" value previously published. Selected data values on the share of national renewable energy practices in Table 4 were also corrected; the magnitude of each change was no more than 0.4 percentage points.
Quebec’s abundance of land and natural resources supports the province’s diverse farming activities. Data from the 2021 Census of Agriculture shows that Quebec is amongst Canada’s leaders in several agricultural commodities including maple, dairy cows, pigs and cranberries. Maple farming continues to provide worldwide recognition to Quebec, as the province exported over $568.9 million worth of maple sugar and syrup in 2021.
In 2021, Quebec accounted for 91.3% of farms in Canada classified as maple syrup and products, up 1.9% from 2016. Since the province had the vast majority of maple syrup farms, Quebec accounted for 89.1% of maple taps in Canada.
As was the case in the previous census, farms in Quebec reported more cranberry acreage than any other province. In 2021, farms in Quebec accounted for 11,477 acres of cranberries, up from 9,888 acres in 2016. The province’s share of national cranberry acreage also increased during this period.
Blueberry acreage followed a similar path and continued to expand in Quebec as well. In 2021, farms in Quebec reported 79,091 acres of blueberries, up from 71,666 in 2016. The province’s share of national blueberry acreage also increased during this period.
| 2016 | 2021 | Change from 2016 to 2021 | |
|---|---|---|---|
| percent | |||
| Maple taps | 90.5 | 89.1 | -1.4 |
| Cranberries | 54.5 | 58.4 | 3.9 |
| Blueberries | 36.6 | 40.9 | 4.3 |
| Dairy cows | 37.0 | 36.4 | -0.6 |
| Pigs | 32.0 | 29.6 | -2.4 |
| Sources: Statistics Canada, Census of Agriculture, 2016 and 2021 (3438). | |||
Quebec continues to lead Canada in the number of dairy cows, with 36.4% of the total number of dairy cows in Canada. Quebec also reported more pigs than any other province, accounting for 29.6% of total pigs in Canada. Quebec was followed closely by Ontario (27.9%) and Manitoba (23.7%).
Maple tap and pig inventories increase in Quebec
Despite operational challenges related to the pandemic, such as equipment cleaning and barrel delivery services, the total number of maple taps reported on Quebec farms increased by 14.4% from 2016 for a total of 48,672,648 maple taps in 2021.
Despite stringent environmental rules impacting pig farming, the average number of pigs per farm reporting pigs increased by 5.1% from 2016 to 2021.
The number of farms in Quebec increases while the national number drops
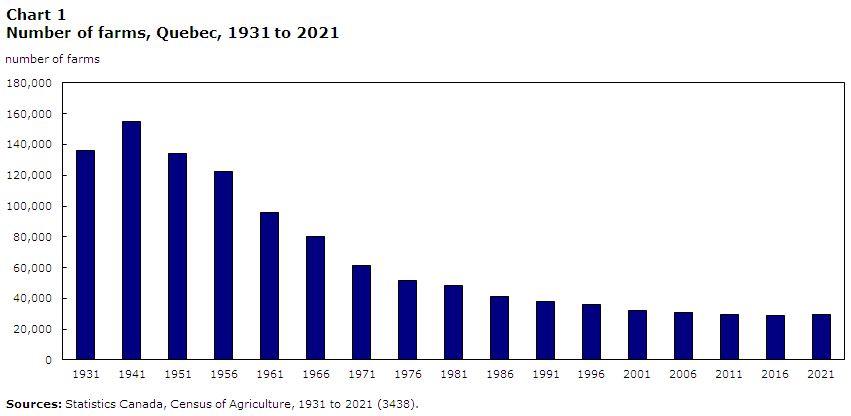
There was a 1.6% increase from the previous census in the number of farms reported in Quebec, from 28,919 in 2016 to 29,380 in 2021. By contrast, in Canada, the total number of farms reported decreased by 1.9% over the same period. Quebec accounted for 15.5% of total farms in Canada, up from 14.9% in 2016. In 2021, there were 29,380 farms reported in Quebec, an increase of 461 farms from 2016.
Data table for Chart 1
| Number of farms | |
|---|---|
| 1931 | 135,957 |
| 1941 | 154,669 |
| 1951 | 134,336 |
| 1956 | 122,617 |
| 1961 | 95,777 |
| 1966 | 80,294 |
| 1971 | 61,257 |
| 1976 | 51,587 |
| 1981 | 48,144 |
| 1986 | 41,448 |
| 1991 | 38,076 |
| 1996 | 35,991 |
| 2001 | 32,139 |
| 2006 | 30,675 |
| 2011 | 29,437 |
| 2016 | 28,919 |
| 2021 | 29,380 |
| Sources: Statistics Canada, Census of Agriculture, 1931 to 2021 (3438). | |
A small number of larger farms makes up most of the farm revenues in the province
In 2021, farms in Quebec with $1 million and over in revenues represented 9.9% of all farms in the province, but accounted for nearly two-thirds (62.5%) of all farm operating revenues. This is comparable to what was reported across the country over the same period. In Canada, farms with $1 million and over in revenues made up 9.9% of total farms and 69.1% of total farm operating revenues.
| Total farm revenues distribution | Total farm revenues | Number of farms | ||
|---|---|---|---|---|
| 2016 | 2021 | 2016 | 2021 | |
| percent | ||||
| Under $25,000 | 0.8 | 0.5 | 27.6 | 29.0 |
| $25,000 to $99,999 | 3.5 | 2.7 | 23.9 | 22.1 |
| $100,000 to $249,999 | 7.2 | 5.5 | 16.1 | 14.9 |
| $250,000 to $499,999 | 13.9 | 10.1 | 14.1 | 12.3 |
| $500,000 to $999,999 | 20.7 | 18.6 | 11.1 | 11.8 |
| $1,000,000 to $1,999,999 | 16.6 | 19.0 | 4.6 | 6.1 |
| $2,000,000 and over | 37.2 | 43.6 | 2.7 | 3.8 |
| All farms | 100.0 | 100.0 | 100.0 | 100.0 |
| Sources: Statistics Canada, Census of Agriculture, 2016 and 2021 (3438). | ||||
Dairy farm sales are distributed across many revenue classes
While the majority of total farm revenues is typically concentrated among farms in the higher revenue classes, dairy farms in Quebec were different in this regard. In 2020, farms classified as dairy and milk farms with revenues between $500,000 and $999,999 accounted for 9.3% of total farm revenues in Quebec. This was followed by dairy farms with revenues between $1,000,000 and $1,999,999 (6.6%) and those with revenues of $2 million and over (4.2%). By comparison, farms classified as hog and pig farms with revenues of $2 million and over accounted for 11.1% of total farm revenues in the province.
Dairy, pig and oilseed farms make up most farm revenues in Quebec
Despite fewer farms reporting from 2016, dairy and milk farms remained the provincial leader of farm operating revenues. In 2020, farms classified as dairy and milk made up nearly a quarter (24.5%) of total farm revenues and 15.1% of total farms in the province.
In 2020, farms classified as hog and pig made up 15.7% of total farm revenues, but only 4.3% of total farms in the province. Following hog and pig were oilseed and grain farms. In 2020, farms classified as oilseed and grain made up 13.5% total farm revenues and 17.6% of total farms in the province.
| Total farm revenues | Number of farms | |
|---|---|---|
| percent | ||
| Dairy and milk production | 24.5 | 15.1 |
| Beef farming and feedlots | 4.8 | 8.2 |
| Hog and pig farming | 15.7 | 4.3 |
| Poultry and egg production | 13.1 | 3.1 |
| Sheep and goat farming | 0.8 | 2.1 |
| Other animal production | 2.0 | 6.1 |
| Oilseed and grain farming | 13.5 | 17.6 |
| Vegetable and melon farming | 8.1 | 4.2 |
| Fruit and tree nut farming | 4.2 | 5.0 |
| Greenhouse, nursery and floriculture production | 6.4 | 4.1 |
| Other crop farming | 7.0 | 30.3 |
| Total | 100.0 | 100.0 |
| Source: Statistics Canada, Census of Agriculture, 2021 (3438). | ||
Quebec has the most farms reporting organic production
As was the case in the previous census, Quebec had more farms than any other province reporting being organic. In 2021, 2,474 farms reported organic production. This was nearly 2.5 times higher than the next closest province.
Quebec also increased its share of total farms reporting organic production in Canada. In 2016, the province accounted for 29.6% of total farms reporting organic production, and by 2021, it increased to 43.7%.
The proportion of farms in Quebec reporting organic production (fully certified and transitioning) nearly doubled from the previous census. In 2021, 8.4% of farms in the province reported organic production, up from 4.4% in 2016. This was more than twice the national rate. In 2021, 3.0% of farms in Canada reported organic production.
Organic production in Quebec was in large part because of farms classified as maple syrup and products. In 2021, nearly a quarter (23.3%) of farms in the province reporting organic production were maple syrup farms with revenues between $25,000 and $249,000.
The direct sales rate is higher in Quebec than in Canada
In 2020, over one-fifth of farms (20.9%) in Quebec reported direct sales. This is up from 18.9% in 2015. By comparison, 13.6% of farms in Canada reported direct sales in 2020.
Direct sales were particularly popular with maple syrup farms. In 2020, farms classified as maple syrup and products accounted for 30.3% of total farms in the province that reported direct sales.
Significant increase in renewable energy production
The proportion of farms reporting production of renewable energy in Quebec more than quadrupled from the previous census. In 2021, 7.8% of farms in the province reported renewable energy production, up from 1.8% of farms in the previous census. Despite this increase, the proportion still fell below the national level (11.9%).
The most frequently reported renewable energy production method in the province was bioenergy systems. More than a quarter (28.8%) of total farms in Canada reporting renewable energy production using a bioenergy system were in Quebec. The majority of these farms (60.4%) reported annual revenues of less than $100,000. A bioenergy system uses different forms of usable energy taken from biomass. Biomass is a biological material that comes in either a solid, liquid or gas that has stored sunlight as a form of chemical energy.
| Atlantic provinces | Quebec | Ontario | Prairie provinces | British Columbia | Canada | |
|---|---|---|---|---|---|---|
| percent | ||||||
| Wind turbines | 2.2 | 4.1 | 53.8 | 35.5 | 4.4 | 100.0 |
| Geothermal energy systems | 2.8 | 5.7 | 47.6 | 36.2 | 7.7 | 100.0 |
| Solar panels | 2.1 | 3.8 | 36.4 | 51.3 | 6.3 | 100.0 |
| Bioenergy | 5.0 | 28.4 | 31.6 | 28.4 | 6.6 | 100.0 |
| Source: Statistics Canada, Census of Agriculture, 2021 (3438). | ||||||
Quebec is the leader in robotic milking technology
Because of its large number of dairy cow farms, Quebec had more farms reporting robotic milking than any other province. In 2020, the province accounted for 41.1% of total farms in Canada that reported robotic milking technology. The number of farms reporting robotic milking in Quebec nearly doubled from the previous census. In 2015, 454 farms reported robotic milking, and by 2020, it was 902 farms.
The rate of reported technology use in Quebec was very similar to the rest of Canada. In 2020, just under half (49.8%) of farms in the province reported using technology, compared with 50.4% of farms in Canada.
Fewer farms have a succession plan
From 2016 to 2021, the number of farms reporting a succession plan in Quebec decreased by 162. The proportion of farms reporting a succession plan also decreased from 9.2% to 8.5% over the same period. At the national level, the proportion and number of farms reporting a succession plan increased over the same period. In Canada, 12.0% of farms reported a succession plan in 2021.
The number of Quebec farm operators is slightly up
For the first time since 1991, the number of farm operators in Quebec increased. From 2016 to 2021, the number of farm operators reported increased by 270, for a total of 42,265 farm operators.
The proportion of female operators in the province has remained quite stable since 1991, hovering around a quarter of total farm operators. In 2021, 27.7% of total farm operators reporting in Quebec were female, which was slightly lower than the national level (30.4%).
The trend of fewer young and middle-aged farm operators continues
The average Quebec farm operator is older, in large part because of the decreasing proportions of young and middle-aged farm operators. In 2021, the average farm operator was 54.0 years old, up from 52.9 years old in 2016. Meanwhile, the proportion of young farm operators (under 35 years) continued to decline. In 2021, young farm operators accounted for 8.6% of total farm operators reporting in the province, equal to the proportion at the national level.
The proportion of middle-aged farm operators (35 to 54 years) also declined. In 2021, middle-aged farm operators made up 38.0% of total farm operators reporting in Quebec, which was higher than the national level (30.9%).
Older farm operators (55 years and older) were the only group to grow. The proportion of older farm operators reported in Quebec increased from 47.3% in 2016 to 53.4% in 2021. Meanwhile, older farm operators accounted for 60.5% of total farm operators in Canada.

Data table for Chart 2
| Quebec | |||
|---|---|---|---|
| Under 35 years | 35 to 54 years | 55 years and older | |
| percent | |||
| 1991 | 25.3 | 52.3 | 22.4 |
| 1996 | 20.2 | 57.2 | 22.6 |
| 2001 | 13.7 | 60.4 | 25.9 |
| 2006 | 11.3 | 56.4 | 32.3 |
| 2011 | 10.9 | 49.4 | 39.7 |
| 2016 | 9.8 | 42.9 | 47.2 |
| 2021 | 8.6 | 38.0 | 53.4 |
|
Notes: Totals may not equal 100% due to rounding. Beginning in 1991, up to three operators per operation can be reported on the Census of Agriculture questionnaire. Sources: Statistics Canada, Census of Agriculture, 1991 to 2021 (3438). |
|||
More farm operators working off the farm
The proportion of farm operators in Quebec reporting working off the farm increased from 36.3% in 2015 to 45.8% in 2020. In Canada, the proportion of farm operators working off the farm increased from 44.4% to 47.7% during the same period.
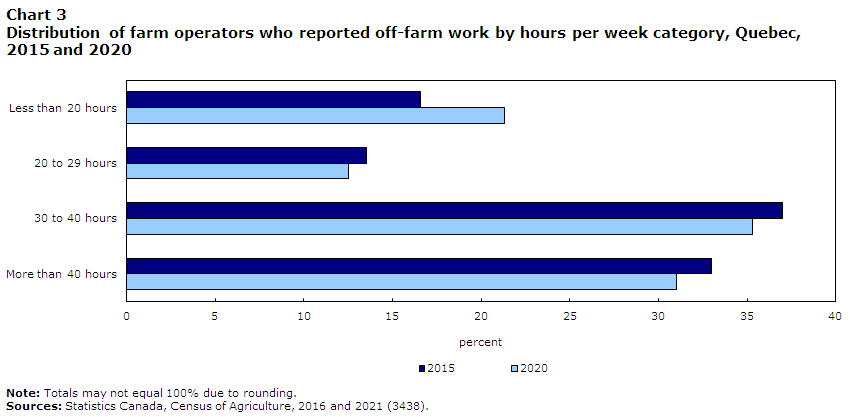
In 2020, about one fifth (21.3%) of farm operators who reported off-farm work reported working less than 20 hours per week off the farm, up from 16.6% in 2015. This was in line with total farm operators in Canada (22.1%). Meanwhile, farm operators working more than 40 hours per week off the farm accounted for 31.0% of operators working off-farm compared with 32.5% at the national level.
Data table for Chart 3
| 2015 | 2020 | |
|---|---|---|
| percent | ||
| More than 40 hours | 33.0 | 31.0 |
| 30 to 40 hours | 37.0 | 35.3 |
| 20 to 29 hours | 13.5 | 12.5 |
| Less than 20 hours | 16.6 | 21.3 |
|
Note: Totals may not equal 100% due to rounding. Sources: Statistics Canada, Census of Agriculture, 2016 and 2021 (3438). |
||
Definitions and concepts
A significant conceptual change to the main statistical unit used by Statistics Canada’s Agriculture Statistics Program has been introduced for the 2021 Census of Agriculture: a “farm” or an “agricultural holding” (i.e., the census farm) now refers to a unit that produces agricultural products and reports revenues or expenses for tax purposes to the Canada Revenue Agency. Before 2021, a “farm” was defined as an agricultural operation that produced at least one agricultural product intended for sale
In 2021, there have been changes to the definition of a census farm; in Yukon and Northwest Territories, some activities that were previously included within the definition are not included in 2021. Caution should be taken when comparing the 2021 Census of Agriculture data with data from previous censuses.
The data displayed by geography have undergone random tabular adjustment. The Canada total data for geographic breakdowns may differ from the Canada total data displayed in tables by North American Industry Classification System (NAICS) category and sales class.
The data for Yukon and the Northwest Territories are not included in the national totals; they are presented separately.
The Census of Agriculture is conducted every five years and is a census of all agricultural operations that produces agricultural products and reports revenues or expenses for tax purposes to the Canada Revenue Agency. Important concepts used in this analysis include:
Total farm area, which is land owned or operated by an agricultural operation, includes: cropland, summer fallow, improved and unimproved pasture, woodlands and wetlands, all other land (including idle land and land on which farm buildings are located).
Total farm area includes the total area of land owned, leased, rented, crop-shared or used by this operation minus land area used by others.
Cropland is the total area of field crops, hay, field vegetables, fruits, berries, nuts, sod, nursery products and Christmas trees.
Farm type is established through a procedure that classifies each census farm according to the predominant type of production. This is done by estimating the potential revenues from the inventories of crops and livestock reported on the questionnaire and determining the product or group of products that make up the majority of the estimated receipts. For example, a census farm with total potential revenues of 60% from hogs, 20% from beef cattle and 20% from wheat, would be classified as a hog and pig farm. The farm types presented in this document are derived based on the 2017 NAICS.
Farm operator refers to any person responsible for the management decisions in operating a farm or agricultural operation. Also known as an agricultural operator, farmer, operator or rancher.
Farm employees include both farm operators and agricultural workers.
Price indexes were used to obtain constant dollar estimates of sales, export values and farm assets in order to eliminate the impact of price change in year-to-year comparisons.
Farm operating revenues
Farm operating revenues come from the Agriculture Taxation Data Program (ATDP). Previously, revenues for agricultural operations were reported to the Census of Agriculture. Caution should be taken when comparing the 2021 Census of Agriculture data with previous censuses.
The Census of Agriculture measures farm operating revenues (in current dollars) for the calendar or accounting year prior to the census. Farm operating revenues (before deducting expenses) in this analysis include: operating revenues from all agricultural products sold, program payments and custom work revenues.
The following are not included in farm operating revenues: sales of forestry products (for example: firewood, pulpwood, logs, fence posts and pilings); sales of capital items (for example: quota, land, machinery); and revenues from the sale of any goods purchased only for retail sales.
Total operating expenses
Total operating expenses come from the ATDP. Previously, expenses for agricultural operations were reported to the Census of Agriculture. Caution should be taken when comparing the 2021 Census of Agriculture data with previous censuses.
The Census of Agriculture measures operating expenses (in current dollars) for the calendar or accounting year prior to the census. Total operating expenses include any expense associated with producing agricultural products (such as the cost of seed, feed, fuel, fertilizers).
The following are not included in total operating expenses: the purchase of land, buildings or equipment, and depreciation or capital cost allowance. Depreciation represents economic "wear and tear" expense. Capital cost allowance represents the amount of depreciation written off by the tax filer as allowed by tax regulations.
Expenses-to-revenues ratio
The expenses-to-revenues ratio is the average amount of operating expenses incurred for a dollar in farm operating revenues. The ratio is calculated in current dollars.
Census Day was May 11, 2021. Farmers were asked to report their operating revenues and expenses for the last complete fiscal or calendar year (2020).
Full-time employment is classified as farm operators who worked 30 hours or more per week; part-time employment is classified as farm operators who worked less than 30 hours per week.
Some data refer to a reference period other than Census Day. For example, for financial data the reference period is the calendar or accounting (fiscal) year prior to the census.
- Date modified: