
Canadian Agriculture at a Glance
New Brunswick leads Atlantic Canada in maple taps and lowbush blueberries
Skip to text
Text begins
Despite a limited supply of farming area due to varied soil composition and microclimates, New Brunswick enjoys a dynamic agricultural sector that is known for its sugar shacks and wild blueberries. Data from the 2021 Census of Agriculture shows that New Brunswick’s agriculture sector, while relatively small, is quite diverse with farms in every category.
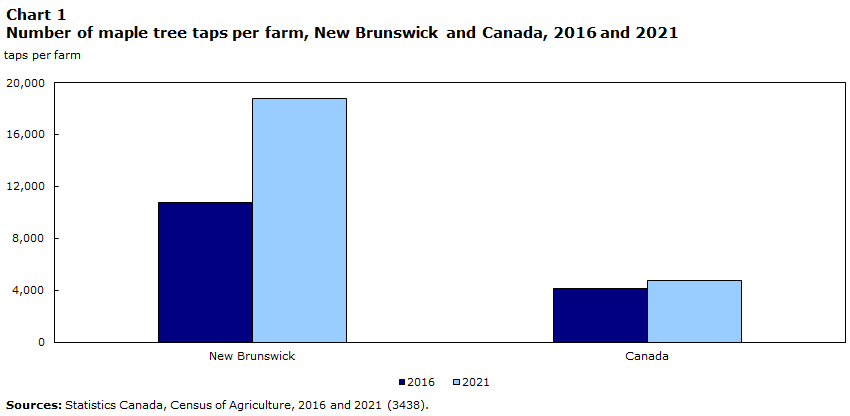
In 2021, farms in New Brunswick reported the second most maple taps in the country, with 3.5 million taps from 188 farms. On average, farms in the province that reported maple taps had 18,744 taps per farm. This is the highest rate in the country and higher than the national average of 4,735 taps per farm. This is also an increase from 2016, when New Brunswick again had the highest rate in the country of 10,782 taps per farm. Overall, the province accounted for 6.4% of the 54.6 million maple taps in the country, up from 4.9% in 2016.
Data table for Chart 1
| New Brunswick | Canada | |
|---|---|---|
| taps per farm | ||
| 2016 | 10,782 | 4,098 |
| 2021 | 18,744 | 4,735 |
| Sources: Statistics Canada, Census of Agriculture, 2016 and 2021 (3438). | ||
Almost all (99.0%) of the maple taps were on farms classified as “Maple syrup and products” farms. These farms reported $35.8 million in total revenues, equal to 4.9% of New Brunswick’s total farm operating revenues.
New Brunswick second in the country for lowbush blueberries
Farms in New Brunswick reported the second largest acreage for lowbush blueberries in the country, making up 22.2% of Canada’s total in 2021. The 36,127 acres of lowbush berries came from 241 farms, more acreage than any other Atlantic province.
In 2021, farms reporting lowbush blueberries accounted for over two-thirds (67.7%) of farms classified as fruit and tree nut. In 2021, fruit and tree nut farms made up 17.2% of total farms reporting in New Brunswick. Fruit and tree nut farms were the third most frequently reported farm type in the province, despite declining by 96 farms from 2016.
Meanwhile, farms classified as other crops made up the largest portion (23.0%) of total farms in New Brunswick. Farms classified as maple syrup and products accounted for over a quarter (26.8%) of those other crop farms.
In 2021, farms classified as beef and feedlots represented the second largest number of farms in the province, accounting for 18.6% of total farms reported. The number of beef farms increased by 4.6% from 2016.
| number | percent | |
| Dairy and milk production | 162 | 8.8 |
|---|---|---|
| Beef and feedlots | 344 | 18.6 |
| Hog and pig farming | 9 | 0.5 |
| Poultry and egg production | 53 | 2.9 |
| Sheep and goat farming | 33 | 1.8 |
| Other animal production | 139 | 7.5 |
| Oilseed and grain farming | 43 | 2.3 |
| Vegetable and melon farming | 189 | 10.2 |
| Fruit and tree nut farming | 319 | 17.2 |
| Greenhouse, nursery and floriculture production | 134 | 7.2 |
| Other crop farming | 426 | 23.0 |
| Total | 1,851 | 100.0 |
| Source: Statistics Canada, Census of Agriculture, 2021 (3438). | ||
Average farm area is stable, but still below Canadian average
New Brunswick reported 685,378 acres of farm area on 1,851 farms in 2021. This led to an average of 370.3 acres per farm, relatively unchanged from 370.4 acres per farm in 2016, but still lower than the Canadian average of 809 acres per farm.
Potato farms accounted for more revenues than any other farm type
More than a quarter of total farm revenues in New Brunswick came from farms classified as potato farms. In 2020, farms in New Brunswick reported $734.2 million in total annual farm revenues. Potato farms accounted for 28.2%, or $205.3 million, of those total revenues. Potato farms were followed by dairy and milk farms ($127.2 million) and broiler and other meat-type chicken farms ($97.4 million).
Total operating expenses in New Brunswick amounted to $627.1 million in 2020. Potato farms ($179.9 million) had the highest farm expenses in the province, followed by dairy and milk farms ($109.1 million) and broiler and other meat - chicken ($86.3 million).

Data table for Chart 2
| Revenues | Expenses | |||
|---|---|---|---|---|
| 2015 | 2020 | 2015 | 2020 | |
| percent | ||||
| Potato farming | 25.2 | 28.2 | 24.7 | 28.5 |
| Dairy and milk production | 18.4 | 17.5 | 17.9 | 17.3 |
| Broiler and other meat-type chicken | 13.0 | 13.4 | 12.7 | 13.7 |
| Sources: Statistics Canada, Census of Agriculture, 2016 and 2021 (3438). | ||||
More than a quarter of farms in New Brunswick reported direct sales
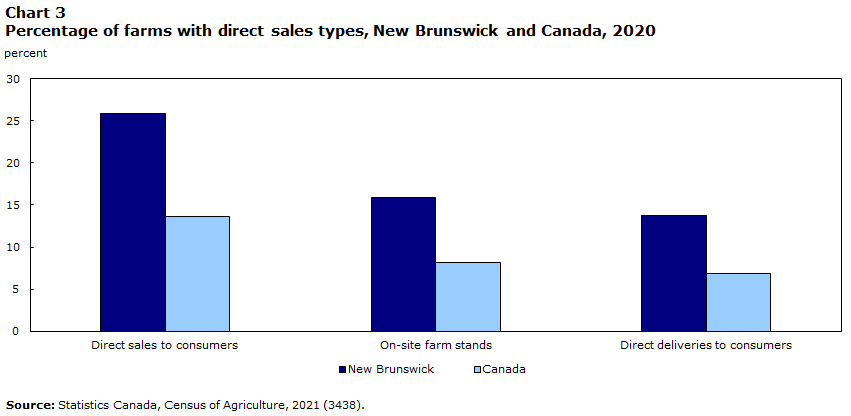
In 2020, 25.9% of farms in New Brunswick reported direct sales, up from 22.1% in 2015. This was significantly higher than the Canadian average (13.6%). A similar trend was evident across reporting for direct sales methods such as on-site stand and direct delivery. In 2020, the proportions of farms reporting on-site stands and direct delivery in New Brunswick were nearly twice as large as the national rate.
Data table for Chart 3
| Direct sales to consumers | On-site farm stands | Direct deliveries to consumers | |
|---|---|---|---|
| percent | |||
| New Brunswick | 25.9 | 15.9 | 13.7 |
| Canada | 13.6 | 8.2 | 6.8 |
| Source: Statistics Canada, Census of Agriculture, 2021 (3438). | |||
New Brunswick farms less likely to have a succession plan
In 2021, less than a tenth (7.7%) of farms in New Brunswick reported having a succession plan. This is slightly higher than in 2016 (7.1%), but lower than the Canadian average of 12.0%. As was the case across Canada, farms in the larger revenues classes were more likely to report a succession plan in New Brunswick.
One possible reason for the difference in succession plan rates could be because of the fact that New Brunswick reported a smaller proportion of farms with revenues of $100,000 and over. In 2020, 34.0% of farms in New Brunswick reported revenues of $100,000 and over, compared with 44.2% of farms in Canada.
More farms in New Brunswick are producing renewable energy
A total of 8.8% of all farms in New Brunswick reported renewable energy production in 2021. While this was lower than the average in Canada (11.9%), it was an increase from the previous census, when 1.7% of New Brunswick farms reported renewable energy production.
While there are fewer farm operators in New Brunswick, more of them are female
The total number of farm operators reported in the province decreased 17.6% from 2016 to 2021, whereas in Canada, the total number of farm operators decreased 3.5%. Meanwhile, the proportion of female farm operators in New Brunswick increased to just under a quarter of all farm operators (23.6%). However, this was still below the national level of 30.4%.
The average age of farm operators is rising
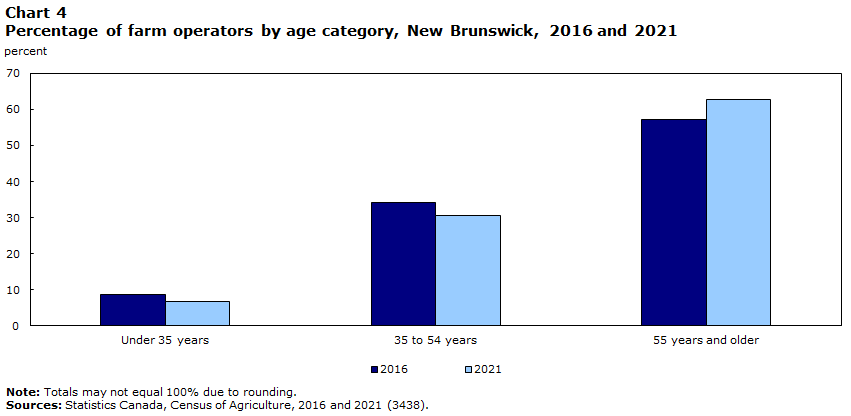
In 2021, the average age reported for farm operators in New Brunswick was 57.0 years old, up from 55.6 in 2016. This was also higher than the Canadian average of 56.0 years old. From 2016 to 2021, the proportion of farm operators 55 years and older increased from 57.2% to 62.8%, while the proportion of younger farm operators (younger than 55 years old) decreased from 42.8% to 37.2%.
Data table for Chart 4
| Under 35 years | 35 to 54 years | 55 years and older | |
|---|---|---|---|
| percent | |||
| 2016 | 8.7 | 34.2 | 57.2 |
| 2021 | 6.7 | 30.5 | 62.8 |
|
Note: Totals may not equal 100% due to rounding. Sources: Statistics Canada, Census of Agriculture, 2016 and 2021 (3438). |
|||
More farm operators working off the farm
In 2020, 45.9% of farm operators in the province reported off-farm work, up from 44.3% in 2015. This is below the Canadian average, where just under half (47.7%) of total farm operators reported off-farm work. Of those who worked off farm in New Brunswick, almost three-quarters (72.7%) worked full time. In Canada, almost two-thirds (66.0%) of farm operators who reported off-farm work held full-time jobs off the farm.
Start of text boxDefinitions and concepts
A significant conceptual change to the main statistical unit used by Statistics Canada’s Agriculture Statistics Program has been introduced for the 2021 Census of Agriculture: a “farm” or an “agricultural holding” (i.e., the census farm) now refers to a unit that produces agricultural products and reports revenues or expenses for tax purposes to the Canada Revenue Agency. Before 2021, a “farm” was defined as an agricultural operation that produced at least one agricultural product intended for sale
In 2021, there have been changes to the definition of a census farm; in Yukon and Northwest Territories, some activities that were previously included within the definition are not included in 2021. Caution should be taken when comparing the 2021 Census of Agriculture data with data from previous censuses.
The data displayed by geography have undergone random tabular adjustment. The Canada total data for geographic breakdowns may differ from the Canada total data displayed in tables by North American Industry Classification System (NAICS) category and sales class.
The data for Yukon and the Northwest Territories are not included in the national totals; they are presented separately.
The Census of Agriculture is conducted every five years and is a census of all agricultural operations that produces agricultural products and reports revenues or expenses for tax purposes to the Canada Revenue Agency. Important concepts used in this analysis include:
Total farm area, which is land owned or operated by an agricultural operation, includes: cropland, summer fallow, improved and unimproved pasture, woodlands and wetlands, all other land (including idle land and land on which farm buildings are located).
Total farm area includes the total area of land owned, leased, rented, crop-shared or used by this operation minus land area used by others.
Cropland is the total area of field crops, hay, field vegetables, fruits, berries, nuts, sod, nursery products and Christmas trees.
Farm type is established through a procedure that classifies each census farm according to the predominant type of production. This is done by estimating the potential revenues from the inventories of crops and livestock reported on the questionnaire and determining the product or group of products that make up the majority of the estimated receipts. For example, a census farm with total potential revenues of 60% from hogs, 20% from beef cattle and 20% from wheat, would be classified as a hog and pig farm. The farm types presented in this document are derived based on the 2017 NAICS.
Farm operator refers to any person responsible for the management decisions in operating a farm or agricultural operation. Also known as an agricultural operator, farmer, operator or rancher.
Farm employees include both farm operators and agricultural workers.
Price indexes were used to obtain constant dollar estimates of sales, export values and farm assets in order to eliminate the impact of price change in year-to-year comparisons.
Farm operating revenues
Farm operating revenues come from the Agriculture Taxation Data Program (ATDP). Previously, revenues for agricultural operations were reported to the Census of Agriculture. Caution should be taken when comparing the 2021 Census of Agriculture data with previous censuses.
The Census of Agriculture measures farm operating revenues (in current dollars) for the calendar or accounting year prior to the census. Farm operating revenues (before deducting expenses) in this analysis include: operating revenues from all agricultural products sold, program payments and custom work revenues.
The following are not included in farm operating revenues: sales of forestry products (for example: firewood, pulpwood, logs, fence posts and pilings); sales of capital items (for example: quota, land, machinery); and revenues from the sale of any goods purchased only for retail sales.
Total operating expenses
Total operating expenses come from the ATDP. Previously, expenses for agricultural operations were reported to the Census of Agriculture. Caution should be taken when comparing the 2021 Census of Agriculture data with previous censuses.
The Census of Agriculture measures operating expenses (in current dollars) for the calendar or accounting year prior to the census. Total operating expenses include any expense associated with producing agricultural products (such as the cost of seed, feed, fuel, fertilizers).
The following are not included in total operating expenses: the purchase of land, buildings or equipment, and depreciation or capital cost allowance. Depreciation represents economic "wear and tear" expense. Capital cost allowance represents the amount of depreciation written off by the tax filer as allowed by tax regulations.
Expenses-to-revenues ratio
The expenses-to-revenues ratio is the average amount of operating expenses incurred for a dollar in farm operating revenues. The ratio is calculated in current dollars.
Census Day was May 11, 2021. Farmers were asked to report their operating revenues and expenses for the last complete fiscal or calendar year (2020).
Full-time employment is classified as farm operators who worked 30 hours or more per week; part-time employment is classified as farm operators who worked less than 30 hours per week.
Some data refer to a reference period other than Census Day. For example, for financial data the reference period is the calendar or accounting (fiscal) year prior to the census.
- Date modified: