
Skip to text
Text begins
Correction notice
On February 3, 2023, a correction was made to the following sentence in the section “Prince Edward Island above average in selling products directly to consumers”: “In 2020, 17.2% of all farms in Prince Edward Island sold unprocessed agricultural products directly to consumers, higher than the Canadian average of 13.1% and higher than the 14.0% of Prince Edward Island farms in 2015." The "13.1%" value replaced the "13.0%" value previously published.
Prince Edward Island is famous for its potatoes. The province is home to over 100 varieties of potatoes that are shipped all around the world. The province’s iron-rich soil provides the right amount of moisture during growing season which helps make conditions ideal for this crop. Data from the 2021 Census of Agriculture shows how potato farming in Prince Edward Island plays a major role in both the province’s agricultural industry and Canada’s.
Prince Edward Island grew more potatoes and reported the second highest revenue on potato farms in Canada. Farms in Prince Edward Island reported more than a fifth of Canada’s total acres of potatoes grown (85,235 acres) in 2021, and total revenues ($371.8 million) on potato type farms in 2020.
These results took place against the backdrop of an increase in prices for fresh potatoes. In 2021, the Farm Product Price Index indicates that fresh potatoes in Canada saw a 13.9% increase over the past five years (January 2017-December 2021) in the index price. At the same time, the industry also faced trade barrier issues, most notably from the United States which is the top export market for Canadian potatoes.
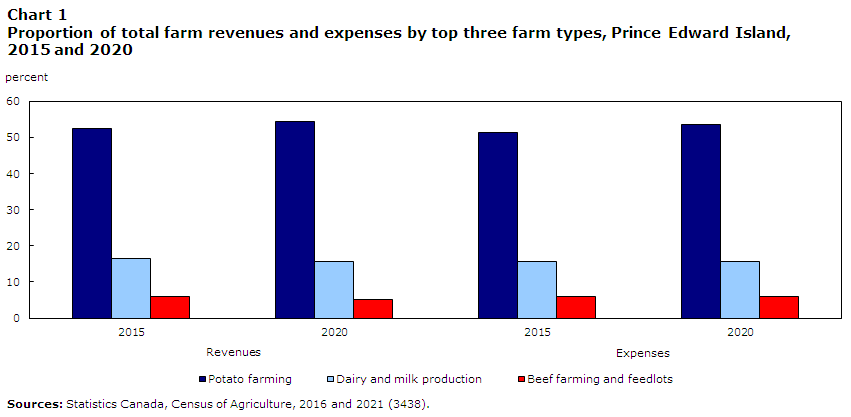
More than half of total farm revenues in Prince Edward Island came from farms classified as potato farms. In 2020, farms in Prince Edward Island reported $682.2 million in total annual farm revenues, with 54.5% coming from potato farms. This was followed by dairy and milk (15.8%) and beef and feedlot (5.1%) farms.
Data table for Chart 1
| Revenues | Expenses | |||
|---|---|---|---|---|
| 2015 | 2020 | 2015 | 2020 | |
| percent | ||||
| Potato farming | 52.6 | 54.5 | 51.4 | 53.6 |
| Dairy and milk production | 16.4 | 15.8 | 15.7 | 15.8 |
| Beef farming and feedlots | 5.9 | 5.1 | 6.1 | 6.0 |
| Sources: Statistics Canada, Census of Agriculture, 2016 and 2021 (3438). | ||||
While potato farm numbers have decreased, beef and feedlot farm numbers have increased
From 2016 to 2021, the number of potato farms decreased by 13.4%. Despite this decrease, they remained the second most frequently reported farm type in the province behind farms classified as beef and feedlots, which increased by 6.3% during the same period.
In 2021, Prince Edward Island reported 1,195 farms, down 11.7% from 2016. Meanwhile, in Canada, the total number of farms decreased by 1.9%. In 2021, Prince Edward Island accounted for 0.6% of total farms reported in Canada, a 0.1 percentage point decrease from 2016.
| number | percent | |
|---|---|---|
| Dairy and milk production | 157 | 13.1 |
| Beef farming and feedlots | 269 | 22.5 |
| Hog and pig farming | 7 | 0.6 |
| Poultry and egg production | 22 | 1.8 |
| Sheep and goat farming | 24 | 2.0 |
| Other animal production | 62 | 5.2 |
| Oilseed and grain farming | 136 | 11.4 |
| Vegetable and melon farming | 218 | 18.2 |
| Fruit and tree nut farming | 148 | 12.4 |
| Greenhouse, nursery and floriculture production | 36 | 3.0 |
| Other crop farming | 116 | 9.7 |
| Total | 1,195 | 100.0 |
| Source: Statistics Canada, Census of Agriculture, 2021 (3438). | ||
Potato farms lead decrease in farm area in Prince Edward Island
From 2016 to 2021, farms in Prince Edward Island reported a 12.3% decrease in total farm area. This is larger than the 3.2% decline in total farm area in Canada during the same period. The largest decrease of farm area in Prince Edward Island was reported in potato farms. In 2021, potato farms made up 43.4% of total farm area in the province (219,147 acres). Potato farm acreage decreased 11.1% from 2016, representing 38.9% of the total farm area decrease in Prince Edward Island over the period. This is different from what was reported in Canada, where potato farm acreage increased 2.0% from 2016 to 2021.
Potato farms make up the majority of farms classified as vegetable and melon
In the North American Industry Classification System (NAICS), potato farms are reported under the larger classification called “vegetable and melon farming.” In 2021, potato farms accounted for 80.3% of vegetable and melon farms reported in Prince Edward Island. Potato farms also made up the biggest portion (96.5%) of vegetable and melon farm area.
Vegetable and melon farm area made up the biggest portion of farm area in the province. In 2021, vegetable and melon farm area accounted for 45.0% of total farm area reported in Prince Edward Island. This was followed by dairy and milk (14.2%) and oilseed and grain (13.9%) farm area.
| 2016 | 2021 | |
|---|---|---|
| acres | ||
| Dairy and milk production | 75,500 | 71,466 |
| Beef farming and feedlots | 62,434 | 58,963 |
| Hog and pig farming | 3,635 | 2,523 |
| Poultry and egg production | 2,193 | 1,569 |
| Sheep and goat farming | 2,497 | 2,044 |
| Other animal production | 15,247 | 12,793 |
| Oilseed and grain farming | 85,143 | 70,422 |
| Vegetable and melon farming | 257,414 | 227,163 |
| Fruit and tree nut farming | 31,704 | 27,567 |
| Greenhouse, nursery and floriculture production | 3,283 | 3,056 |
| Other crop farming | 36,440 | 27,488 |
| Total farm area | 575,490 | 505,054 |
| Sources: Statistics Canada, Census of Agriculture, 2016 and 2021 (3438). | ||
Despite high potato farm size, Prince Edward Island below national average farm size
With 1,195 farms reporting in Prince Edward Island, there was an average of 422 acres per farm in 2021. This was relatively unchanged from the 425 acres per farm reported in 2016. This is below the Canadian average, which was 809 acres per farm in 2021. However, the average farm area for potato farms increased 2.6% from 2016 to 2021, up to 1,252 acres per farm, higher than the average total farm area for Prince Edward Island and Canada.
Prince Edward Island above national average in bioenergy production
The proportion of farms reporting renewable energy nearly doubled from the last census. This was mainly because of bioenergy production. In 2021, 10.6% of farms in Prince Edward Island reported renewable energy, up from 5.8% in the previous census.
Meanwhile, the most frequently reported method was biomass combustion. Nearly half (48.8%) of farms that reported renewable energy production in the province engaged in biomass combustion. Overall, 5.2% of farms in Prince Edward Island reported bioenergy production, nearly double the national average (2.9%) reported in 2021.
Prince Edward Island among the leaders for plowing down green crops and planting winter cover crops
Prince Edward Island was the most likely out of all the provinces to use the practice of plowing down green crops. In 2020, nearly a third (29.2%) of farms reported plowing down green crops, which was more than three times higher than the Canadian average (8.6%). Plowing down green crops is when a crop such as winter wheat, fall rye, buckwheat or red clover is planted but plowed under before it can be harvested.
More than a fifth (21.9%) of farms in the province reported planting winter cover crops, over double the 10.7% national adoption rate. Winter cover crops are seeded in the fall to protect the soil from water and wind erosion during the winter and from heavy rains and run-off in the spring.
Farms in Prince Edward Island reported the lowest adoption rate of all the provinces for in-field winter grazing or feeding, at 5.1%, compared with the Canadian average of 16.0%. In-field winter grazing or feeding is the practice of keeping grazing livestock in the field over winter, where they are fed hay or graze on crop residues instead of being confined in paddocks closer to the barns.
Prince Edward Island more likely than other provinces to test soil samples
In 2020, just under half (48.5%) of farms in Prince Edward Island reported conducting a soil sample test, more than any other province. In comparison, just under a third (32.0%) of all farms in Canada reported conducting a soil sample test. A soil sample test is used to gather information about the level of nutrients in the soil. Prince Edward Island also reported the highest rate of slow-release fertilizer use in the country, with 31.8% of farms in the province using slow-release fertilizer, compared with 23.4% of farms in Canada. A slow-release fertilizer is a special fertilizer that gradually releases nutrients into the soil.
Prince Edward Island above average in selling products directly to consumers
In 2020, 17.2% of all farms in Prince Edward Island sold unprocessed agricultural products directly to consumers, higher than the Canadian average of 13.1% and higher than the 14.0% of Prince Edward Island farms in 2015. The most frequently reported method of direct sales was onsite stands, which was used by 10.5% of all farms in Prince Edward Island, compared with 8.2% of all farms in Canada.
Prince Edward Island slightly below national average for succession planning
In 2021, more than a tenth (11.3 %) of farms in Prince Edward Island reported a succession plan, up from 8.4% in 2016. Despite the increase, the proportion of farms reporting a succession plan remained below the Canadian average of 12.0%.
While there are fewer farm operators in Prince Edward Island, more of them are female
The total number of farm operators in the province decreased 11.7% from 2016 to 2021. Meanwhile, in Canada, the total number of farm operators decreased 3.5%. The proportion of female farm operators in Prince Edward Island increased to a fifth of all farm operators (20.0%). However, this is still below the national level of 30.4%.
The average age of farm operators has increased
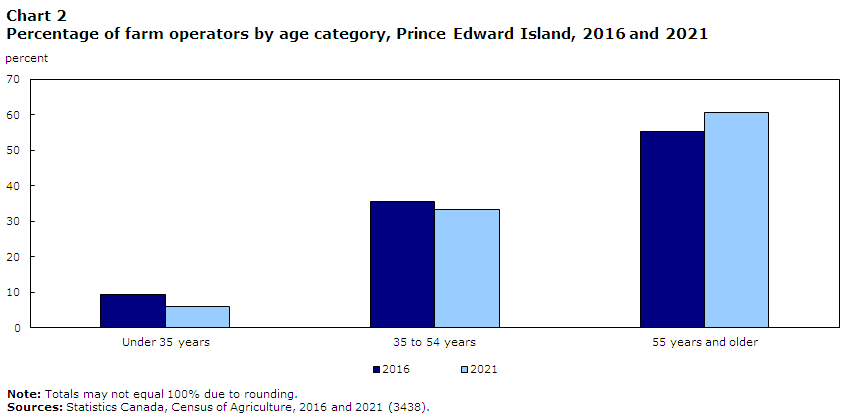
In 2021, the average age reported for farm operators in Prince Edward Island was 56.4 years old, up from 55.0 in 2016, and higher than the Canadian average of 56.0 years old. More than 6 in 10 farm operators (60.6%) in Prince Edward Island were 55 years and older, higher than 55.1% of farm operators in 2016. Throughout Canada, 60.5% of all farm operators were 55 years and older. Meanwhile, the proportion of farm operators in the province younger than 55 decreased.
Data table for Chart 2
| Under 35 years | 35 to 54 years | 55 years and older | |
|---|---|---|---|
| percent | |||
| 2016 | 9.4 | 35.6 | 55.2 |
| 2021 | 5.9 | 33.4 | 60.6 |
|
Note: Totals may not equal 100% due to rounding. Sources: Statistics Canada, Census of Agriculture, 2016 and 2021 (3438). |
|||
More farm operators work off the farm
In 2020, nearly half of farm operators (43.4%) in the province reported working off the farm, up from 40.5% in 2015. This is below the Canadian average, where 47.7% of all farm operators reported off-farm work. Of those who worked off farm in Prince Edward Island, more than two-thirds (69.1%) worked full time, while just under one-third (30.9%) worked part time. In Canada, almost two-thirds of farm operators who reported off-farm work (66.0%) held full-time jobs off the farm.
Start of text boxDefinitions and concepts
A significant conceptual change to the main statistical unit used by Statistics Canada’s Agriculture Statistics Program has been introduced for the 2021 Census of Agriculture: a “farm” or an “agricultural holding” (i.e., the census farm) now refers to a unit that produces agricultural products and reports revenues or expenses for tax purposes to the Canada Revenue Agency. Before 2021, a “farm” was defined as an agricultural operation that produced at least one agricultural product intended for sale
In 2021, there have been changes to the definition of a census farm; in Yukon and Northwest Territories, some activities that were previously included within the definition are not included in 2021. Caution should be taken when comparing the 2021 Census of Agriculture data with data from previous censuses.
The data displayed by geography have undergone random tabular adjustment. The Canada total data for geographic breakdowns may differ from the Canada total data displayed in tables by North American Industry Classification System (NAICS) category and sales class.
The data for Yukon and the Northwest Territories are not included in the national totals; they are presented separately.
The Census of Agriculture is conducted every five years and is a census of all agricultural operations that produces agricultural products and reports revenues or expenses for tax purposes to the Canada Revenue Agency. Important concepts used in this analysis include:
Total farm area, which is land owned or operated by an agricultural operation, includes: cropland, summer fallow, improved and unimproved pasture, woodlands and wetlands, all other land (including idle land and land on which farm buildings are located).
Total farm area includes the total area of land owned, leased, rented, crop-shared or used by this operation minus land area used by others.
Cropland is the total area of field crops, hay, field vegetables, fruits, berries, nuts, sod, nursery products and Christmas trees.
Farm type is established through a procedure that classifies each census farm according to the predominant type of production. This is done by estimating the potential revenues from the inventories of crops and livestock reported on the questionnaire and determining the product or group of products that make up the majority of the estimated receipts. For example, a census farm with total potential revenues of 60% from hogs, 20% from beef cattle and 20% from wheat, would be classified as a hog and pig farm. The farm types presented in this document are derived based on the 2017 NAICS.
Farm operator refers to any person responsible for the management decisions in operating a farm or agricultural operation. Also known as an agricultural operator, farmer, operator or rancher.
Farm employees include both farm operators and agricultural workers.
Price indexes were used to obtain constant dollar estimates of sales, export values and farm assets in order to eliminate the impact of price change in year-to-year comparisons.
Farm operating revenues
Farm operating revenues come from the Agriculture Taxation Data Program (ATDP). Previously, revenues for agricultural operations were reported to the Census of Agriculture. Caution should be taken when comparing the 2021 Census of Agriculture data with previous censuses.
The Census of Agriculture measures farm operating revenues (in current dollars) for the calendar or accounting year prior to the census. Farm operating revenues (before deducting expenses) in this analysis include: operating revenues from all agricultural products sold, program payments and custom work revenues.
The following are not included in farm operating revenues: sales of forestry products (for example: firewood, pulpwood, logs, fence posts and pilings); sales of capital items (for example: quota, land, machinery); and revenues from the sale of any goods purchased only for retail sales.
Total operating expenses
Total operating expenses come from the ATDP. Previously, expenses for agricultural operations were reported to the Census of Agriculture. Caution should be taken when comparing the 2021 Census of Agriculture data with previous censuses.
The Census of Agriculture measures operating expenses (in current dollars) for the calendar or accounting year prior to the census. Total operating expenses include any expense associated with producing agricultural products (such as the cost of seed, feed, fuel, fertilizers).
The following are not included in total operating expenses: the purchase of land, buildings or equipment, and depreciation or capital cost allowance. Depreciation represents economic "wear and tear" expense. Capital cost allowance represents the amount of depreciation written off by the tax filer as allowed by tax regulations.
Expenses-to-revenues ratio
The expenses-to-revenues ratio is the average amount of operating expenses incurred for a dollar in farm operating revenues. The ratio is calculated in current dollars.
Census Day was May 11, 2021. Farmers were asked to report their operating revenues and expenses for the last complete fiscal or calendar year (2020).
Full-time employment is classified as farm operators who worked 30 hours or more per week; part-time employment is classified as farm operators who worked less than 30 hours per week.
Some data refer to a reference period other than Census Day. For example, for financial data the reference period is the calendar or accounting (fiscal) year prior to the census.
- Date modified: