
Farm and Farm Operator Data
Farmers are adapting to evolving markets

Archived Content
Information identified as archived is provided for reference, research or recordkeeping purposes. It is not subject to the Government of Canada Web Standards and has not been altered or updated since it was archived. Please "contact us" to request a format other than those available.
Farm profitability remains constant between Censuses
In 2015, Canadian agricultural operations incurred an average of 83 cents in operating expenses per dollar in gross farm receipts. This amount remained unchanged in comparison to 2010.
Start of text box
The expense-to-receipt ratio is the average amount incurred in operating expenses for a dollar in gross farm receipts. The ratio is calculated using current dollars while the rest is in constant dollars.
The Census of Agriculture defines an agricultural operation as one that produces agricultural products intended for sale.
Price indices were used to obtain constant dollar estimates of receipts, expenditures and capital values in order to eliminate the impact of price change in year-to-year comparison.
Census Day was May 10th, 2016. Farmers were asked to report their receipts and expenses for the last complete fiscal or calendar year (2015). The reference year for all other variables mentioned in this article is 2016.
End of text box
When eliminating the impact of price change, gross farm receipts totalled $69.4 billion in 2015, an increase of 4.7% since 2010, with larger revenue farms responsible for most of the rise.
Oilseed and grain type farms continued to grow in importance, accounting for the largest share (37.8%) of total receipts in 2015.
Total operating expenses were $57.5 billion in 2015, up 6.6% since 2010.
The total value of capital owned or rented by Canadian farms totalled $509.7 billion in 2016, up 36.8% since 2011, mainly driven by the increase in the value of land and buildings.
Expense-to-receipt ratio remains unchanged nationally
The expense-to-receipt ratio is calculated using current dollars as opposed to constant dollars. It is a good indicator of how changes in prices and production affect both operating expenses and farm receipts, and consequently the profitability of farm operations. While varying by province and farm type, the national expense-to-receipt ratio remained unchanged at 0.83.
Saskatchewan continued to have the lowest expense-to-receipt ratio among the provinces (Table 1). However, it became less favourable moving from 0.76 in 2010 to 0.78 in 2015. This was largely driven by oilseed and grain type farms, which accounted for 79.7% of all receipts in the province in 2015.
| Province | 2010 | 2015 |
|---|---|---|
| Expense-to-receipt ratio | ||
| Newfoundland and Labrador | 0.86 | 0.88 |
| Prince Edward Island | 0.85 | 0.85 |
| Nova Scotia | 0.84 | 0.89 |
| New Brunswick | 0.86 | 0.85 |
| Quebec | 0.82 | 0.84 |
| Ontario | 0.84 | 0.85 |
| Manitoba | 0.83 | 0.81 |
| Saskatchewan | 0.76 | 0.78 |
| Alberta | 0.85 | 0.84 |
| British Columbia | 0.89 | 0.85 |
| Canada | 0.83 | 0.83 |
| Source: Census of Agriculture (3438). | ||
Oilseed and grain type farms continued to have one of the best ratios nationally at 0.79 (Table 2), despite the fact that the ratio is not as favourable compared with 2010. Prices for these commodities peaked in 2012-2013, but have since decreased for the majority of crops (Chart 1). At the same time, the cost of inputs for this type of production have been increasing, resulting in a less favourable expense-to-receipt ratio in 2015 compared with 2010.
| Operation type | 2010 | 2015 |
|---|---|---|
| Expense-to-receipt ratio | ||
| Livestock total | 0.86 | 0.86 |
| Dairy cattle and milk production | 0.73 | 0.77 |
| Beef and feedlot | 0.93 | 0.90 |
| Hog and pig | 0.92 | 0.90 |
| Poultry and egg | 0.84 | 0.84 |
| Sheep and goat | 1.01 | 0.96 |
| Other animal | 0.88 | 0.88 |
| Crop total | 0.80 | 0.80 |
| Oilseed and grain | 0.76 | 0.79 |
| Vegetable and melon | 0.84 | 0.83 |
| Fruit and tree nut | 0.90 | 0.84 |
| Greenhouse | 0.86 | 0.85 |
| Other crop | 0.89 | 0.83 |
| Total | 0.83 | 0.83 |
| Source: Census of Agriculture (3438). | ||
Among specialty crops, dry pea and bean type farms had the most favourable ratio in 2015 at 0.71, the result of an increase in commodity price that outpaced a rise in the cost of inputs between 2010 and 2015. Poor growing conditions in India fueled strong export demand for dry peas and lentils. The total quantity of lentils exported by Canada more than doubled between 2010 and 2015 (Canadian Merchandise Trade Database table 980-0007).

Data table for Chart 1
| Year | FIPI crop production | FPPI grains | FPPI oilseeds | FPPI specialty crops |
|---|---|---|---|---|
| index (2010=100) | ||||
| 2010 | 100.0 | 100.0 | 100.0 | 100.0 |
| 2011 | 107.1 | 131.2 | 124.9 | 116.5 |
| 2012 | 114.7 | 142.8 | 133.7 | 120.5 |
| 2013 | 111.8 | 140.3 | 133.8 | 119.4 |
| 2014 | 115.2 | 113.4 | 110.1 | 111.3 |
| 2015 | 116.3 | 123.7 | 110.8 | 147.8 |
| Sources: CANSIM tables 002-0069 and 328-0015 (accessed April 13, 2017). | ||||
Quebec’s ratio was the lowest outside of the Prairie Provinces at 0.84 in 2015, but less favourable than it was in 2010. The dairy and milk sector accounted for more than one-quarter of all receipts in the province in 2015.
While dairy and milk type farms maintained the lowest expense-to-receipt ratio nationally at 0.77, it was less favourable than in 2010. Meanwhile, milk production rose 8.7% despite fewer dairy cows (CANSIM table 003-0011, accessed April 13, 2017).
Although there has been growth in productivity, the costNote 1 of producing one standard hectolitre of milk also rose, up 5.8% between 2010 and 2015 (Canadian Dairy Commission 2011 and 2016). By comparison, the price received by farmers for their production increased 2.5% between 2010 and 2015 (CANSIM table 002-0069). Consequently, the increase in expenses reported outpaced the increase in receipts, resulting in a less favourable ratio.
Manitoba had one of the largest improvements in ratios among all provinces. A more favourable ratio in the hog sector, which accounted for 16.8% of Manitoba’s receipts in 2015, contributed to the more favourable ratio provincially.
At the time of the 2011 Census of Agriculture, the hog sector was just recovering from a period of low prices, disease outbreaks, and increasing feed prices. Since that time, Canadian hog farms have increased production, gained efficiency and managed disease effectively.
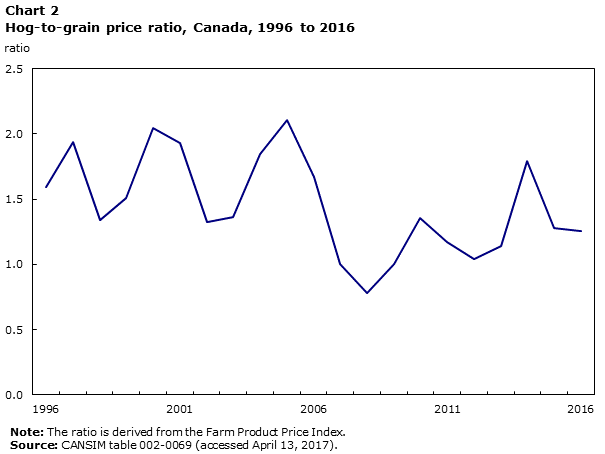
Data table for Chart 2
| Year | Ratio |
|---|---|
| 1996 | 1.60 |
| 1997 | 1.94 |
| 1998 | 1.34 |
| 1999 | 1.51 |
| 2000 | 2.05 |
| 2001 | 1.93 |
| 2002 | 1.33 |
| 2003 | 1.36 |
| 2004 | 1.85 |
| 2005 | 2.11 |
| 2006 | 1.67 |
| 2007 | 1.00 |
| 2008 | 0.78 |
| 2009 | 1.00 |
| 2010 | 1.36 |
| 2011 | 1.17 |
| 2012 | 1.04 |
| 2013 | 1.14 |
| 2014 | 1.79 |
| 2015 | 1.28 |
| 2016 | 1.26 |
|
Note: The ratio is derived from the Farm Product Price Index. Source: CANSIM table 002-0069 (accessed April 13, 2017). |
|
Since feed expenses represent a large share of the inputs required by hog operation, the hog/grain price ratio is a good indicator of how the sector is being affected. Although the ratio has not returned to levels observed historically, the increasing ratio shows an increasingly favourable situation since 2008 (Chart 2). This resulted in a more favourable expense-to-receipt ratio among hog type farms, from 0.92 in 2010 to 0.90 in 2015.
Among hog type farms, the situation differed between contract operations and non-contract operations. Contract hog type operations (ones that grow hogs under contract for other operations) had the most favourable expense-to-receipt ratio among hog operations at 0.79. This method of production provides farmers with some insurance against price volatility. By knowing their costs of production, farmers can negotiate an amount that will account for variable and fixed costs incurred during the contract period.
By comparison, non-contract hog type operations had a less favourable ratio at 0.88. This reflects some of the decisions made by farmers in the sector in order to adapt to evolving markets.
The ratio for beef and feedlot type farms became more favourable at 0.90 in 2015, compared with 0.93 in 2010. An increase in beef cattle prices received by farmers between 2010 and 2015 contributed to this ratio enhancement (Chart 3).
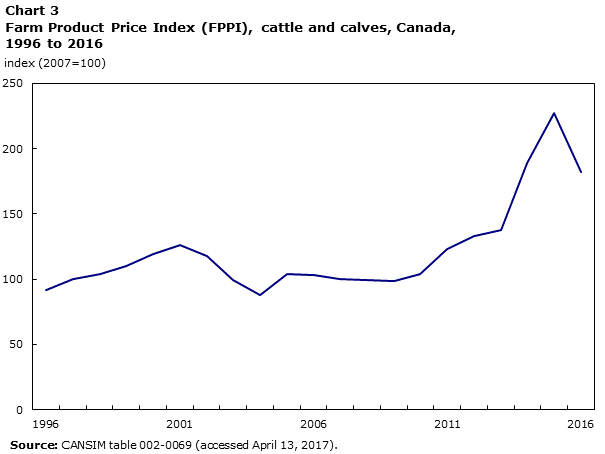
Data table for Chart 3
| Year | Index (2007=100) |
|---|---|
| 1996 | 91.5 |
| 1997 | 100.1 |
| 1998 | 103.8 |
| 1999 | 110.1 |
| 2000 | 118.9 |
| 2001 | 126.0 |
| 2002 | 117.8 |
| 2003 | 99.5 |
| 2004 | 88.0 |
| 2005 | 104.0 |
| 2006 | 103.4 |
| 2007 | 100.0 |
| 2008 | 99.5 |
| 2009 | 98.2 |
| 2010 | 103.7 |
| 2011 | 123.4 |
| 2012 | 133.3 |
| 2013 | 137.6 |
| 2014 | 189.3 |
| 2015 | 227.6 |
| 2016 | 181.8 |
| Sources: CANSIM tables 002-0069 (accessed April 13, 2017). | |
Within beef type farms, the situation differed between cow-calf type operations and feedlot type operations. Feedlot type operations were purchasing calves at high prices in 2015, resulting in higher operating expenses. This resulted in a relatively higher ratio in 2015 for feedlot type operations at 0.96.
By comparison, the cost of inputs for cow-calf type operations did not increase as much since they did not have to purchase the majority of their herd, as it renews itself through natural reproduction. This difference resulted in a more favourable ratio for cow-calf farms at 0.83 in 2015, compared with 0.90 in 2010.
The largest reduction in the expense-to-receipt ratio was in British Columbia. This was, in part, tied to the significance of fruit and tree nut type farms in that province. The favourable exchange rate supported the growth in international exports of fruits, which increased receipts for this sector. Canadian exports of edible fruits and nuts totalled more than 300 million kg in 2015, representing an increase of 69.2% from 2010 (Canadian International Trade Database table 980-0008).
The fur sector, which represented an important share of receipts in Nova Scotia, contributed to the less favourable ratio observed provincially. A decrease in the demand for fur led to lower prices and receipts, resulting in farmers adapting to market conditions by downsizing their stock. The average value per pelt produced in Canada decreased by 57.4% (in current dollars) between 2010 and 2015 (CANSIM table 003-0014).
Farm types that were part of a supply-managed industry (dairy, poultry, egg and hatchery) continued to have a lower expense to receipt ratio than farms in other sectors. In 2015, the average ratio among supply-managed farm types was 0.79, compared with 0.84 for farm types that were not supply managed (Table 3). Nationally, the average ratio for all farm type was 0.83.
| Operation type | 2010 | 2015 |
|---|---|---|
| Expense-to-receipt ratio | ||
| Supply-managed | 0.77 | 0.79 |
| Non-supply managed | 0.84 | 0.84 |
| Total | 0.83 | 0.83 |
|
Note: Supply-managed operation types include dairy, poultry, egg and hatchery. Source: Census of Agriculture (3438). |
||
Since 2010, the expense-to-receipt ratio for farms under supply management became less favourable, while the ratio remained stable for non-supply managed farms. The increase in expenses paid per dollar of receipts earned in supply-managed sectors since 2010 was largely driven by dairy farms. By contrast, the ratio for poultry and egg farms remained stable during the same period.
Smaller farms are now spending less for every dollar earned
Farms with fewer receipts have reduced operating expenses per dollar of gross farm receipts compared with 2010 (Table 4). The ratio became more favourable for farms with less than $250,000 in receipts, while it became less favourable for farms with $250,000 or more in receipts.
Despite their ratios becoming less favourable between 2010 and 2015, farms with receipts between $250,000 and $1 million still spent the least in operating expenses for every dollar in receipts.
| Sales class | 2010 | 2015 |
|---|---|---|
| Expense-to-receipt ratio | ||
| $1 to $9,999 | 2.99 | 2.09 |
| $10,000 to $24,999 | 1.45 | 1.20 |
| $25,000 to $49,999 | 1.07 | 0.95 |
| $50,000 to $99,999 | 0.91 | 0.85 |
| $100,000 to $249,999 | 0.83 | 0.81 |
| $250,000 to $499,999 | 0.78 | 0.79 |
| $500,000 to $999,999 | 0.77 | 0.79 |
| $1,000,000 to $2,999,999 | 0.78 | 0.80 |
| $3,000,000 or more | 0.86 | 0.87 |
| Canada | 0.83 | 0.83 |
| Source: Census of Agriculture (3438). | ||
Farms with receipts in the millions are on the rise
Larger farms were responsible for a growing proportion of national receipts. While farms that reported $1 million or more in gross farm receipts accounted for 7.6% of all farms in 2016, their share of gross farm receipts increased to 60.3% in 2015.
In turn, the 1.5% of farms that had gross farm receipts in excess of $3 million accounted for more than one-third of receipts in 2015.
In Prince Edward Island, 12.1% of farms reported $1 million or more in gross farm receipts, the largest proportion among provinces. By contrast, British Columbia had the highest share of farms reporting less than $10,000 in receipts at 41.6%. This compared with 17.7% nationally.
Land and buildings value drives increase in farm capital values
The value of farm capital owned or rented by farmers totalled $509.7 billion in 2016, up 36.8% from 2011 (Table 5). This represented a median capital value of $1.1 million in 2016, an increase of 23.3% from 2011. This increase was largely driven by the total value of land and buildings as this category represented the biggest share of the capital at 84.0%.
| Category | Value of farm capital | 2011 | 2016 | ||
|---|---|---|---|---|---|
| 2011 | 2016 | % change | |||
| dollars (billions) | percent of totalTable 5 Note 1 | ||||
| Land and buildings | 311.2 | 427.9 | 37.5 | 83.5 | 83.9 |
| Machinery | 46.7 | 53.9 | 15.4 | 12.5 | 10.6 |
| Livestock | 14.7 | 27.9 | 89.4 | 4.0 | 5.5 |
| Total | 372.6 | 509.7 | 36.8 | 100.0 | 100.0 |
|
|||||
The value of capital owned or rented by farms with $1 million or more in gross farm receipts totalled $171.4 billion in 2016, up 61.4% from 2011. Meanwhile, the value of capital owned or rented by farms that had less than $1 million in gross receipts was $338.3 billion in 2016, up 27.0% since 2011. While these smaller farms accounted for less than half of all receipts at 39.7%, they comprised almost two-thirds of the total capital.
Farm type has a large impact on the value of land and buildings
Farmers continually invest in their land and buildings to aid gains in efficiency and productivity, which positively impact their values. Some examples of these investments are increasing grain storage facilities, installing tile drainage systems and land clearing.
The Census of Agriculture reported a 6.9% increase in cropland between 2011 and 2016 while areas not in production, including woodlands and wetlands decreased. Tile drainage systems, while an expensive investment, aid growth in yield and are a way farmers can insure themselves against adverse conditions. Investments in grain storage facilities reflects increasingly large harvests, resulting from increasing farm size and efficiency gains, and are a way to adapt to the challenges arising from transportation. These grain storage facilities also enable farmers to maximize their receipts by waiting for favourable market prices to sell their harvest.
The total value of land and buildings was $427.9 billion in 2016, yielding a median value of land and buildings of $916,000, which increased 25.1% since 2011. The average value per acre of agricultural land and buildings in Canada was $2,696, up 38.8% since 2011.
There is a correlation between the value of land and buildings on a per acre basis and the type of commodities produced. The farm types with the highest requirement for physical infrastructure, such as greenhouses or poultry operations, also have the highest value of land and buildings on a per acre basis (Chart 4). By comparison, farm types with a lower value per acre are those where the production is mostly crop-based or pasture land, therefore the value of the physical infrastructure is distributed over a larger quantity of land.
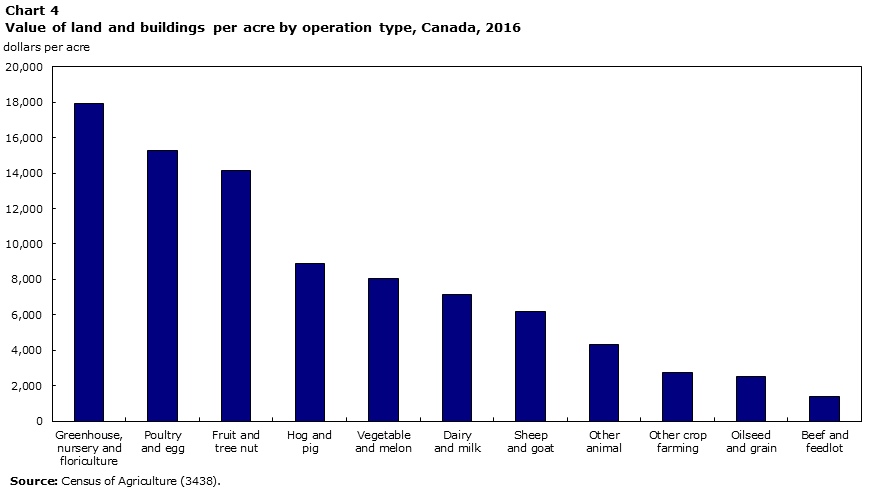
Data table for Chart 4
| Operation type | Dollars per acre |
|---|---|
| Greenhouse, nursery and floriculture | 17,912 |
| Poultry and egg | 15,298 |
| Fruit and tree nut | 14,171 |
| Hog and pig | 8,902 |
| Vegetable and melon | 8,062 |
| Dairy and milk | 7,162 |
| Sheep and goat | 6,173 |
| Other animal | 4,312 |
| Other crop farming | 2,729 |
| Oilseed and grain | 2,508 |
| Beef and feedlot | 1,406 |
| Source: Census of Agriculture (3438). | |
The regions where the average value of land and buildings reported were the highest, were for regions that are located near an urban centre (Map 1). In Canada, the highest average values of land and buildings were reported by regions that are located near the Lower Mainland of British Columbia, as well as Southern Ontario.
Map 1
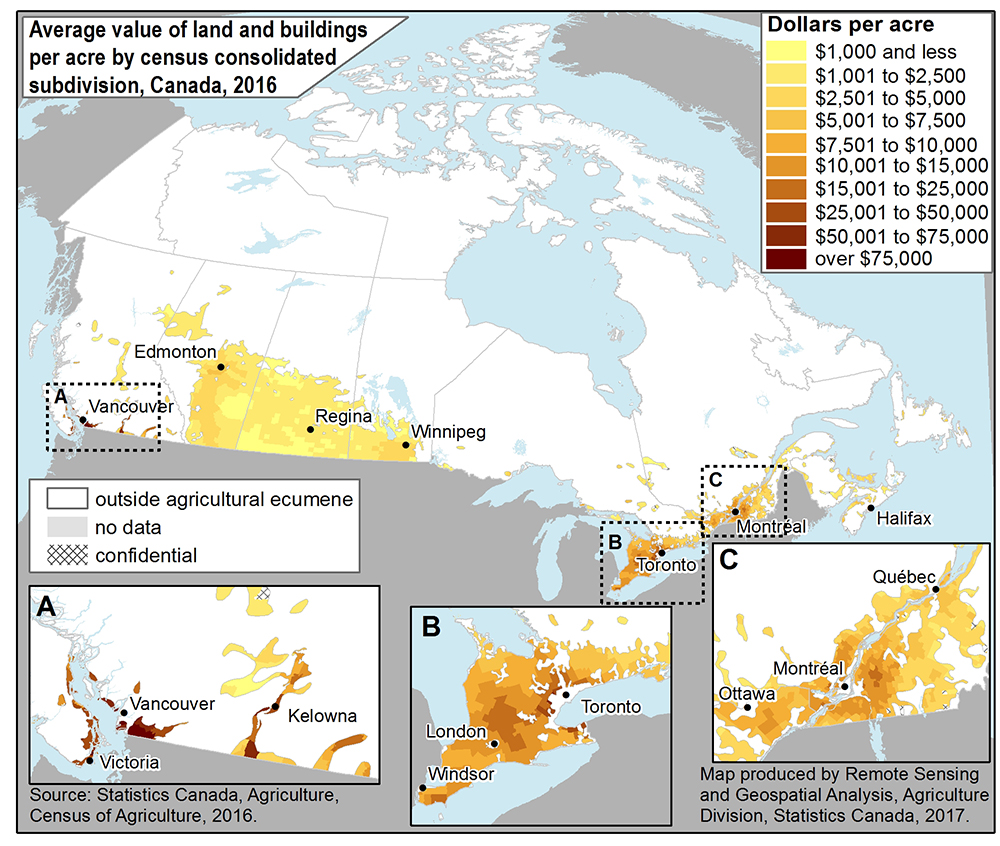
Description for Map 1
This is a map showing the average value of land and buildings per acre in 2016, by census consolidated subdivision, Canada, 2016
Legend
This table shows the category associated with the average value of land and buildings per acre in 2016 for each census consolidated subdivision.
Average value per acre category classifications are represented by different colours.
| Category | Dollars per acre | Colour |
|---|---|---|
| 1 | $1,000 and less | Light yellow |
| 2 | $1,001 to $2,500 | Light yellow-orange |
| 3 | $2,501 to $5,000 | Medium yellow-orange |
| 4 | $5,001 to $7,500 | Dark yellow-orange |
| 5 | $7,501 to $10,000 | Light orange |
| 6 | $10,001 to $15,000 | Medium orange |
| 7 | $15,001 to $25,000 | Dark orange |
| 8 | $25,001 to $50,000 | Medium red |
| 9 | $50,001 to $75,000 | Dark red |
| 10 | over $75,000 | Very dark red |
| 11 | no data | Light grey |
| 12 | confidential | hatched |
Regions outside the agricultural ecumene are displayed in white.
Provinces are outlined in a grey line.
An inset map has been provided to permit greater visibility for southern Ontario and Quebec.
Source
Statistics Canada, Agriculture, Census of Agriculture, 2016.
Map produced by Remote Sensing and Geospatial Analysis, Agriculture Division, Statistics Canada, 2017.
Larger tractors aid efficiency gains
While most farms own or lease equipment, some operators choose different ways to access machinery. Using custom or contract work allows farmers to access equipment and manage workloads. Other strategies include sharing equipment or separating the ownership of the machinery from the farm operation.
The average total value of machinery per farm was $278,405 in 2016, an increase of 22.7% since 2011. Oilseed and grain type farms had 58.4% of the total value of machinery in Canada in 2016.
The value of machinery per farm is highly dependent on the type of production. The Prairie Provinces, which are predominately crop-based operations, had the highest value of machinery per farm (Map 2). Some of the regions with the highest average value of machinery per farm were located in New Brunswick and Prince Edward Island, as a result of the concentration of farms growing crops, such as potatoes.
Map 2
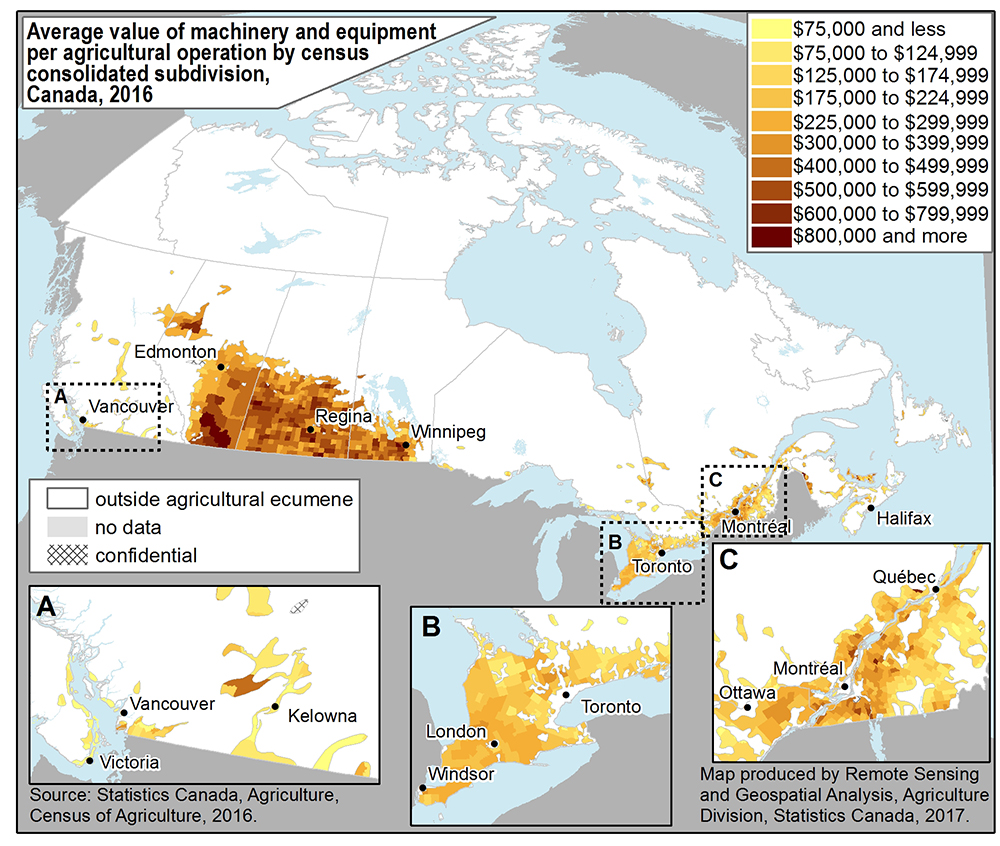
Description for Map 2
This is a map showing the average value of land and buildings per acre in 2016, by census consolidated subdivision, Canada, 2016
Legend
This table shows the category associated with the average value of land and buildings per acre in 2016 for each census consolidated subdivision.
Average value per acre category classifications are represented by different colours.
| Category | Dollars per agricultural operation | Colour |
|---|---|---|
| 1 | $75,000 and less | Light yellow |
| 2 | $75,001 to $124,999 | Light yellow-orange |
| 3 | $125,000 to $174,999 | Medium yellow-orange |
| 4 | $175,000 to $224,999 | Dark yellow-orange |
| 5 | $225,001 to $299,999 | Light orange |
| 6 | $300,000 to $399,999 | Medium orange |
| 7 | $400,000 to $499,999 | Dark orange |
| 8 | $500,000 to $599,999 | Medium red |
| 9 | $600,000 to $799,999 | Dark red |
| 10 | $800,000 and more | Very dark red |
| 11 | no data | Light grey |
| 12 | confidential | hatched |
Regions outside the agricultural ecumene are displayed in white.
Provinces are outlined in a grey line.
An inset map has been provided to permit greater visibility for southern Ontario and Quebec.
Source
Statistics Canada, Agriculture, Census of Agriculture, 2016.
Map produced by Remote Sensing and Geospatial Analysis, Agriculture Division, Statistics Canada, 2017.
One way that farmers can invest in their operations to help increase productivity is by investing in their machinery. Tractors are now becoming more efficient through technological and mechanical advancements. These newer and larger tractors enable farmers to do more with less. An indication of this is that in 2011 there were 7.9 tractors reported per 1,000 acres of cropland. In 2016, this ratio had decreased to 7.0. The total value of tractors over 149 power take-off horsepower (p.t.o. hp) grew 50.0% between 2011 and 2016, accounting for more than half of the total value of tractors (Table 6).
| Category | Value of tractors | 2011 | 2016 | ||
|---|---|---|---|---|---|
| 2011 | 2016 | % change | |||
| dollars (billions) | percent of totalTable 6 Note 1 | ||||
| Under 60 p.t.o. hp | 2.1 | 2.1 | 2.3 | 13.3 | 11.5 |
| 60 to 149 p.t.o. hp | 7.5 | 7.1 | -4.6 | 47.3 | 38.2 |
| Over 149 p.t.o. hp | 6.2 | 9.4 | 50.0 | 39.5 | 50.3 |
| Total | 15.8 | 18.6 | 17.9 | 100.0 | 100.0 |
Source: CANSIM table 004-0234. |
|||||
Value of livestock per acre is production dependant
The estimated value of livestock per acre is influenced by the type of production. The operations where the livestock is housed in buildings, such as dairy, hog and poultry operations, often have the highest value of livestock per acre as their total land area is often smaller.
For example, along the London Québec corridor, there is a prevalence of hog, dairy and poultry operations, which require elaborate infrastructure to house livestock (Map 3).
By comparison, in the Prairie Provinces the predominant livestock type farm is beef, which is often distributed over a large quantity of land, resulting in a lower value per acre. The areas portrayed as darker in southern Alberta represent a predominance of beef feedlot type farms, as is the case with hog and dairy operations in southern Manitoba. In southern British Columbia, in turn, the darker areas represent a concentration of dairy and poultry operations.
Map 3
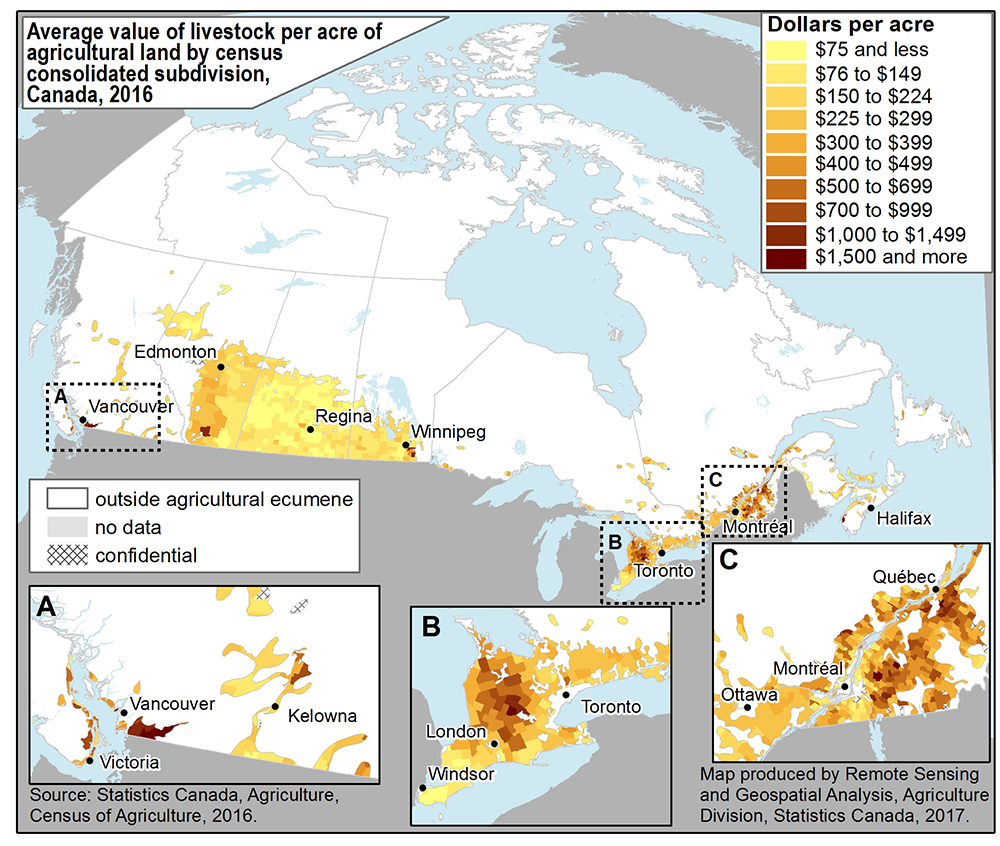
Description for Map 3
This is a map showing the average value of livestock per acre of agricultural land in 2016, by census consolidated subdivision, Canada, 2016
Legend
This table shows the category associated with the average value of livestock per acre of agricultural land in 2016 for each census consolidated subdivision.
Average value per acre category classifications are represented by different colours.
| Category | Dollars per acre | Colour |
|---|---|---|
| 1 | $75 and less | Light yellow |
| 2 | $76 to $124 | Light yellow-orange |
| 3 | $125 to $224 | Medium yellow-orange |
| 4 | $225 to $299 | Dark yellow-orange |
| 5 | $300 to $399 | Light orange |
| 6 | $400 to $499 | Medium orange |
| 7 | $500 to $699 | Dark orange |
| 8 | $700 to $999 | Medium red |
| 9 | $1,000 to $1,499 | Dark red |
| 10 | $1,500 and more | Very dark red |
| 11 | no data | Light grey |
| 12 | confidential | hatched |
Regions outside the agricultural ecumene are displayed in white.
Provinces are outlined in a grey line.
An inset map has been provided to permit greater visibility for southern Ontario and Quebec.
Source
Statistics Canada, Agriculture, Census of Agriculture, 2016.
Map produced by Remote Sensing and Geospatial Analysis, Agriculture Division, Statistics Canada, 2017.
Start of text box
Note to readers
Census Day was May 10th, 2016. Farmers were asked to report their receipts and expenses for the last complete fiscal or calendar year (2015). The reference year for all other variables mentioned in this article is 2016.
The expense-to-receipt ratio is the average amount incurred in operating expenses for a dollar in farm receipts. The ratio is calculated in current dollars. It uses operating expenses, which exclude capital expenses such as repayment of long term loans and amortization of tangible and intangible assets. A more favourable expense-to-receipt ratio indicates that farmers are now spending less in operating expenses per dollar in gross farm receipt (lower ratio). By comparison, a less favourable expense-to-receipt ratio indicates that farmers are now spending more in operating expenses for every dollar in gross farm receipts earned (higher ratio).
Price indices were used to obtain constant dollar estimates of receipts, expenditures and capital values in order to eliminate the impact of price change in year-to-year comparison.
Gross farm receipts and operating expenses in this article are in constant 2015 dollars calculated using the annual average for 2010 and 2015. The Farm Product Price Index (CANSIM table 002-0069) is used for the gross farm receipts for 2010, and the Farm Input Price Index (CANSIM table 328-0015) is used for the operating expenses for 2010.
Value of land, buildings and machinery in this article are in constant 2016 dollars calculated using the second quarter value for 2011 and 2016 from the Farm Input Price Index (CANSIM table 328-0015) for 2011 values. Livestock values from 2011 are in 2016 prices using the second quarter average for 2011 and 2016 from the Farm Product Price Index (CANSIM table 002-0068).
End of text box
References
CDC (Canadian Dairy Commission). November 2011. Cost of production – Final results based on 2010 survey data. Ottawa, Ontario.
CDC (Canadian Dairy Commission). July 2016. Cost of production – Draft results based on 2015 survey data. Ottawa, Ontario.
- Date modified: