Illustrated Glossary
Reference map
Definition
A reference map shows the location of the geographic areas for which census data are tabulated and disseminated. The maps display the boundaries, names and unique identifiers of standard geographic areas, as well as selected cultural and physical features, such as roads, railroads, coastlines, rivers and lakes.
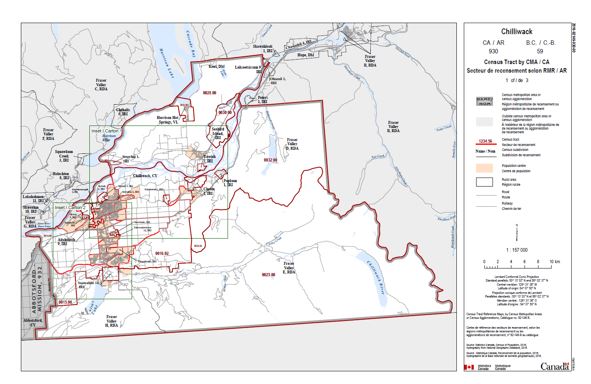
For more information on reference map, consult the Dictionary, Census of Population, 2016.
Reference and thematic map tutorial
A brief guide to reading maps
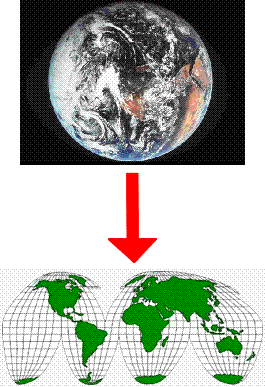
A map, like a picture, is worth a thousand words. A map is a simplified view of the earth's surface that shows where places and features are located and helps us communicate spatial information efficiently. In this section, you will learn more about maps and how to interpret them.
Statistics Canada produces two types of maps: reference maps and thematic maps.
Reference maps
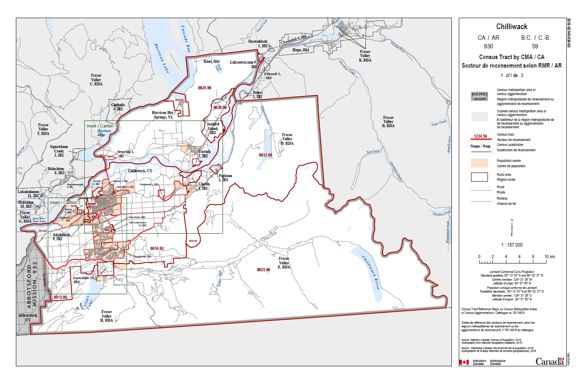
A reference map shows the location of geographic areas for which census data are tabulated and disseminated. The maps display the boundaries, names and unique identifiers of standard geographic areas, as well as selected cultural and physical features such as roads, railroads, coastlines, rivers and lakes.
Thematic maps
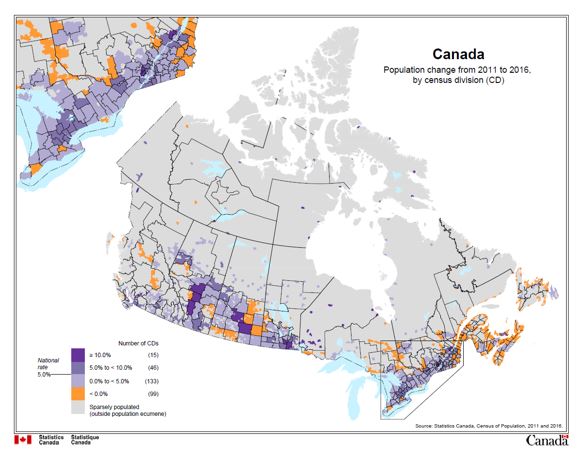
A thematic map shows the spatial distribution of one or more specific data themes for selected geographic areas. The map may be qualitative in nature (e.g., predominant farm types) or quantitative (e.g., percentage population change).

Map elements
There are five basic design elements that are usually included on a map.
- Title
- Legend
- Source
- Scale
- North arrow
Title
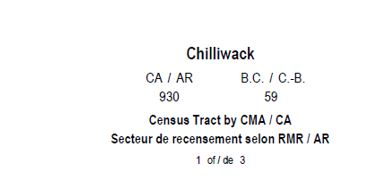
On a reference map, the title indicates the geographic area displayed. Titles are an important element of a map.
On a thematic map, the title indicates the geographic area displayed and information about the theme, including source, date and geographic level of data.

Legend
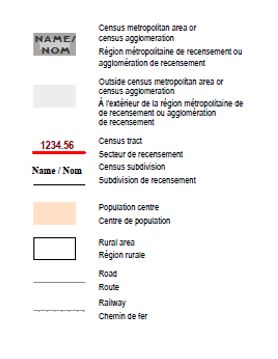
The legend is key to understanding the map and, together with the title, is an important element when interpreting a map. The map legend explains the meaning of symbols and colours used on the map.
Source
The source is a clear reference to the origin of the data portrayed on a map. Information about the data source contributes to understanding the map and facilitates further research into the topic of the map.

Scale
Scale shows how distance on the map relates to distance on the ground. It is a measurement of the amount of reduction that takes place going from real-world dimensions to the dimensions of a map displayed on a page or screen.
There are two common expressions of scale.
Representative fraction: 1:157 000
The representative fraction shows how many ground units are represented by a single map unit. In this case, one unit of distance on the map is equivalent to 157 000 of the same units on the ground. The ratio is universal and does not require the unit of measurement to be specified.
Graphic scale bar:

The graphic scale bar shows what a physical measurement on the map would be equivalent to on the ground. It provides a visual indication of the distances between map features. A graphic scale bar has the advantage of remaining true if the map is enlarged or reduced.
Small scale or large scale
Small-scale maps show more land coverage in less detail, for example 1:24,200,000.
Large-scale maps show less land coverage in greater detail, for example 1:10,000.
Sometimes, small-scale maps contain 'insets' at a larger scale to reveal details that are hidden by congestion in the main map.
North arrow
The north arrow points to the North Pole and provides an indication of the orientation of the map. If a north arrow does not appear on the map, north is assumed to be toward the top of the map.
- Date modified: