
Demographic Documents
Emigration of Immigrants: Results from the Longitudinal Immigration Database
Skip to text
Text begins
Acknowledgements
The authors would like to thank several colleagues for their contributions to this project. The first versions of this document benefitted from comments by René Houle, Tristan Cayn, Mélanie Meunier, Hubert Denis, Laurent Martel and colleagues at IRCC.
List of acronyms
CBSA = Canada Border Services Agency.
CCB = Canada Child Benefit.
CCTB = Canada Child Tax Benefit.
CRA = Canada Revenue Agency.
IMDB = Longitudnal Immigration Database.
IRCC = Immigration, Refugees and Citizenship Canada.
LAD = Longitudinal Administrative Databank.
NHS = National Household Survey.
RRC = Reverse Record Check.
T1FF = T1 Family File.
Brief description
This paper examines the emigration of immigrants using the Longitudinal Immigration Database (IMDB). An indirect definition of emigration is proposed that leverages the information available in the IMDB. This study found that emigration of immigrants is a significant phenomenon. Certain characteristics of immigrants, such as having children, admission category and country of birth, have a strong correlation with emigration.
Highlights
- Immigration is an increasingly important facet of Canada’s migration dynamics.
- According to the emigration criterion developed
in this study:
- 5.1% of immigrants admitted between 1982 and 2017 emigrated within five years of landing;
- This percentage rises to 17.5% 20 years after admission;
- Annual probabilities of emigrating peak three to seven years after admission.
- Several immigrant characteristics are linked to
emigration:
- Immigrants born in Taiwan, the United States, France, Hong Kong or Lebanon are more likely to emigrate. Conversely, those born in the Philippines, Vietnam, Sri Lanka or Jamaica are less likely to leave Canada;
- Immigrants who never had children in their tax family were substantially more likely to emigrate than those who had children. This effect remains strong when other factors are considered;
- Immigrants admitted to the country at age 65 or older and those with Nova Scotia as their intended province of destination are somewhat more likely to emigrate than those who landed at a younger age. However, these effects disappear when other factors associated with immigrant emigration are taken into account;
- Immigrants admitted in the investor and entrepreneur categories are more likely to emigrate, while those admitted in the caregiver and refugee categories are less likely to emigrate;
- Emigration follows a clear gradient based on level of education. Individuals with higher levels of education are more likely to migrate than less educated immigrants;
- Immigrants who held a non-permanent resident study permit prior to being admitted are especially likely to leave Canada. However, this results mainly from the fact that these immigrants present several characteristics associated with emigration, such as higher levels of education.
Introduction
Canada is generally perceived as a place of welcome for foreign nationals from around the world. It usually receives between 200,000 and 300,000 immigrants each year so that in 2021, more than one in five Canadians were born outside Canada (Statistics Canada 2022a). Immigration levels have been increasing in recent years. In 2022, Canada welcomed more than 400,000 immigrants, a record-high level that fuelled the strongest population growth observed since 1957 (Statistics Canada 2023). If recent demographic dynamics continue, the country’s population growth could continue to depend almost entirely on international migration in the coming decades (Statistics Canada 2022b).
However, the focus on immigration tends to obscure the opposite trend: emigration. Some studies report the especially high likelihood of immigrants to emigrate from Canada (Finnie 2006; Boudarbat and Connolly 2013). While some immigrants may have planned to leave Canada at some point, emigration may also attest to the difficulties many immigrants encounter in integrating into the Canadian labour market or society. Retaining immigrants is therefore an important issue when evaluating and developing immigration policies.
On the other hand, Canada’s international migration dynamics are changing. While immigrants primarily came from the United States and Europe in the first half of the 20th century, they now have increasingly diverse origins. In 2016, nearly two in three new immigrants came from Asia (Statistics Canada 2017). At the same time, temporary immigrationNote is trending upward and a growing number of temporary immigrants eventually get permanent residency (Lu and Hou 2017). These new demographic realities can affect immigrant emigration levels if, for example, immigrants from certain countries are more likely to emigrate than others.
While some characteristics associated with the emigration of immigrants are known, the underlying mechanisms are less clear. Many studies that examined the topic use aggregate techniques or report only descriptive results.Note While these approaches expand our understanding of the emigration of immigrants, they have their limitations.
This study contributes to filling this gap by examining the characteristics of immigrants associated with emigration. It also proposes a relatively robust measure of emigration based on information available in tax data. This study uses data from the Longitudinal Immigration Database (IMDB), which is used to longitudinally track immigrant cohorts admitted since the early 1980s to observe their emigration behaviour.
The next section provides context for the study and summarizes current knowledge on the topic. The data and methods used are then introduced. This section describes the criterion chosen to measure emigration. Subsequent sections present the descriptive results and the results of the regression analysis models, respectively.
1. Context
Immigration, Refugees and Citizenship Canada (IRCC) is the department responsible for admitting permanent residents. It sets annual immigration targets in consultation with the provinces and territories as well as different economic and social stakeholders. These targets account for factors such as social acceptability, the specific needs of provinces and territories, scientific research and international crises. Immigrants are then selected according to a number of criteria targeted to Canada’s immigration needs and objectives. IRCC also sponsors a number of activities, such as language training workshops, to help immigrants integrate into their community.
Despite these efforts, some immigrants decide to leave Canada to return to their country of origin or to move to another country. Over time, a number of authors have examined immigrant emigration. While these studies used different data sources and techniques to measure this, they generally suggest four findings. First, Canadian immigrants emigrate for a variety of reasons. Second, immigrant emigration is a significant trend that has persisted for many decades. Third, certain characteristics associated with emigration regularly resurface in many of these analyses. Fourth, immigrant emigration raises a number of issues for Canada. These elements are discussed in the subsections below.
1.1. Reasons for emigrating from Canada
Migration is very complex. Immigrants admitted to Canada may emigrate for a variety of reasons, which depend on both the situation in their country of origin and in Canada.
The difficulties some immigrants encounter in integrating economically in Canada may be a reason to emigrate. Barauch et al. (2007) report that adjusting to a new country of residence, family and labour market conditions are the main reasons that international students leave the United States and the United Kingdom. In the Canadian context, a lack of economic opportunities is the main reason cited by immigrants who left the country in the early 1970s (Motuz 1974). The challenges faced by immigrants in the Canadian labour market—particularly recent immigrants—are well documented.
These integration challenges are not limited to economic factors. Personal reasons, including the death of a loved one in the country of origin, the harsh climate and adjusting to Canada’s language and culture, can also push immigrants to emigrate (Motuz 1974). Older immigrants may also return to their country of origin to retire (Cobb-Clark and Stillman 2013).
Emigration can be an integral part of an immigrant’s migration strategy. The rise of communication and transportation technologies facilitates transnationalism, i.e., maintaining residences or important family ties in more than one country and alternating between different countries of residence based on economic incentives and changing family ties (Fong 2012). Many immigrants from Hong Kong may have adopted this strategy. They sometimes alternate between Hong Kong and Canada to capitalize on Hong Kong’s economic conditions and Canada’s quality of life (Ley and Kobayashi 2005). In addition, some immigrants may plan to emigrate from Canada as soon as they are admitted. Motuz (1974) reports that almost half of immigrants who emigrated in the early 1970s had originally planned to leave Canada.
1.2. Levels of immigrant emigration
The emigration of immigrants has been a significant, ongoing phenomenon for many decades. Most studies that calculated the number of emigrants among immigrants used residual techniques, which consist in isolating emigration in the demographic equation, usually using census data. Despite broadly similar techniques, results are not always fully comparable, mostly because they examine different periods or use different methodologies to measure other demographic events. However, despite their limitations, these studies offer insight into the evolution of immigrant emigration from the second half of the 20th century to recent years.
Beaujot and Rappak (1989) applied residual techniques to census data and immigration files to measure emigration among immigrant cohorts admitted from the end of World War II until 1981. They found that the overall departure rate for cohorts who arrived between 1946 and 1970 was about 30% in 1981. Immigrant emigration is particularly high a few years after admission and tends to decrease thereafter. This study reports sometimes substantial variations in emigration rates for the cohorts examined. Emigration was higher among cohorts admitted in the 1960s than those admitted in the 1950s or 1970s. According to the authors, these variations essentially result from differences in the composition of immigration cohorts.
Motuz (1974) also highlighted an increase in immigrant emigration in the 1960s. He calculated that just over 400,000 immigrants who landed between 1961 and 1971 left the country between the 1961 and 1971 censuses. This number represents 27.5% of immigrants admitted to Canada during this period, a higher proportion than for the 1951 to 1961 period (23%).
Michalowski (1991) suggests that immigrant emigration decreased in the early 1980s from the levels reported by Motuz in the 1960s. She calculated that a total of 144,000 immigrants emigrated between 1981 and 1986, or roughly 29,000 per year. The emigration rate for immigrants admitted between 1981 and 1986 was approximately 10%, a proportion much lower than reported in previous studies.Note
The emigration of immigrants appears to have increased in the 1990s. Chen (2009) found that just over 132,000 working-age immigrants emigrated between 1996 and 2006, averaging 13,200 per year. Emigration rates for cohorts admitted between 1990 and 1995 were significantly higher than for previous cohorts. This period corresponds to a time when emigration, especially to the United States, was particularly high.Note Because this study only targets immigrants aged 21 to 55, the numbers produced tend to be lower than those of other authors.
Since the start of the millennium, immigrant emigration appears to have continued to rise. Lebel (2015) calculated that approximately 150,000 immigrants emigrated between 2001 and 2006, which is similar to the figures produced by Michalowski (1991) for 1981 to 1986. Lebel (2015) calculated that almost 250,000 immigrants left Canada between 2006 and 2011, a significant increase from the previous intercensal period.
More recently, other data sources have enriched our understanding of immigrant emigration. Aydemir and Robinson (2006) also used the IMDB to examine this, calculating that between 1982 and 2002, 35% of working-age male immigrants emigrated within 20 years of admission. Of special note, the study found that about 60% of immigrants who emigrated did so in their first year in the country.Note
Despite the limited comparability and methodology of these studies, they generally reveal that since World War II, immigrant emigration increased in the 1960s, fell in the 1970s, and then gradually increased in the 1980s and 1990s. The emigration of immigrants appears to have waned at the start of the 20th century and then picked up again between 2006 and 2011.
1.3. Characteristics of immigrants who emigrate
In addition to providing information on immigrant emigration levels, a number of studies on this topic have identified different characteristics associated with this phenomenon. Some of these characteristics emerge in many studies while others were observed in only a few analyses. They reflect the plurality of life situations among immigrants who settle in, and then emigrate from, Canada and the limitations of different studies.
Immigrant age is often associated with emigration. However, the groups more likely to emigrate differ from study to study. On the one hand, some studies report that young adults in their thirties are more likely to emigrate (Lebel 2015; Chen 2009). These ages are traditionally associated with major life transitions, such as leaving school, entering the workforce and migration. In this context, these immigrants may be more inclined to migrate a second time, either to return to their country of origin or move to another country.
On the other hand, other analyses suggest that older immigrants are more likely to emigrate (Beaujot and Rappak 1989; Lam 1994). In this regard, Lam (1994) suggests that older immigrants may face additional challenges in integrating into Canada, potentially increasing their propensity to emigrate compared with younger cohorts. Some older immigrants also emigrate to retire, often in their country of origin (Cobb-Clark and Stillman 2013).
Male immigrants are slightly more likely to emigrate (Lam 1994; Chen 2009). Among working-age male immigrants, married immigrants stay in the country longer than other immigrants (Aydemir and Robinson 2006).
Another important correlate of emigration is the immigrants’ country of origin. Immigrants come from countries that are culturally, politically and economically very different. Their experience prior to admission to Canada, and the circumstances of their landing, can significantly influence their demographic behaviour once in the country. Several studies show higher emigration rates for immigrants from the United States and European countries, such as France and the United Kingdom (Beaujot and Rappak 1989; Motuz 1974; Michalowski 1991). These countries are economically developed and politically stable and can therefore offer their nationals settled in Canada attractive opportunities to return.
More recently, immigrants born in Hong Kong or Taiwan are also more likely to leave Canada (Chen 2009; Lebel 2015). Ley and Kobayashi (2005) studied the phenomenon for Hong Kong. This region experienced a period of major geopolitical upheaval in the 1980s and 1990s following its retrocession to China. At the same time, immigration to Canada increased. The authors suggest that when the political climate stabilized, some immigrants may have decided to return to live in Hong Kong. Taiwan also experienced a period of political turmoil during the same period. Emigration may have been part of the initial migration strategy of many immigrants from these two territories given the specific context of their settlement in Canada.
In contrast, emigration by immigrants from India or Vietnam is lower (Chen 2009; Lebel 2015). Vietnamese immigration to Canada was profoundly marked by the arrival of refugees after the end of the Vietnam War. These refugees were less likely to emigrate given the circumstances surrounding their arrival in Canada.
Several other socioeconomic characteristics of immigrants also correlate with emigration. Various studies indicate that immigrants who emigrate generally have characteristics associated with higher levels of human capital such as higher incomes or higher levels of education (Lam 1994; King and Newbold 2007). Immigrants admitted in economic categories are also more likely to emigrate (Dryburgh and Hamel 2004). Immigrants in these categories planning to work as doctors, health sector managers, or information technology workers have an especially strong propensity to emigrate. Immigrants in economic categories are highly attracted to the economic opportunities available to them, not only in Canada but also in other countries.
Lam (1994) observed that immigrants unable to hold a conversation in English or French are more likely to emigrate. Since learning an official language is an important driver of economic and social integration, this situation may reflect the particular difficulties these immigrants face when they settle in Canada. In contrast, Aydemir and Robinson (2006) noted that bilingual French-English or French-speaking immigrants are more likely to emigrate.
1.4. A few issues related to immigrant emigration
Immigrant emigration raises a number of demographic and socioeconomic issues.
Emigration naturally reduces the number of immigrants settled in Canada. Consequently, it may affect the achievement of immigration targets developed by IRCC.
The characteristics of immigrants who emigrate are generally different from those who remain in Canada or from the rest of the population. This situation contributes to alter the profile of the Canadian population, which in turn has consequences for the country’s economic and social development. For example, because immigrants generally have a higher level of education than the Canadian-born population, the departure of this highly skilled labour can have a certain negative impact on the country’s economic growth (OECD 2015).
The departure of some immigrants may reflect the challenges they faced in integrating into Canada’s labour market and society. The barriers faced by immigrants in the labour market are widely documented. In this regard, immigrant emigration can be seen in part as a correlate their integration into Canada.
The Canadian government has responsibilities to its citizens living abroad, whether by birth or by naturalization. The costs associated with these services sometimes raise questions. For example, in 2006, the Canadian government is said to have spent $94 million to evacuate 15,000 Canadian citizens from Lebanon due to the armed conflict. This situation provoked reaction from various quarters of Canadian society (Chant 2006). More recently, the calls by the government to Canadians abroad to return home at the beginning of the pandemic and the conflict in Afghanistan are reminders of the responsibilities of the Canadian government to its citizens living abroad. Given that naturalization rates are high among immigrants, and that they have a higher propensity to emigrate than the native-born population (Finnie 2006), they are likely overrepresented in the number of Canadian citizens residing abroad.
2. Data and methods
This section presents the database, the definition of emigration, and the analytical methods used for this study.
2.1 Longitudinal Immigration Database
This study uses data from the IMDB, 2020 version. This database is the result of an ongoing collaboration between Statistics Canada and IRCC to create a comprehensive, detailed longitudinal file to shed more light on immigrant behaviour.Note The IMDB combines administrative data from IRCC on the number of immigrant landings and temporary resident permits issued with annual tax data from the Canada Revenue Agency (CRA). Other data sources have also been added to the IMDB. For this study, vital statistics on deaths were used to supplement tax data to identify immigrants who had died in Canada.
The immigration data date back to 1980 while the linked tax return data start in 1982. The IMDB is updated annually through record linkages to add new information from IRCC and the CRA.
2.1.1. Immigrant admission data
Immigrant admission data include the admission date and various immigrant characteristics such as date of birth and admission category. Temporary resident data were included to help determine whether an immigrant was a non-permanent resident (NPR) Note prior to admission and the type of permit they had. IRCC has admission data for all immigrants and NPRs who enter the country through the regular legal process.
One limitation of admission data is that the available characteristics reflect the situation of immigrants at the time of admission. However, many characteristics, such as knowledge of official languages or level of education, can change after landing, and sometimes quickly.
2.1.2. Annual tax returns
The tax data used to create the IMDB come from the T1 Family File (T1FF). These data contain individual T1 files, T4 tax files, and Canada Child Tax Benefit (CCTB) files for each year. The T1FF notably includes information on the province of residence and the marital status of the population.Note
2.1.3. Vital statistics on deaths
Provincial and territorial vital statistics offices collect information on all deaths in Canada. Coverage of these data is very high, as provincial and territorial vital statistics legislation (or the equivalent legislative instruments) makes it mandatory to register all deaths that occur in a province and territory. Prior to 2010, some data were also collected on Canadian residents who died in certain American states.
2.2. Measuring emigration using the IMDB
Emigration is a very difficult demographic event to measure accurately. Canadians who emigrate are not required to report their departure, making it very difficult to track them in different Canadian data sources (Bérard-Chagnon 2018). As a result, as noted earlier, studies that examine immigrant emigration often have to rely on indirect methods and many assumptions.
2.2.1. Definition of emigration in this study
For this study, the definition of emigration was developed based on information available in the IMDB. Immigrants are identified as emigrants if they have permanently stopped filing a tax return. This definition was preferred over the exclusive use of departure dates available in tax returns, which significantly underestimate emigration levels (Bérard-Chagnon 2018).
Immigrants who do not file a tax return are not necessarily emigrants. Additional criteria were developed to better identify emigrants among these immigrants. Immigrants who have permanently stopped filing a tax return are considered emigrants if they:
- were 18 years of age or older at the time of admission;
- have not died since landing;
- filed a tax return at least once after their admission;
- stopped filing a tax return for at least three consecutive years;
- are assumed not to be non-tax filers.
The age criterion was set because of the very low coverage of children in tax returns (Bérard-Chagnon 2008).
Dates of death were derived from tax and vital statistics data. The estate of a deceased tax filer must register the date of death when filing the deceased person’s last tax return. Approximately 90% of deceased persons in tax data were successfully linked to vital statistics death records (Shumanty 2017). Consistency in years of death between the two sources is therefore very high. In the rare cases where the two sources indicated a different year, vital statistics information was given preference because it is a direct measure of the event and because registration of all deaths is mandatory in Canada.
This study is limited to immigrants who completed at least one tax return after admission and who were matched by the IMDB team. This decision was made to ensure that immigrants had indeed settled in Canada before leaving and to avoid classifying immigrants who could not be linked by the IMDB as emigrants. This criterion may omit the departure of some immigrants who never filed a tax return after landing. IMDB data indicate that over 90% of immigrants admitted between the ages of 25 and 64 were matched. The rate is 78.1% for immigrants aged 65 or older at the time of admission (Evra and Prokopenko 2021).
This criterion differs from that used by Aydemir and Robinson (2006). They considered all immigrants not found in tax data to be emigrants. The approach used in this study is believed to be more realistic considering that some immigrants residing in Canada could not be matched to tax data or do not file tax returns for various reasons. A small number of immigrants did not complete a tax return after they were admitted to the country but did so while they were NPRs. These immigrants were excluded given that the study focuses on emigration after admission to permanent residency.
Some immigrants stopped filing tax returns a few years before the end of the study period (2017). These immigrants were deemed to be emigrants only if three consecutive years had passed since they last filed a tax return. The only exception to this rule is if they reported a departure date in their last tax return. The three-year criterion was chosen to minimize the risk that the respondent was either a late tax filer or a non-tax filer, rather than an emigrant. In this regard, given that immigrants, especially those recently admitted, are less likely to file a tax return (Aydemir and Robinson 2006), their absence from tax data does not necessarily indicate they have left Canada.
Some of these tax filers permanently stop filing a tax return while still residing in Canada. In this study, two groups were identified as especially likely to be in that situation:
- Immigrant women aged 19 to 45 if:
- their admission groupNote comprised more than one person;
- they are the only ones among their admission group who stop filing a tax return.
- Immigrants 65 years of age or older if they:
- were admitted to Canada at the age of 55 or older;
- are the only members of their admission group to stop a filing tax return;
- stopped filing a tax return within the first ten years of being admitted.
In the first case, these immigrant women, who are of child-bearing age, are assumed to have stopped working to stay home to care for family members. This assumption is based more specifically on the fact that the employment rates of immigrant women are not only lower than those of immigrant men, but also lower than those of Canadian-born women (Yssaad and Fields 2018).
In the second case, these immigrants are not eligible to receive the Canada Old Age Security pension. To qualify for this pension, individuals must be 65 years of age or older and must have resided in Canada at least ten years after age 18. For this reason, they have less incentive to file tax returns.
The following table illustrates the application of this definition using a few fictitious examples for the 2010 cohort. Depending on the definition chosen, the last possible year of emigration is 2017, two years before the last year included in the IMDB, i.e., 2019 (criterion of three consecutive years without filing a tax return).
| Immigrant | 2010 | 2011 | 2012 | 2013 | 2014 | Emigrant? |
|---|---|---|---|---|---|---|
| A | 0 | 0 | X | X | X | No |
| B | X | 0 | 0 | 0 | X | No |
| C | X | X | 0 | 0 | 0 | Yes |
| D | 0 | X | X | XD | 0 | Yes |
| E | X | X | X | 0 | 0 | No |
| F | 0 | 0 | 0 | 0 | 0 | Out of scope |
|
X = tax return filed with no date of departure. XD = tax return filed with a date of departure. 0 = no tax return. Source: Statistics Canada, Centre for Demography. |
||||||
Immigrants A and B are not deemed to have emigrated; although they did not file a tax return for a few years, they eventually did. Immigrant C is classified as an emigrant because he/she permanently stopped filing a tax return for three consecutive years. Immigrant D is also classified as an emigrant because, although he/she did not stop filing a tax return for three consecutive years, he/she entered a date of departure on their last return. Immigrant E is not deemed to be an emigrant because he/she have not filed a tax return for only two years, not the required three years. Finally, immigrant F is not included in this study because he/she had never filed a tax return since landing or was not matched by the IMDB team.
2.2.2. Limitations of the chosen definition
While the definition chosen for this study makes it possible to measure immigrant emigration indirectly, its limitations cannot be overlooked.
Only immigrants who have left the country and not returned as of the 2020 version of the IMDB, according to the established criteria, are considered emigrants. Therefore, the definition used in this study only captures “permanent emigration” and omits immigrants who left and subsequently returned to Canada. For this reason, the emigration levels obtained here are substantially lower than the true emigration rates of immigrants. However, immigrants who emigrate are much less likely to return to reside in the country than the Canadian-born population (Finnie 2006) and thus the impact on this study is considered to be minor.
The IMDB begins with the immigrant cohort admitted in 1980, the IMDB tax data do not begin until 1982. The first two cohorts were therefore excluded from the analysis. The 2018 and 2019 immigration cohorts were also excluded from the study because they arrived too recently in the country to properly measure emigration according to the definition used. Although the 2020 version of the IMDB was used, the 2020 fiscal year was not included in this analysis due to the particular nature of that year and the impact the COVID-19 pandemic had on the schemes of international migration (Statistics Canada 2020). Those particularities and their impacts on emigration would require more in-depth analysis and would have been diluted in the large number of cohorts used in the present analysis.
While the definition used in this study has some limitations, the results it yields are consistent with those of other sources. Appendix A presents a few analyses conducted to evaluate this approach.
2.3. Methodology
The fact that the IMDB data are longitudinal allows for the tracking of immigrant residency trajectories over time. Note that the IMDB does not provide information on emigration in continuous time but rather in discrete time. Emigration is observed indirectly based on annual tax returns and not at the exact moment of departure.
First, survival curves are estimated using the life table method.Note Widely accepted in demography, this technique captures the length of time between an immigrant’s landing and emigration, if applicable. Emigration rates were first calculated for each year after landing. These rates take into account that some immigrants have died and thus are no longer at risk of emigrating. Emigration rates are then successively applied to a fictious cohort of immigrants to obtain a number of emigrants for each year after landing. Emigration probabilities are calculated by comparing the number of emigrants in the fictitious cohort for a given year with the population of the fictitious cohort at risk of emigrating (i.e., the population in the life table of the previous year).
Survival curves by immigrant characteristic are reported according to the percentage of immigrants with a given characteristic who emigrated 5, 10 and 20 years after their admission.Note Note that the majority of IMDB immigrant cohorts examined in this study had been in Canada for less than 25 years. For this reason, except for the overall results, it is deemed preferable to limit the analysis to 20 years after admission.
Logistic regression models are then constructed to estimate the probabilities of emigration based on immigrant characteristics. Every year that an immigrant spends in the population at risk of emigrating corresponds to an observation. This approach allows a discrete estimate of the propensity to emigrate based on the characteristics examined in the study for an individual still in the at-risk population.
2.3.1. Statistical significance thresholds
Logistic regression models are constructed using several million observations. Given the size of the database, the usual thresholds of statistical significance, such as p-values, were less appropriate for identifying characteristics more closely correlated with emigration (Sullivan and Feinn 2012; Ferguson 2009).
To overcome this limitation, this study uses the thresholds proposed by Sullivan and Feinn (2012) to determine immigrant charactertistics that are significantly correlated with emigration. These thresholds were derived from the effect size of odds ratios proposed for social sciences. An effect is considered statistically significant if the odds ratio is greater than 1.50 (or less than 0.67). An odds ratio between 1.50 and 2.00 (or between 0.50 and 0.67) is considered a small effect, while an odds ratio between 2.00 and 3.00 (or between 0.33 and 0.50) is considered a moderate effect, and an odds ratio greater than 3.00 (or less than 0.33) is considered a strong effect.
Bear in mind that these thresholds are subjective and should be interpreted with caution, considering the context of the study and the IMDB’s limitations. Furthermore, because the IMDB includes all immigrants admitted to the country since 1982, the thresholds chosen here are used primarily to guide the interpretation of the results rather than infer conclusions from a sample about the entire population.
In addition, as suggested by Bijak (2019), the 95% confidence intervals of the odds ratios are also presented to account for the uncertainty of the regression model parameters.
3. Emigration of immigrants
This section presents the results of the descriptive analysis. It is divided into two parts. It begins by presenting immigrant emigration levels by year after admission for all immigrants and by admission cohort. It then examines immigrant emigration based on different characteristics available in the IMDB.
3.1. Emigration of immigrants levels and trends
The following chart illustrates the probability of emigrating in each year after landing. Note that these results were obtained using life tables.

Data table for Chart 1
| Year since admission | percent |
|---|---|
| 0 | 0.8 |
| 1 | 1.0 |
| 2 | 1.0 |
| 3 | 1.1 |
| 4 | 1.3 |
| 5 | 1.3 |
| 6 | 1.2 |
| 7 | 1.0 |
| 8 | 1.0 |
| 9 | 0.9 |
| 10 | 0.8 |
| 11 | 0.8 |
| 12 | 0.7 |
| 13 | 0.7 |
| 14 | 0.7 |
| 15 | 0.7 |
| 16 | 0.7 |
| 17 | 0.7 |
| 18 | 0.6 |
| 19 | 0.7 |
| 20 | 0.7 |
| 21 | 0.6 |
| 22 | 0.6 |
| 23 | 0.6 |
| 24 | 0.6 |
| 25 | 0.6 |
| 26 | 0.6 |
| 27 | 0.5 |
| 28 | 0.5 |
| Source: Statistics Canada, Longitudinal Immigration Database. | |
The main finding emerging from the analysis of the probability of emigrating is that immigrants are much more likely to emigrate within the first few years after admission. The annual probability of emigrating reaches the highest level from three to seven years after admission, and peaks at almost 1.4% in the fourth and fifth years after admission. Thereafter, the annual probability of emigrating falls and holds steady at 0.6% to 0.7%. These findings echo those of other studies on this topic, i.e., that recent immigrants are more likely to emigrate than are immigrants from older cohorts.
A few assumptions can be made to explain the peak observed four and five years after admission.
First, this period may reflect the length of time that immigrants try to integrate into Canada. They attempt to find a job, a place to live, and to adapt to life in Canada. After a few years in the country, some may decide to emigrate, for example, because of challenges related to integrating into the labour market.
This finding may be partially due to the acquisition of Canadian citizenship as well. Before 2017, the period covered by this study, an immigrant who wanted to become a Canadian citizen had to remain in Canada 183 days per year in four of the six years preceding the citizenship application.Note Since Canadian citizenship is associated with a number of benefits, such as the possibility of returning to Canada at any time and receiving assistance from the Canadian government in the event of an emergency abroad, obtaining citizenship may be part of the migration strategy of some of these immigrants (Chant 2006). However, while annual rates peak at this time, they remain below 2%.
The following chart shows the cumulative probability of emigrating since landing.

Data table for Chart 2
| Year since admission | Percent |
|---|---|
| 0 | 0.0 |
| 1 | 0.8 |
| 2 | 1.8 |
| 3 | 2.7 |
| 4 | 3.8 |
| 5 | 5.1 |
| 6 | 6.4 |
| 7 | 7.5 |
| 8 | 8.6 |
| 9 | 9.6 |
| 10 | 10.5 |
| 11 | 11.3 |
| 12 | 12.1 |
| 13 | 12.8 |
| 14 | 13.6 |
| 15 | 14.3 |
| 16 | 14.9 |
| 17 | 15.6 |
| 18 | 16.2 |
| 19 | 16.9 |
| 20 | 17.5 |
| 21 | 18.2 |
| 22 | 18.8 |
| 23 | 19.4 |
| 24 | 20.0 |
| 25 | 20.6 |
| 26 | 21.2 |
| 27 | 21.7 |
| 28 | 22.3 |
| Source: Statistics Canada, Longitudinal Immigration Database. | |
Naturally, the trajectory of the cumulative probability curve reflects that of the annual probability just presented. Five years after admission, just over 5% of immigrants have emigrated. This probability increases to more than 10% a decade after admission. Slightly more than one in five immigrants have emigrated 25 years after their admission to Canada based on the IMDB and this study’s definition. These results indicate that while emigration of immigrants is quite low annually, it becomes a relatively significant phenomenon over the long term.
The following chart breaks down the cumulative probability of emigration by admission cohort.

Data table for Chart 3
| Admission year | After 5 years | After 10 years | After 20 years |
|---|---|---|---|
| percent | |||
| 1982 | 7.9 | 3.1 | 4.7 |
| 1983 | 5.7 | 3.1 | 5.1 |
| 1984 | 5.0 | 3.7 | 4.9 |
| 1985 | 4.9 | 4.1 | 4.8 |
| 1986 | 4.8 | 3.9 | 4.6 |
| 1987 | 4.8 | 4.5 | 4.8 |
| 1988 | 5.0 | 5.6 | 5.2 |
| 1989 | 5.5 | 5.4 | 5.3 |
| 1990 | 5.4 | 5.7 | 5.8 |
| 1991 | 5.2 | 5.4 | 5.7 |
| 1992 | 5.4 | 5.3 | 5.7 |
| 1993 | 5.6 | 5.2 | 6.1 |
| 1994 | 6.2 | 5.8 | 6.6 |
| 1995 | 5.6 | 5.4 | 6.7 |
| 1996 | 5.6 | 5.4 | 7.1 |
| 1997 | 5.4 | 5.2 | 7.9 |
| 1998 | 4.8 | 4.7 | 0.0 |
| 1999 | 4.9 | 5.0 | 0.0 |
| 2000 | 4.5 | 4.8 | 0.0 |
| 2001 | 4.5 | 4.9 | 0.0 |
| 2002 | 4.9 | 4.8 | 0.0 |
| 2003 | 4.5 | 4.7 | 0.0 |
| 2004 | 4.6 | 4.7 | 0.0 |
| 2005 | 4.3 | 4.8 | 0.0 |
| 2006 | 4.5 | 5.1 | 0.0 |
| 2007 | 4.4 | 6.1 | 0.0 |
| 2008 | 4.6 | 0.0 | 0.0 |
| 2009 | 4.4 | 0.0 | 0.0 |
| 2010 | 4.3 | 0.0 | 0.0 |
| 2011 | 4.1 | 0.0 | 0.0 |
| 2012 | 5.0 | 0.0 | 0.0 |
| Total | 5.1 | 5.3 | 7.1 |
|
Notes: Cohorts starting in 2013 do not yet have five years of residency in the IMDB at the time of the writing of this study. For this reason, they are excluded from this chart. The data presented are cumulative such that the sum of the blue and orange bars reflects the cumulative probability of emigration after 10 years. Source: Statistics Canada, Longitudinal Immigration Database. |
|||
The propensity to emigrate fluctuates moderately by admission cohort. In general, immigrant emigration is somewhat higher for cohorts admitted in the late 1980s and the first half of the 1990s. Just over 15% of immigrants in these cohorts emigrated within 20 years after admission.
Cohorts admitted since 2000 have a slightly lower level of emigration than those admitted in previous years, which is fairly constant over time. Among these cohorts, nearly 5% of immigrants emigrated within 5 years after admission and about 10% within ten years after admission.
Different composition effects related to immigrant characteristics and the context in which immigrants are admitted to Canada can affect the propensity to emigrate. The subsections that follow examine the characteristics associated with emigration to shed light on this situation.
3.2. Emigration of immigrants by country of birth
The literature establishes the relationship between the immigrants’ country of origin and their propensity to emigrate from Canada. The IMDB data presented in the following chart confirms this association by examining emigration by country of birth for the 20 most common countries between 1982 and 2017.Note

Data table for Chart 4
| Country of birth | After 5 years | After 10 years | After 20 years |
|---|---|---|---|
| percent | |||
| Morocco | 4.8 | 5.4 | 8.9 |
| Taiwan | 7.1 | 13.0 | 17.4 |
| Jamaica | 2.2 | 2.4 | 4.4 |
| France | 14.1 | 9.9 | 10.7 |
| Romania | 3.6 | 3.8 | 9.8 |
| Former Yugoslavia | 3.5 | 3.1 | 4.6 |
| Lebanon | 7.8 | 10.5 | 8.6 |
| South Korea | 5.1 | 7.3 | 9.7 |
| Poland | 3.9 | 3.0 | 4.0 |
| Viet Nam | 2.3 | 1.8 | 2.1 |
| United States | 16.7 | 10.8 | 12.5 |
| Sri Lanka | 2.0 | 1.5 | 2.2 |
| United Kingdom | 9.9 | 6.2 | 7.4 |
| Iran | 4.5 | 5.4 | 8.1 |
| Former USSR | 3.1 | 3.4 | 5.2 |
| Hong Kong | 7.8 | 12.3 | 10.0 |
| Pakistan and Bangladesh | 3.9 | 4.4 | 9.2 |
| Philippines | 2.4 | 2.1 | 3.4 |
| India | 4.3 | 3.7 | 5.2 |
| China | 5.4 | 7.2 | 9.3 |
|
Notes: The data presented are cumulative such that the sum of the blue and orange bars reflects the cumulative probability of emigration after 10 years. The countries presented here correspond to the 20 most frequently mentioned countries in the IMDB from 1982 to 2017. These 20 countries account for nearly 70% of all immigrants in this study. Source: Statistics Canada, Longitudinal Immigration Database. |
|||
The propensity to emigrate varies widely by country of birth, reflecting the results obtained in various studies (Chen 2009; Michalowski 1991).
More than 30% of immigrants whose country of birth is Taiwan, the United States, France or Hong Kong emigrated within 20 years after admission. This percentage also exceeds 25% for immigrants born in Lebanon. In addition, five years after admission, about 15% of immigrants from the United States or France had emigrated. Two key dynamics could be at work among immigrants from these countries. First, immigrants from countries with a standard of living similar to Canada’s, such as these two countries, are more likely to emigrate. These countries may continue to hold a strong attraction for their nationals even years after their arrival in Canada. The geographic proximity of Canada and the United States may also encourage US-born immigrants to emigrate. Second, immigrants from locations like Hong Kong or Lebanon may have been admitted to Canada amid political instability and may view their settlement and departure as two stages of a more complex migration strategy.
In contrast, immigrants from other countries show significantly lower propensities to emigrate. Twenty years after being admitted to Canada, less than 10% of immigrants born in the Philippines, Vietnam, Sri Lanka or Jamaica had left the country. The circumstances in which immigrants born in these countries are admitted to Canada may explain these results. They tend to belong to admission categories with lower emigration rates. About 30% of immigrants born in the Philippines were admitted as caregivers or through family sponsorship, compared with less than 5% of all immigrants. The Philippines encourages emigration by some of its workers so that they can send money earned abroad back to their families in the Philippines (Bonifacio 2008). Furthermore, just over 30% of immigrants born in Vietnam and almost 43% born in Sri Lanka were admitted as refugees, compared with less than 15% of all immigrants. More than 70% of immigrants born in Jamaica and admitted between 1982 and 2017 were admitted in the family sponsorship category, compared with about 35% of all immigrants. These Jamaican-born immigrants often joined family members in Canada in the 1980s following the development of family immigration policies.
3.3. Emigration of immigrants by age
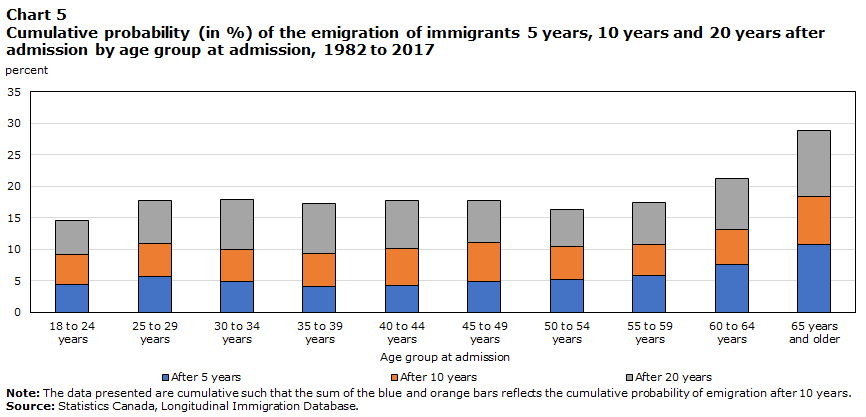
The literature reports that age at landing is also associated with immigrant emigration. Immigrants settle in Canada at different stages of their lives and may therefore face different integration issues or adopt different migration strategies. The following chart shows the cumulative probability of immigrant emigration 5, 10 and 20 years after admission by age at admission.
Data table for Chart 5
| Age group at admission | After 5 years | After 10 years | After 20 years |
|---|---|---|---|
| percent | |||
| 18 to 24 years | 4.4 | 4.8 | 5.4 |
| 25 to 29 years | 5.7 | 5.2 | 6.8 |
| 30 to 34 years | 4.9 | 5.1 | 7.9 |
| 35 to 39 years | 4.1 | 5.2 | 8.0 |
| 40 to 44 years | 4.2 | 5.9 | 7.6 |
| 45 to 49 years | 4.8 | 6.2 | 6.8 |
| 50 to 54 years | 5.1 | 5.3 | 5.9 |
| 55 to 59 years | 5.9 | 4.9 | 6.6 |
| 60 to 64 years | 7.5 | 5.7 | 8.1 |
| 65 years and older |
10.7 | 7.7 | 10.4 |
|
Note: The data presented are cumulative such that the sum of the blue and orange bars reflects the cumulative probability of emigration after 10 years. Source: Statistics Canada, Longitudinal Immigration Database. |
|||
Immigrants admitted at a later stage in life have the highest probability of emigrating. Five years after admission, 10.7% of immigrants admitted at age 65 or older had emigrated. This percentage rises to more than 25% 20 years after admission. Immigrants aged 18 and 24 at admission show a lower propensity to emigrate. Just over 15% emigrated within 20 years of admission. Immigrants admitted later in life may have more difficulty in integrating into Canada than younger immigrants (De Silva 1997; Schaafsma and Sweetman 2001). This may be one of the factors contributing to the higher propensity to emigrate among immigrants admitted to Canada when older.
While age at admission provides valuable information about the context in which immigrants settle in Canada, age at emigration is also a key factor underlying migration behaviour. The following chart shows the distribution of emigrants by age at the time of emigration.

Data table for Chart 6
| Age group at emigration | Percent |
|---|---|
| 18 to 24 years | 3.2 |
| 25 to 29 years | 9.6 |
| 30 to 34 years | 13.9 |
| 35 to 39 years | 14.1 |
| 40 to 44 years | 13.3 |
| 45 to 49 years | 13.1 |
| 50 to 54 years | 10.4 |
| 55 to 59 years | 6.6 |
| 60 to 64 years | 4.3 |
| 65 to 69 years | 3.6 |
| 70 to 74 years | 3.0 |
| 75 to 79 years | 2.3 |
| 80 years and older | 2.6 |
| Source: Statistics Canada, Longitudinal Immigration Database. | |
The distribution of emigrants by age at emigration broadly reflects the age structure traditionally associated with migration. Slightly more than half of immigrants who emigrated were between the ages of 30 and 49 when they left. These results are broadly consistent with those reported by Lebel (2015) and Chen (2009).
Interestingly, about one in ten emigrants was 65 years of age or older when they emigrated. These results may reflect retirement-motivated migration (Cobb-Clark and Stillman 2013). They may also result in part from the limitations of the definition of emigration used in this study.Note
3.4. Emigration of immigrants by admission category
The IMDB is able to link emigration and admission category. The following chart shows the cumulative probability of immigrant emigration 5, 10 and 20 years after admission by admission category.Note

Data table for Chart 7
| Admission category | After 5 years | After 10 years | After 20 years |
|---|---|---|---|
| percent | |||
| Skilled Workers | 6.1 | 6.6 | 8.8 |
| Canadian Experience Class | 9.6 | Note ...: not applicable | Note ...: not applicable |
| Provincial and Territorial Nominees | 4.4 | 6.0 | 8.3 |
| Caregivers | 2.0 | 1.7 | 2.7 |
| Entrepreneurs | 6.3 | 10.7 | 12.4 |
| Self-Employed | 6.1 | 7.6 | 9.5 |
| Investors | 6.5 | 15.4 | 19.2 |
| Refugees | 2.3 | 2.6 | 4.4 |
| Family Class | 5.2 | 4.0 | 5.4 |
| Otherse | 4.9 | 7.8 | 11.1 |
|
... not applicable Notes: The data presented are cumulative such that the sum of the blue and orange bars reflects cumulative probability of emigration after 10 years. The cumulative probability for the Canadian Experience Class is only calculated for seven years due to the length of existence of this program. Source: Statistics Canada, Longitudinal Immigration Database. |
|||
A strong link exists between immigrant admission category and emigration.
More than 20% of immigrants admitted as investors emigrated within ten years of admission. This percentage rises to more than 40% 20 years after admission. About 30% of immigrants admitted as entrepreneurs also emigrated within 20 years of admission. These categories include wealthy immigrants who tend to be highly mobile and who may intend to leave Canada even at the time of their admission.
In contrast, immigrants admitted as refugees or caregivers are significantly less likely to emigrate. Immigrants admitted in these two categories have respective probabilities of emigrating of 9.3% and 6.3% within two decades of admission. Immigrants admitted in the family categories also show a slightly lower propensity to emigrate (14.6% after 20 years). The context in which these immigrants enter Canada reduces their propensity to emigrate. Refugees are admitted to Canada with reasons to fear returning to their country of origin. Family immigrants settle in Canada to unite with family members and are given support by their relatives already in the country. Furthermore, because they are selected based on different criteria than other immigrants, they generally present characteristics associated less with emigration. Immigrants admitted as caregivers are predominantly women from the Philippines. As mentioned earlier, the Philippines encourages some of its workers to emigrate so that they can send their foreign earnings back to their families in the Philippines. These immigrants may be less likely to emigrate because one of the admission criteria for this category is to have a job in Canada and because immigration in these categories is often seen as a gateway to Canada for immigrants who are not eligible in other categories (Bonifacio 2008).
Immigrants admitted in the Canadian Experience Class had the highest emigration rates five years after admission (9.6%). However, because the program is relatively recent, data are not available over a longer period and are limited to a few cohorts. This result should therefore be interpreted with some caution.
3.5. Emigration of immigrants by other characteristics
Several other immigrant characteristics also correlate with emigration. The following table presents the cumulative probabilities of immigrant emigration 5, 10 and 20 years after admission by various characteristics.
| Characteristic | 5 years | 10 years | 20 years |
|---|---|---|---|
| percent | |||
| Total | 5.1 | 10.5 | 17.5 |
| Sex | |||
| Male | 5.7 | 11.6 | 19.6 |
| Female | 4.6 | 9.4 | 15.7 |
| Intended province or territory of destination at admission | |||
| N.L. | 6.7 | 12.9 | 20.6 |
| P.E.I. | 5.3 | 14.6 | 23.4 |
| N.S. | 7.6 | 16.0 | 26.6 |
| N.B. | 6.3 | 13.7 | 21.7 |
| Que. | 5.4 | 11.2 | 18.5 |
| Ont. | 5.0 | 10.0 | 16.8 |
| Man. | 4.0 | 7.8 | 12.9 |
| Sask. | 4.2 | 9.0 | 15.3 |
| Alta. | 4.7 | 9.3 | 15.2 |
| B.C. | 5.4 | 11.8 | 20.1 |
| Territories | 5.2 | 10.0 | 15.4 |
| Marital status | |||
| Married | 4.2 | 8.7 | 15.1 |
| Common-law | 5.8 | 10.4 | 17.2 |
| Never married (single) | 7.4 | 16.1 | 26.1 |
| Separated | 5.2 | 10.6 | 17.8 |
| Divorced | 5.9 | 12.2 | 20.2 |
| Widowed | 7.3 | 13.4 | 21.4 |
| Presence of a child on tax dataTable 2 Note 1 | |||
| No | 16.4 | 27.9 | 38.4 |
| Yes | 2.2 | 6.2 | 12.6 |
| Knowledge of official languages at admission | |||
| English only | 5.5 | 11.3 | 19.2 |
| French only | 4.5 | 8.9 | 15.7 |
| English and French | 7.3 | 15.1 | 24.9 |
| Neither English nor French | 3.9 | 8.1 | 13.7 |
| Level of education at admission | |||
| 0 to 12 years of schooling | 4.1 | 8.2 | 13.6 |
| 13 or more years of schooling | 5.3 | 10.9 | 18.2 |
| Trade certificate | 5.0 | 9.7 | 16.0 |
| Non-university diploma | 4.8 | 10.0 | 17.5 |
| Bachelor's degree | 5.5 | 11.8 | 21.1 |
| Master's degree | 7.7 | 16.4 | 28.9 |
| Doctorate | 10.4 | 20.5 | 32.5 |
| Non-permanent resident status before admission | |||
| No non-permanent resident permit | 6.1 | 12.0 | 18.5 |
| Work permit | 5.4 | 9.7 | 15.7 |
| Study permit | 10.0 | 20.9 | 31.3 |
| Work and study permits | 4.6 | 8.5 | 14.9 |
| Asylum claimant | 4.8 | 10.2 | 17.4 |
|
|||
The sex of the immigrant is somewhat related to the propensity to emigrate, with men slightly more likely to leave Canada than women. This finding is consistent with findings generally reported in the literature on immigrant emigration (Lam 1994; Chen 2009).
Emigration also varies by the intended province or territory of destination declared at admission. More than 20% of immigrants with an intended province of destination in the Atlantic region or British Columbia emigrated within 20 years of admission. Nearly 27% of immigrants whose intended province of destination was Nova Scotia left Canada within two decades of admission, the highest rate among all provinces and territories. Nova Scotia stands out from the rest of the country with a proportionally higher number of immigrants admitted as entrepreneurs (16.1% versus 2.1%). The fact that immigrants in this category are more likely to emigrate may help explain the results for this province.
A strong correlation exists between the family status of immigrants and emigration. Having a family reduces the propensity to emigrate. In particular, married and common-law immigrants are less likely to emigrate. The presence of children in the tax familyNote relates closely to emigration. Nearly 40% of immigrants who never had children in their tax family emigrated within two decades of admission compared with less than 13% of those who already had children in their tax family. In contrast, single immigrants are much more likely to emigrate. More than a quarter of these immigrants left Canada within 20 years of admission. Having a family obviously complicates the process of moving, especially for international migration. The literature on internal migration in Canada indicates that children are also associated with a lower propensity to migrate (Finnie 2000; Dion and Coulombe 2008).
Knowledge of official languages at admission is related to emigration. About a quarter of the immigrants who knew both official languages at admission emigrated within 20 years of being admitted to the country. Immigrants able to conduct a conversation in both official languages at admission were overrepresented in several admission categories with higher tendencies to emigrate, such as investors and entrepreneurs. At the other end of the spectrum, immigrants unable to hold a conversation in English and French at admission were less likely to emigrate (13.7% after 20 years). Proportionally more of these immigrants are admitted in the family admission categories and as refugees, each associated with lower emigration propensities. Knowledge of official languages at admission must be interpreted with some caution. Many immigrants receive training shortly after landing to learn or upgrade their language skills (Grondin 2007). Consequently, their skill level at the time of emigration may not be the same as it was at admission. The result obtained in this study differs from that observed by Lam (1994) which showed that immigrants unable to hold a conversation in English and French were more likely to emigrate. However, Lam’s result may reflect the limitations of using a variant of the residual method for a characteristic (knowledge of official languages) that can change quickly within a few years of admission.
The propensity to emigrate follows a clear gradient based on level of education at admission. Immigrants with 12 years of education or less are less likely to emigrate than are immigrants with more education. Just over 10% of immigrants who had a doctorate at the time of admission emigrated within five years of admission with this percentage rising to more than 30% within 20 years of their admission to Canada. Nearly 30% of immigrants with a master’s degree at admission also emigrated within the following two decades. These results are consistent with other studies on immigrant emigration and migration in general (Lam 1994; King and Newbold 2007).
Some immigrants arrived in Canada as NPRs before becoming immigrants. Immigrants who held a study permit prior to being admitted have a much higher propensity to emigrate than other immigrants. More than 20% of these immigrants left Canada within ten years of admission and almost one-third emigrated within 20 years of admission. Because they were students while in Canada as an NPR, many of these immigrants may have had fewer ties to the country, such as family in Canada or stable employment. They may also have originally planned to return to their home country after their studies or to continue their studies in another country. Immigrants who held study permits before becoming immigrants also have several characteristics associated with emigration. They have a proportionately higher education than immigrants generally and are more likely to be admitted as investors and less likely to be refugees.
4. Factors associated with the emigration of immigrants
The previous section identified several characteristics associated with immigrant emigration. The analysis is developed further here by constructing logistic regression models to isolate the effect of different factors likely to be correlated with this phenomenon. The statistical significance thresholds used in this study are based on the effect size of the odds ratios.
The following table presents the main results of the regression models in the form of odds ratios. The bivariate models include only the characteristic examined (e.g., age group) and emigration, while the multivariate model includes all factors analyzed in this study. This approach enables a comparison of the gross effect with the net effect after adding the other characteristics to the model.
| Characteristic | Bivariate models | Multivariate model |
|---|---|---|
| odds ratio | ||
| Age group at admission | ||
| 30 to 34 years | Ref. | Ref. |
| 65 years or over | 1.89 [1.87 to 1.91] Note * | 1.24 [1.23 to 1.26] |
| Intended province or territory of destination at admission | ||
| N.S. | 1.61 [1.58 to 1.65] Note * | 1.03 [1.02 to 1.09] |
| Ont. | Ref. | Ref. |
| Marital status | ||
| Married | Ref. | Ref. |
| Never married (single) | 1.83 [1.82 to 1.84] Note * | 1.32 [1.31 to 1.33] |
| Separated | 1.25 [1.24 to 1.27] | 1.52 [1.51 to 1.54] Note * |
| Presence of a child in tax dataTable 3 Note 1 | ||
| No | 4.13 [4.11 to 4.15] Note *** | 3.97 [3.95 to 4.00] Note *** |
| Yes | Ref. | Ref. |
| Country of birth | ||
| China | Ref. | Ref. |
| India | 0.60 [0.59 to 0.61] Note * | 0.72 [0.71 to 0.73] |
| Philippines | 0.36 [0.35 to 0.36] Note ** | 0.43 [0.42 to 0.43] Note ** |
| Former USSR | 0.52 [0.51 to 0.53] Note * | 0.47 [0.47 to 0.48] Note ** |
| Sri Lanka | 0.26 [0.26 to 0.27] Note *** | 0.38 [0.37 to 0.39] Note ** |
| United States | 2.16 [2.13 to 2.19] Note ** | 1.86 [1.84 to 1.88] Note * |
| Viet Nam | 0.26 [0.26 to 0.27] Note *** | 0.49 [0.48 to 0.51] Note ** |
| Poland | 0.49 [0.48 to 0.50] Note ** | 0.76 [0.74 to 0.77] |
| Former Yugoslavia | 0.52 [0.50 to 0.53] Note * | 0.64 [0.62 to 0.65] Note * |
| Romania | 0.61 [0.59 to 0.62] Note * | 0.55 [0.53 to 0.56] Note * |
| France | 1.90 [1.90 to 1.93] Note * | 1.36 [1.34 to 1.39] |
| Jamaica | 0.44 [0.43 to 0.45] Note ** | 0.52 [0.51 to 0.53] Note * |
| Taiwan | 1.87 [1.84 to 1.90] Note * | 1.57 [1.55 to 1.59] Note * |
| Other countries in North America | 1.16 [1.08 to 1.24] | 0.59 [0.55 to 0.63] Note * |
| Central America | 0.57 [0.56 to 0.58] Note * | 0.82 [0.80 to 0.83] |
| Other Caribbean countries | 0.56 [0.55 to 0.57] Note * | 0.68 [0.67 to 0.70] |
| South America | 0.62 [0.61 to 0.63] Note * | 0.70 [0.69 to 0.71] |
| Other countries in Northern Europe | 1.90 [1.84 to 1.94] Note * | 1.77 [1.72 to 1.81] Note * |
| Other countries in Southern and Southeastern Asia | 0.62 [0.60 to 0.63] Note * | 0.73 [0.71 to 0.74] |
| Other countries in Oceania | 1.32 [1.30 to 1.35] | 1.54 [1.50 to 1.57] Note * |
| Knowledge of official languages at admission | ||
| English only | Ref. | Ref. |
| Neither English nor French | 0.68 [0.68 to 0.69] | 0.82 [0.81 to 0.82] |
| Admission category | ||
| Skilled Worker | Ref. | Ref. |
| Canadian Experience Class | 1.46 [1.43 to 1.50] | 0.99 [0.96 to 1.01] |
| Caregiver | 0.31 [0.30 to 0.31] Note *** | 0.46 [0.45 to 0.47] Note ** |
| Entrepreneur | 1.39 [1.37 to 1.40] | 1.68 [1.66 to 1.70] |
| Investor | 1.98 [1.95 to 2.00] | 2.11 [2.08 to 2.14] |
| Refugee | 0.42 [0.42 to 0.43] | 0.59 [0.58 to 0.59] |
| Level of education at admission | ||
| 0 to 12 years of schooling | Ref. | Ref. |
| Bachelor's degree | 1.58 [1.57 to 1.59] Note * | 1.37 [1.36 to 1.38] |
| Master's degree | 2.27 [2.25 to 2.28] Note ** | 1.65 [1.63 to 1.66] Note * |
| Doctorate | 2.74 [2.70 to 2.78] Note ** | 1.80 [1.77 to 1.83] Note * |
| Non-permanent resident status before admission | ||
| No non-permanent resident permit | Ref. | Ref. |
| Study permit | 2.05 [2.03 to 2.08] Note ** | 1.11 [1.10 to 1.13] |
| Number of observations | Note ...: not applicable | 75,196,174 |
| Pseudo R-square | Note ...: not applicable | 7.5% |
... not applicable
Source: Statistics Canada, Longitudinal Immigration Database. |
||
Many results of the multivariate analysis are consistent with those of the descriptive analysis.
Regression model results show that the association between emigration and having children in the tax family remains statistically strong based on the thresholds for this study. This finding suggests that having children in the tax family or having had children in the past is a leading factor associated with immigrants remaining in Canada.
Most links between country of birth and emigration generally remain the same when the effects of other factors are taken into account. Immigrants born in the United States or Taiwan are still particularly likely to emigrate compared with immigrants born in China. This can be explained by the geographic proximity of Canada and the United States and the political context in which many immigrants from Taiwan immigrated to Canada. In addition, immigrants born in the Philippines, Sri Lanka, Vietnam, one of the countries of the former USSR, or Jamaica remain less likely to leave Canada than those born in China, even when taking into account other factors such as admission category. These results indicate that factors specific to these countries are linked to their emigration levels. Taking other factors into account changes some associations between emigration and country of birth. Thus, being born in Hong Kong, India, Poland or France become less correlated with emigration.
The multivariate model indicates that emigration still varies by admission category. In particular, investors are still more likely to emigrate than skilled workers, while immigrants admitted as refugees or caregivers remain less likely to leave Canada. Taking other characteristics into account somewhat strengthens the association between emigration and the entrepreneur category. Immigrants in this category become more likely to emigrate than those in the skilled worker category. These results are consistent with the behaviours expected of some of these immigrants.
The association between level of education at admission and emigration remains even when the effect of other characteristics is considered. Immigrants with a master’s or doctoral degree at admission are still more likely to emigrate. However, the effect is weaker than at the descriptive stage.
The results of the multivariate model also show that several associations identified during the descriptive analysis primarily result from a composition effect.
The differences observed in the descriptive stage for older individuals or individuals with Nova Scotia as their intended province of destination at admission diminish when the effect of the other factors is considered.Note Several characteristics of older immigrants at admission discourage emigration, such their tendency to be admitted in the family categories, inability to conduct a conversation in either official language, or married status. However, they are also much less likely to have children in their tax family, a major correlate of emigration. As mentioned earlier, Nova Scotia has a relatively large number of immigrants in the entrepreneur category, who are more likely to emigrate.
Taking into account the effect of other characteristics, immigrants who held a study permit prior to admission to Canada no longer had a higher propensity to emigrate than immigrants who were not NPRs prior to landing. Immigrants who held a study permit before entering Canada have several other characteristics that favoured emigration, notably higher levels of education.
Discussion and conclusion
Immigration is an increasingly important facet of Canada’s migration dynamics. As the country’s population growth becomes increasingly reliant on international migration and as policies are developed to attract and integrate immigrants, the emigration of immigrants is becoming an issue of interest. The purpose of this study was to highlight certain factors associated with this phenomenon using IMDB data. Emigration was examined indirectly through immigrants who permanently stop filing a tax return. Discrete time survival tables and logistic regression models were constructed to measure immigrant emigration and factors associated with this phenomenon.
Based on the criterion developed for this study, the emigration of immigrants is a numerically significant phenomenon. Some 5.1% of immigrants admitted between 1982 and 2017 emigrated within five years of admission. This percentage rises to 17.5% 20 years after admission. The annual probability of emigrating peaks three to seven years after admission.
Several immigrant characteristics are linked to emigration. Immigrants born in Taiwan, the United States, France, Hong Kong or Lebanon are more likely to emigrate. Conversely, those born in the Philippines, Vietnam, Sri Lanka or Jamaica are less likely to leave Canada. The effect of most of these countries remains statistically significant when other factors are taken into account. These differences can be explained in large part by the attraction that certain countries hold for their nationals and the context in which immigrants enter Canada.
The presence of children in the tax family relates closely to emigration. Immigrants who never had children in their tax family were substantially more likely to emigrate than those who had children. This effect remains strong when other factors are also considered.
Immigrants admitted at age 65 or older and those with Nova Scotia as their intended province of destination are somewhat more likely to emigrate than those who settled when they were younger. However, these effects disappear when other factors associated with immigrant emigration are taken into account.
Immigrants admitted in the investor and entrepreneur categories are more likely to emigrate, while those admitted in the caregiver and refugee categories are less likely to emigrate. The context of their admission to Canada favours or discourages emigration for many immigrants in these categories.
Emigration follows a clear gradient based on level of education. Individuals with higher levels of education are more likely to emigrate than less educated immigrants.
Immigrants who held an NPR study permit were especially likely to leave Canada. However, this result stems mainly from the fact that these immigrants present several characteristics associated with emigration, such as higher levels of education.
Immigration is often seen as a driving factor behind Canada’s economic and demographic growth. For this reason, the emigration of immigrants raises two main issues.
Immigrant retention is an important issue in immigration policy. Several studies have looked at interprovincial migration of immigrants, particularly recent immigrants (van Huystee and St. Jean 2014; Haan et al. 2017). However, the results of this study suggest that issues concerning the retention of immigrants include not only interprovincial migration but also emigration. These issues impact the Atlantic provinces in particular where losses due to interprovincial migration combine with higher propensities to emigrate.
The portrait of Canadian immigration is constantly evolving. Certain changes in the demographic and socioeconomic composition of immigrants and in the political context in Canada and the rest of the world can affect emigration levels. In recent years, for example, China and India have become the countries of origin of an increasing number of immigrants. However, continued economic development in these countries in recent years could affect the propensity of immigrants from these countries to return to their home countries. Immigration policies also favour immigration by the highly educated, a correlate of emigration. On the other hand, efforts to select and integrate newcomers into the country and future international political crises could mitigate these effects.
Refining the measurement of immigrant migration behaviour
Migration is a very complex phenomenon. Technological advances in communication and transportation, as well as globalization, foster international migration and the development of economic and social ties in more than one country. Some immigrants may not emigrate permanently, but rather as part of a more complex migration strategy. Since the emigration criterion used in this study was obtained by examining immigrants who permanently stopped filing tax returns, certain aspects of immigrant emigration were not analyzed. Two of these aspects are return migration and circular migration.
As with Canadian-born emigrants, some immigrants may leave Canada and then come back again later. Reverse Record Check (RRC) data suggest that many immigrants may be temporarily abroad on census day. This temporary emigration implies a likely return to Canada. Immigrants also represent a significant portion of return migration to Canada. Between 30% and 40% of emigrants returning to Canada are immigrants (Frank and Hou 2012). Whether a person who stops filing tax returns for a few years is an emigrant who eventually returns to Canada or a non-filer is difficult to determine. One option is to use the dates of arrival and departures from tax data in a manner similar to Finnie’s (2006) approach using the Longitudinal Administrative Databank (LAD). However, as previously noted, dates of departure in tax data underestimate emigration levels and thus may underestimate return migration as well. The scope of such a study would be limited by these shortcomings.
Another issue of interest—somewhat of an extension of return migration—is circular migration. Developments in communications and transportation technologies facilitate regular trips between Canada and other countries. A few studies mention the growing importance of circular migration between Canada and Asia. However, this type of migration is very difficult to measure. Individuals engaged in circular migration may continue to appear in Canadian data sources such as tax returns and censuses. Censuses can partially measure circular migration by comparing place of residence five years ago to place of residence one year ago for the enumerated population. For example, immigrants who were enumerated in the census (resided in Canada on census day) and who resided Canada five years before the census, but resided abroad one year before the census, may be circular migrants.
In addition to these issues, the IMDB data do not fully capture the context in which immigrants are admitted, let alone their motivations to immigrate to Canada.
A lack of robust data sources limits accurate measurement of emigration. However, a number of new sources could eventually enrich our understanding of this phenomenon.
Tax data are not limited to T1 tax returns. Other tax sources, such as the Canada Child Benefit (CCB), could be used to refine the signals of emigration (Qiu and al 2021).
Some studies have already used big data such as Twitter to measure emigration (Zagheni et al. 2014). While these data also have limitations, they can be a potentially promising avenue to enrich our understanding of emigration, especially in the context of sudden population movements after a natural disaster or major political crisis. However, because of the difficulty in fully understanding how these data are collected, the concepts they represent and how they can change over time, big data currently have limited potential for computing official statistics of immigrant emigration.
Border data could also shed new light on the emigration trajectories of Canadians. Australia uses these data to measure international migration (Australian Bureau of Statistics 2018). In Canada, data from the Entry/Exit Program (https://www.canada.ca/en/immigration-refugees-citizenship/corporate/publications-manuals/operational-bulletins-manuals/service-delivery/entry-exit.html), a joint initiative between IRCC and the Canada Border Services Agency (CBSA) to establish an information system of entries and exits, could be leveraged in this regard. However, a notable limitation of border data for measuring international migration is the need to separate a relatively small number of migrants from international travellers.
A few other types of data, such as healthcare files, could also yield some information on emigration. Given the limited number of sources on the topic, data integration through record linkages between the aforementioned files could be used to maximize the use of the available information while limiting the flaws.
Finally, the accurate measurement of a complex phenomenon such as emigration must rely on clear concepts and data appropriate to its measurement. Canadian administrative data do not always measure emigration in the same way as other key demographic databases such as censuses.Note This study used an indirect definition of emigration to utilize information available in tax data and to counter some the limitations of this data source. A better understanding of how tax data reflect different facets of emigration is needed to improve measurement. The definition used in this study can potentially be refined using other indicators of presence in Canada such as supplementary tax data or border data. However, in the absence of robust data allowing the direct measurement of emigration based on clear concepts, this phenomenon will likely elude precise measurement for the foreseeable future.
References
Australian Bureau of Statistics. 2018. “Improvements to the Estimation of Net Overseas Migration”. Information Paper. No. 3412.0.55.004. March 2018.
Aydemir, Abdurrahman and Chris Robinson. 2006. “Return and Onward Migration among Working Age Men”. Analytical Studies Branch Research Paper Series. No. 273. March 2006. Statistics Canada catalogue no. 11F0019. 49 p.
Baruch, Yehuda, Pawan S. Budhwar and Narest Khatri. 2007. “Brain Drain: Inclination to Stay Abroad after Studies”. Journal of World Business. No. 42. Pp. 99-112.
Beaujot, Roderic and J. Peter Rappak. 1989. “The Link between Immigration and Emigration in Canada, 1945-1986”. Canadian Studies in Population. Vol. 16, no. 2. Pp. 201-216.
Bérard-Chagnon, Julien. 2008. Analyse de la couverture des fichiers fiscaux T1 de 2005. Working Document. Demography Division. Statistics Canada. 77 p.
Bérard-Chagnon, Julien. 2018. “Measuring Emigration in Canada: Review of Available Data Sources and Methods”. Demographic Documents. No. 14. December 20, 2018. Statistics Canada catalogue no. 91F0015M. 39 p.
Bérard-Chagnon, Julien, Stacey Hallman and Geneviève Caron. 2019. “Recent Immigrants and Non-Permanent Residents Missed in the 2011 Census”. Ethnicity, Language and Immigration Thematic Series. No. 8. May 22, 2019. Statistics Canada catalogue no. 89-657.
Bijak, Jakub. 2019. “Editorial: P-values, Theory, Replicability, and Rigour”. Demographic Research. Vol. 41, article 32. October 10, 2019. Pp. 949-952.
Bonifacio, Glenda Lynna Anne Tibe. 2008. “I Care for You, Who Cares for Me? Transitional Services of Filipino Live-in Caregivers in Canada”. Asian Women. Vol. 24, no. 1. Pp. 25-50.
Boudarbat, Brahim and Marie Connolly. 2013. Exode des cerveaux : Pourquoi certains diplômés d’études postsecondaires choisissent-ils de travailler aux États-Unis? Centre interuniversitaire de recherche en analyse des organisations. 76 p.
Chant, John. 2006. “The Passport Package: Rethinking the Citizenship Benefits of Non-Resident Canadians”. Backgrounder. C.D. Howe Institute. No. 99. December 2006. 16 p.
Chen, Victor Z., Don Devoretz and Kenny Zhang. 2009. “Out-Migration of Canadians between 1996 and 2006: Evidence from Canadian Censuses”. Asia Pacific Foundation. September 2009. 36 p.
Cobb-Clarke, Deborah A. and Steven Stillman. 2013. “Return Migration and the Age Profile of Retirement among Immigrants”. IZA Journal of Migration. Pp. 2-20.
De Sylva, Arnold. 1997. “Earnings of Immigrant Classes in the Early 1980s in Canada: A Reexamination”. Canadian Public Policy. Vol. 23, no. 2. June 1997. Pp. 179-202.
Dion, Patrice and Simon Coulombe. 2008. “Portrait of the Mobility of Canadians in 2006: Trajectories and Characteristics of Migrants”. Report on the Demographic Situation in Canada. 2005 and 2006. July 2008. Demography Division. Statistics Canada catalogue no. 91-209-X. Pp. 78-108.
Dryburgh, Heather and Jason Hamel. 2004. “Immigrants in Demand: Staying or Leaving?” Canadian Social Trends. Fall 2004. No. 74. Statistics Canada catalogue no. 11-008. 6 p.
Evra, Rose and Elena Prokopenko. 2021. “Longitudinal Immigration Database (IMDB) Technical Report, 2020”. Analytical Studies: Methods and References. No. 11. December 6, 2021. Statistics Canada catalogue no. 11-633-X. 75 p.
Ferguson, Christopher J. 2009. “An Effect Size Primer: A Guide for Clinicians and Researchers”. American Psychological Association. Vol. 40, no. 5. Pp. 532-538.
Finnie, Ross. 2000. “Who Moves? A Panel Logit Model Analysis of Inter-provincial Migration in Canada”. Analytical Studies Branch Research Paper Series. No. 142. August 2000. Statistics Canada catalogue no. 11F0019. 33 p.
Finnie, Ross. 2006. “International Mobility: Patterns of Exit and Return of Canadians, 1982 to 2003”. Analytical Studies Branch Research Paper Series. No. 288. Statistics Canada catalogue no. 11F0019. 61 p.
Fong, Eric. 2012. “Return Migration from Canada to Hong Kong”. The China Review. Vol. 12, no. 1. Pp. 25-44.
Frank, Krystin and Feng Hou. 2012. "Seniors Returning to Canada".Perspectives on Labour and Income. Spring 2012. Statistics Canada catalogue no. 71-001-X. 14 p.
Grondin, Chantal. 2007. Knowledge of Official Languages Among New Immigrants: How Important Is It in the Labour Market? Special Surveys Division. Statistics Canada catalogue no. 89-624-XIE. 92 p.
Haan, Michael, Jake Arbuckle and Elena Prokopenko. 2017. “Individual and Community-Level Determinants of Retention of Anglophone and Francophone Immigrants across Canada”. Canadian Studies in Population. Vol. 44, no. 1-2. Pp. 59-76.
King, Karen K. and K. Bruce Newbold. 2007. “Onward Emigration to the United States by Canadian Immigrants between 1995 and 2000”. International Migration Review. Vol. 41, no. 4. Winter 2007. Pp. 909-929.
Lam, Kit-Chun. 1994. “Outmigration of Foreign-Born Members in Canada”. The Canadian Journal of Economics. Vol. 27, no. 2. May 1994. Pp. 352-370.
Lebel, André. 2015. A Look at Alternative Ways to Estimate Emigration in Canada. Poster presented at the 2015 conference of the Population Association of America. San Diego. Session 2, poster 56.
Ley, David and Audrey Kobayashi. 2005. “Back to Hong Kong: Return Migration or Transnational Sojourn?” Global Networks. Vol. 5, no. 2. Pp. 111-127.
Lu, Yuqian and Feng Hou. 2017. “Transition from Temporary Foreign Workers to Permanent Residents, 1990 to 2014”. Analytical Studies Branch Research Paper Series. No. 389. February 21, 2017. Statistics Canada catalogue no. 11F0019M. 32 p.
Michalowski, Margaret. 1991. “Foreign-born Canadian Emigrants and their Characteristics (1981-1986)”. The International Migration Review. Vol. 25, no. 1. Spring 1991. Pp. 28-59.
Motuz, Carol. 1974. Return Migration, An Analysis of Return Migration from Canada, 1969-1974. Research Projects Group, Strategic Planning and Research Division, Department of Manpower and Immigration. 172 p.
OECD. 2015. Connecting with Emigrants: A Global Profile of Diasporas 2015. OECD Publishing. Paris. 460 p.
Qiu, Hanqing, Feng Hou and Eden Crossman. 2021. “Estimating Immigrants’ Presence in Canada within the Context of Increasingly Fluid International Migration Patterns”. Analytical Studies: Methods and References. No. 32. March 16, 2021. Statistics Canada catalogue no. 11-633-X. 22 p.
Schaafsma, Joseph and Arthur Sweetman. 2001. “Immigrant Earnings: Age at Immigration Matters”. Canadian Journal of Economics. Vol. 34, no. 4. November 2001. Pp. 1,066-1,099.
Shumanty, Rufteen. 2017. “The Amalgamated Mortality Database (AMDB): Data Evaluation and Quality Assessment”. Data Interpretation Workshop (DIW) Analytical Paper Series. Octobre 27, 2017. Statistics Canada. 17 p.
Statistics Canada. 2015. “Sampling and Weighting Technical Report”. National Household Survey, 2011 Technical Report. March 24, 2015. Catalogue no. 99-002-X2011001. 53 p.
Statistics Canada. 2020. “Technical Supplement: Production of Demographic Estimates for the Second Quarter of 2020 in the Context of COVID-19”. Demographic Documents. No. 16. September 29, 2020. Catalogue no. 91F0015M. 28 p.
Statistics Canada. 2022a. “Immigrants make up the largest share of the population in over 150 years and continue to shape who we are as Canadians”. The Daily. October 26, 2022. Catalogue no. 11-001. 21 p.
Statistics Canada. 2022b. Population Projections for Canada (2021 to 2068), Provinces and Territories (2021 to 2043). August 22, 2022. Catalogue no. 91-520-X. 14 p.
Statistics Canada. 2023. “Canada's population estimates: Record-high population growth in 2022”. The Daily. March 22, 2023. Catalogue no. 11-001. 4 p.
Sullivan, Gail M. and Richard Feinn. 2012. “Using Effect Size-or Why the P Value is Not Enough”. Journal of Graduate Medical Education, September 2012. Pp. 279-282.
Van Huystee, Monica and Benoit St. Jean. 2014. “Interprovincial Mobility of Immigrants in Canada 2006-2011”. IMDB 2011 Research Series. Citizenship and Immigration Canada. July 2014. Ci4-47/2015. 35 p.
Yssaad, Lahouaria and Andrew Fields. 2018. “The Canadian Immigrant Labour Market: Recent Trends from 2006 to 2017”. The Immigrant Labour Force Analysis Series. December 24, 2018. Statistics Canada catalogue no. 71-606-X. 26 p.
Zagheni, Emilio, Venkata Rama Kiran Garimella, Ingmar Weber and Bogdan State. 2014. “Inferring International and Internal Migration Patterns from Twitter Data”. Conference Proceedings of the 23rd international Conference on World Wide Web Companion. Pp. 439-444.
Zhao, John, Doug Drew and T. Scott Murray. 2000. “Brain Drain and Brain Gain: The Migration of Knowledge Workers from and to Canada”. Education Quarterly Review. Vol. 6, no. 3. Statistics Canada catalogue no. 81-003-XIE. Pp. 8-35.
Appendix A
The definition of emigration used in this study was determined based on tax filers who permanently stop filing tax returns. This definition being indirect, it may present certain limitations that require examination. This appendix presents some analyses conducted to evaluate the definition of emigration used in this study.
First, emigrants identified by this approach are separated according to the signal used to classify them as emigrants. The numbers of emigrants are then compared with those from other sources to assess their consistency.
A.1. Classifying emigration by signal
Emigrants can be classified according to the signal used to identify them. To a certain extent, these groups reflect the robustness of their classification as emigrants and the effect on the number of emigrants of using a broader definition than dates of departure in tax data alone.
Date of departure
Two groups of emigrants are identified by their date of departure.
First, individuals who entered a date of departure on their last tax return are classified in this category. Although it underestimates emigration, this signal is assumed to be the strongest emigration signal of a tax filer because this criterion implies the breaking of their social and fiscal ties with Canada (Bérard-Chagnon 2018).
Second, information from others in the immigrant admission group is used. An admission group is defined as all immigrants who applied on the same permanent residence form. When one individual enters a date of departure, other individuals in the admission group who permanently stopped filing a tax return in the same year are also deemed part of the “date of departure” group.
Estimated emigration – admission group
If all members of an admission group permanently stop filing a tax return in the same year, they are considered to be in the “estimated emigration – admission group” category. While this signal is not as strong as that of a date of departure, the fact that all members of the admission group permanently stopped filing a tax return at the same time suggests that the group may have left the country.
Estimated emigration – individual
Other emigrants who permanently stop filing a tax return are considered part of the “estimated emigration – individual” group. This criterion takes into account the fact that certain groups are less likely to file a tax return.
The following chart shows the distribution of emigrants by emigration category.

Data table for Chart A.1
| Year since admission | Declared emigration - Date of departure | Estimated emigration - Admission group | Estimated emigration - Individual |
|---|---|---|---|
| percent | |||
| 0 | 6.0 | 71.9 | 22.2 |
| 1 | 14.4 | 64.5 | 21.2 |
| 2 | 13.1 | 66.9 | 20.0 |
| 3 | 12.2 | 67.6 | 20.2 |
| 4 | 17.8 | 63.3 | 18.9 |
| 5 | 21.1 | 60.4 | 18.5 |
| 6 | 19.2 | 61.9 | 18.9 |
| 7 | 18.0 | 63.4 | 18.6 |
| 8 | 16.9 | 65.8 | 17.4 |
| 9 | 16.3 | 67.0 | 16.7 |
| 10 | 15.5 | 69.0 | 15.5 |
| 11 | 14.9 | 70.2 | 15.0 |
| 12 | 14.4 | 70.8 | 14.8 |
| 13 | 14.4 | 71.4 | 14.3 |
| 14 | 13.1 | 73.1 | 13.8 |
| 15 | 12.2 | 75.1 | 12.8 |
| 16 | 11.5 | 75.2 | 13.3 |
| 17 | 11.1 | 75.4 | 13.6 |
| 18 | 10.6 | 77.3 | 12.1 |
| 19 | 9.5 | 79.6 | 10.8 |
| 20 | 9.8 | 80.4 | 9.8 |
| 21 | 10.0 | 81.1 | 8.8 |
| 22 | 10.1 | 82.5 | 7.4 |
| 23 | 9.1 | 84.9 | 6.0 |
| 24 | 8.6 | 87.0 | 4.4 |
| 25 | 7.8 | 88.6 | 3.5 |
| 26 | 7.3 | 89.8 | 2.9 |
| 27 | 7.5 | 90.5 | 2.0 |
| 28 | 8.6 | 89.3 | 2.1 |
| 29 | 8.9 | 89.4 | 1.7 |
| 30 | 6.7 | 91.7 | 1.6 |
| 31 | 9.3 | 89.6 | 1.1 |
| 32 | 7.8 | 92.2 | 0.0 |
| 33 | 5.5 | 94.2 | 0.4 |
| 34 | 7.4 | 91.8 | 0.8 |
| 35 | 6.1 | 91.5 | 2.4 |
| Total | 14.3 | 69.1 | 16.6 |
| Source: Statistics Canada, Longitudinal Immigration Database. | |||
Overall, about two-thirds of emigrants identified by this study’s definition simply stopped filing a tax return (estimated emigration – individual). The proportion of emigrants identified by this signal increases with time since they were admitted. Over 90% of emigrants who left Canada at least two decades after landing were identified by the signal “estimated emigration – individual.” However, 14.3% of emigrants in this analysis reported a date of departure in their last tax return. Emigration identified using this signal is relatively higher a few years after admission and peaks at 21.1% for all emigrants five years after being admitted to Canada.
These results reveal two things. First, they confirm that the use of dates of departure alone greatly underestimates emigration. Second, assuming that dates of departure are the strongest signal of emigration, the fact that emigration measured several years after landing is more often captured by other signals suggests that the measurement of these departures may be slightly less accurate than the measurement observed a few years after admission. Accordingly, some immigrants admitted to the country several decades ago (and thus generally olderNote ) may have simply stopped filing tax returns, e.g., when they retired. This situation places a limitation on the definition used in this study and may result in a slight overestimation of emigration among older immigrants.
The following chart explores this assumption by comparing the distribution of emigrants by emigration signal and age group at emigration.

Data table for Chart A.2
| Age group at emigration | Declared emigration - Date of departure | Estimated emigration - Admission group | Estimated emigration - Individual | Permanent emigration from the demographic estimates (1998/1999) |
|---|---|---|---|---|
| percent | ||||
| 18 to 24 years | 2.2 | 3.7 | 1.9 | 7.8 |
| 25 to 29 years | 10.5 | 10.5 | 5.0 | 14.5 |
| 30 to 34 years | 16.2 | 14.1 | 11.4 | 17.4 |
| 35 to 39 years | 15.3 | 13.4 | 16.2 | 17.1 |
| 40 to 44 years | 11.9 | 12.9 | 16.3 | 14.6 |
| 45 to 49 years | 11.5 | 13.0 | 15.1 | 10.4 |
| 50 to 54 years | 10.3 | 10.5 | 10.3 | 6.8 |
| 55 to 59 years | 7.1 | 6.6 | 5.8 | 3.8 |
| 60 to 64 years | 4.8 | 4.1 | 4.7 | 1.8 |
| 65 to 69 years | 3.6 | 3.2 | 4.8 | 2.5 |
| 70 to 74 years | 2.4 | 2.8 | 4.0 | 1.6 |
| 75 to 79 years | 1.8 | 2.4 | 2.6 | 1.1 |
| 80 years or over | 2.0 | 2.5 | 1.5 | 0.6 |
| Sources: Statistics Canada, Longitudinal Immigration Database and Demographic Estimates Program. | ||||
Overall, the distributions by age group for each emigration signal are relatively similar. They are also generally consistent with the permanent emigration estimate curve from the demographic estimates.Note However, the age-group curve of emigrants in the “estimated emigration – individual” category differs slightly from the other two curves. A higher proportion of these emigrants left in their forties and between 65 and 74 years of age. Conversely, fewer of them than in the other two categories emigrated between the ages of 18 and 34. These results suggest that a number of older emigrants identified by this signal may simply have stopped filing a tax return while still living in Canada. This situation can occur, for example, after the transition from working life to retirement. The over-representation of emigrants in the “estimated emigration – admission group” category aged 40 to 49 is more difficult to explain.
In short, while most emigrants in this study were identified indirectly, the relative similarity of the three curves suggests that this approach had little effect on the total number of emigrants and age distributions in this study.
A.2. Evaluation of the definition of emigration in this study
The results obtained using the IMDB and the definition chosen were compared with those of the Reverse Records Check (RRC), a residual method, and the 2016 Census to assess their consistency. The RRC can be used to compare the level of emigration of recent immigrants admitted to the country, while the residual method allows a comparison with the level of emigration of immigrants who have been in the country longer. The 2016 Census provides a means to determine whether immigrants identified as emigrants were still in Canada in 2016 and therefore were potentially correctly classified as emigrants.
These three additional sources also have limitations for measuring emigration and the observed differences are not solely due to the limitations of the IMDB and the criterion developed in this study.Note
First, IMDB numbers are compared with those of the RRC for the 1996, 2001, 2006, 2011 and 2016 censuses. This comparison, presented in the following chart, examines the consistency between the two sources in terms of emigration by recent immigrants. The RRC estimates permanent emigration on census day for recent immigrants,Note i.e., those admitted to the country within the past five years. For example, for the 2011 RRC, immigrants admitted between the 2006 and 2011 census days are at risk of emigrating and can be classified as emigrants if they emigrated between their admission day and May 10, 2011 (census day).

Data table for Chart A.3
| Intercensal period | Reverse Record Check | Longitudinal Immigration Database |
|---|---|---|
| percent | ||
| 1991/1996 | 3.6 | 3.9 |
| 1996/2001 | 1.7 | 3.2 |
| 2001/2006 | 3.5 | 2.8 |
| 2006/2011 | 5.0 | 2.7 |
| 2011/2016 | 2.1 | 2.8 |
|
Notes: RRC data show only permanent emigration. In addition, individuals classified as “out-of-scope” were removed from the analysis. The IMDB data were adjusted to account for the intercensal periods covering only part of the start and end years. Sources: Statistics Canada, Longitudinal Immigration Database and Reverse Record Check. |
||
Both sources suggest that the emigration rates of recent immigrants range from 1.7% to 5% for the periods from 1991/1996 to 20011/2016. The main differences observed between the two sources concern the 1996/2001 and 2006/2011 periods. In the first case, the IMDB reports a higher emigration rate than the RRC by 1.6 percentage points. Conversely, in 2006-2011, the IMDB reports a lower emigration rate than the RRC by about two percentage points.
Second, emigrants identified by the IMDB are compared with those estimated by Lebel (2015) using a residual method. This comparison captures the emigration of immigrants in cohorts admitted to the country prior to the first census. The IMDB data presented in the following chart take account of this situation.

Data table for Chart A.4
| Intercensal period | Residual method | Longitudinal Immigration Database |
|---|---|---|
| percent | ||
| 2001/2006 | 4.7 | 4.4 |
| 2006/2011 | 7.0 | 4.5 |
|
Notes: Only immigrants aged 20 years or older are included in the Lebel (2015) numbers presented in the chart. The IMDB data were adjusted to account for the intercensal periods covering only part of the start and end years. Sources: Statistics Canada, Longitudinal Immigration Database and Lebel (2015). |
||
For the 2001-2006 cycle, the emigration rates of immigrants who settled in the country prior to 2001 are very close for the two sources. However, for the 2006-2011 cycle, the emigration rate obtained by the IMDB is 2.5 percentage points lower than the rate computed by the residual method. The 2011 National Household Survey (NHS) may limit use of the residual method for 2006-2011 because it could slightly underestimate the number of immigrants (Statistics Canada 2015).Note
The RRC and residual method show an increase in the emigration of immigrants between 2001/2006 and 2006/2011. The IMDB appears to be less effective in capturing the increase in this phenomenon using the criterion established for this study. Instead, the IMDB numbers suggest stagnation in emigration.
Third, immigrants identified as emigrants by this study’s criterion are compared against the 2016 Census results through record linkage. Emigrants should not be enumerated because they are not in the country. The following table breaks down the target population for this study by emigrant status and whether they were enumerated in the 2016 Census.
| Emigrant status in the IMDB | Situation in the 2016 Census | Total | |
|---|---|---|---|
| Enumerated individual | Non-enumerated individual | ||
| Non-emigrant | 86.6 | 13.4 | 100.0 |
| Emigrant | 4.8 | 95.2 | 100.0 |
| Deceased | 2.7 | 97.3 | 100.0 |
|
Note: In this table, emigrants and deceased individuals consist exclusively of persons who emigrated or died between 1982 and 2010. Sources: Statistics Canada, Longitudinal Immigration Database and 2016 Census. |
|||
Overall, the match between the study’s definition of emigration and presence in the 2016 Census is very high. About 95% of emigrants in this study were not enumerated in 2016. Of those who were enumerated, more than 90% came from the “estimated emigration – admission group” category. Emigrants in this category account for 64.9% of all emigrants in this study. This result is somewhat to be expected considering that this emigration signal is somewhat less robust.
In contrast, almost 87% of the population classified as non-emigrants was enumerated. In practice, this percentage cannot reach 100% given that linkage rates are not 100% and that census undercoverage is higher for immigrants, especially for recent immigrants (Bérard-Chagnon et al. 2019).
Overall, the levels of immigrant emigraiton calculated using the IMDB and the criterion developed for this study are relatively consistent with those proposed by the RRC for recent immigrants and those of the residual method for immigrants from older cohorts. Moreover, a very strong match exists between the definition of emigration in this study and presence in the 2016 Census.
A.3. Conclusion
The definition of emigration used in this study was obtained indirectly from information available in tax returns. Assuming that dates of departure are the best signal of emigration but underestimate the phenomenon, the criterion developed here generally produces emigration levels closer to those expected. Indeed, emigration levels calculated using this definition are relatively similar to those obtained by the RRC and the residual method. In addition, the IMDB classification of immigrants is consistent with that of the 2016 Census. Consequently, these analyses suggest that it produces generally reasonable emigration numbers.
Appendix B
“Former USSR” countries are:
- Armenia
- Azerbaijan
- Belarus
- Estonia
- Georgia
- Kazakhstan
- Kyrgyzstan
- Latvia
- Lithuania
- Moldova
- Russian Federation
- Tajikistan
- Turkmenistan
- Ukraine
- Union of Soviet Socialist Republics
- Uzbekistan
“Former Yugoslavia” countries are:
- Bosnia and Herzegovina
- Croatia
- Kosovo
- Macedonia, Republic of
- Montenegro
- Serbia
- Serbia and Montenegro
- Slovenia
- Yugoslavia

Data table for Chart B.1
| Region of birth | After 5 years | After 10 years | After 20 years |
|---|---|---|---|
| percent | |||
| Other | 4.3 | 4.7 | 5.2 |
| Oceania | 12.0 | 7.0 | 7.1 |
| Southern Asia - Excluding India | 3.1 | 3.3 | 6.0 |
| Southern Asia - India | 4.3 | 3.7 | 5.2 |
| Southeastern Asia - Excluding Philippines | 3.4 | 2.8 | 9.4 |
| Southeastern Asia - Philippines | 2.4 | 2.1 | 3.4 |
| Eastern Asia - Excluding China | 7.2 | 11.0 | 11.4 |
| Eastern Asia - China | 5.4 | 7.2 | 9.3 |
| West and Central Asia | 5.1 | 6.7 | 8.4 |
| South Africa | 5.6 | 5.0 | 6.5 |
| Central Africa | 2.9 | 3.9 | 8.6 |
| North Africa | 4.6 | 5.5 | 9.6 |
| East Africa | 3.3 | 4.1 | 6.6 |
| West Africa | 3.1 | 4.5 | 8.1 |
| Southern Europe | 6.2 | 4.5 | 6.2 |
| Northern Europe | 11.0 | 6.5 | 7.6 |
| Eastern Europe | 3.7 | 3.5 | 5.2 |
| Western Europe | 12.1 | 8.1 | 8.8 |
| South America | 4.0 | 4.0 | 5.5 |
| Antilles and Bermuda | 3.0 | 3.1 | 5.1 |
| Central America | 4.0 | 3.5 | 4.9 |
| North America | 16.4 | 10.7 | 12.4 |
|
Note: The data presented are cumulative such that the sum of the blue and orange bars reflects cumulative probabilities of emigration after 10 years. Source: Statistics Canada, Longitudinal Immigration Database. |
|||
Appendix C
| Characteristic | Bivariate models | Multivariate model | ||||
|---|---|---|---|---|---|---|
| Coefficients | Standard errors | p values | Coefficients | Standard errors | p values | |
| probability | ||||||
| Sex | ||||||
| Male | 0.2414 | 0.0024 | <.0001 | 0.2183 | 0.0025 | <.0001 |
| Female | Ref. | Ref. | Ref. | Ref. | Ref. | Ref. |
| Age group at admission | ||||||
| 18 to 24 years | -0.1598 | 0.0041 | <.0001 | 0.1246 | 0.0045 | <.0001 |
| 25 to 29 years | 0.0417 | 0.0038 | <.0001 | 0.1028 | 0.0039 | <.0001 |
| 30 to 34 years | Ref. | Ref. | Ref. | Ref. | Ref. | Ref. |
| 35 to 39 years | -0.0659 | 0.0043 | <.0001 | -0.0922 | 0.0044 | <.0001 |
| 40 to 44 years | -0.0150 | 0.0048 | 0.0020 | -0.0961 | 0.0050 | <.0001 |
| 45 to 49 years | 0.0200 | 0.0057 | 0.0005 | -0.0982 | 0.0059 | <.0001 |
| 50 to 54 years | -0.0569 | 0.0070 | <.0001 | -0.1754 | 0.0072 | <.0001 |
| 55 to 59 years | 0.0227 | 0.0072 | 0.0017 | -0.1470 | 0.0077 | <.0001 |
| 60 to 64 years | 0.2593 | 0.0072 | <.0001 | -0.0032 | 0.0079 | <.0001 |
| 65 years or over | 0.6380 | 0.0058 | <.0001 | 0.2174 | 0.0069 | <.0001 |
| Intended province or territory of destination at admission | ||||||
| N.L. | 0.2136 | 0.0222 | <.0001 | 0.0257 | 0.0224 | 0.2519 |
| P.E.I. | 0.3216 | 0.0267 | <.0001 | 0.1552 | 0.0274 | <.0001 |
| N.S. | 0.4785 | 0.0106 | <.0001 | 0.0334 | 0.0108 | 0.0021 |
| N.B. | 0.2745 | 0.0164 | <.0001 | 0.0549 | 0.0167 | 0.0010 |
| Que. | 0.1011 | 0.0033 | <.0001 | -0.0492 | 0.0042 | <.0001 |
| Ont. | Ref. | Ref. | Ref. | Ref. | Ref. | Ref. |
| Man. | -0.2788 | 0.0083 | <.0001 | -0.0669 | 0.0087 | <.0001 |
| Sask. | -0.1520 | 0.0113 | <.0001 | -0.1201 | 0.0116 | <.0001 |
| Alta. | -0.1225 | 0.0047 | <.0001 | -0.1247 | 0.0048 | <.0001 |
| B.C. | 0.1709 | 0.0033 | <.0001 | -0.0999 | 0.0035 | <.0001 |
| Territories | -0.0544 | 0.0388 | 0.1614 | -0.3068 | 0.0392 | <.0001 |
| Marital status | ||||||
| Married | Ref. | Ref. | Ref. | Ref. | Ref. | Ref. |
| Common law | 0.1524 | 0.0084 | <.0001 | -0.1372 | 0.0087 | <.0001 |
| Never married (single) | 0.6020 | 0.0029 | <.0001 | 0.2774 | 0.0034 | <.0001 |
| Separated | 0.2252 | 0.0056 | <.0001 | 0.4204 | 0.0057 | <.0001 |
| Divorced | 0.3375 | 0.0060 | <.0001 | 0.2924 | 0.0062 | <.0001 |
| Widowed | 0.3528 | 0.0058 | <.0001 | 0.1899 | 0.0066 | <.0001 |
| Presence of a child in tax data | ||||||
| No | 1.4182 | 0.0024 | <.0001 | 1.3797 | 0.0029 | <.0001 |
| Yes | Ref. | Ref. | Ref. | Ref. | Ref. | Ref. |
| Country of birthTable C.1 Results of the probability to emigrate for immigrants from the bivariate models and the multivariate model, 1982 to 2017 Note 1 |
||||||
| China | Ref. | Ref. | Ref. | Ref. | Ref. | Ref. |
| India | -0.5121 | 0.0054 | <.0001 | -0.3297 | 0.0056 | <.0001 |
| Philippines | -1.0301 | 0.0073 | <.0001 | -0.8568 | 0.0081 | <.0001 |
| Pakistan and Bangladesh | -0.3008 | 0.0072 | <.0001 | -0.2656 | 0.0075 | <.0001 |
| Hong Kong | 0.3240 | 0.0054 | <.0001 | 0.2854 | 0.0059 | <.0001 |
| Former USSR | -0.6516 | 0.0089 | <.0001 | -0.7488 | 0.0091 | <.0001 |
| Iran | -0.2111 | 0.0079 | <.0001 | -0.3450 | 0.0081 | <.0001 |
| United Kingdom | 0.1238 | 0.0070 | <.0001 | 0.0431 | 0.0075 | <.0001 |
| Sri Lanka | -1.3305 | 0.0130 | <.0001 | -0.9617 | 0.0133 | <.0001 |
| United States | 0.7697 | 0.0060 | <.0001 | 0.6199 | 0.0067 | <.0001 |
| Viet Nam | -1.3417 | 0.0121 | <.0001 | -0.7064 | 0.0125 | <.0001 |
| Poland | -0.7131 | 0.0091 | <.0001 | -0.2795 | 0.0096 | <.0001 |
| South Korea | -0.0193 | 0.0089 | 0.0291 | -0.0017 | 0.0090 | 0.8547 |
| Lebanon | 0.2455 | 0.0078 | <.0001 | 0.3326 | 0.0086 | <.0001 |
| Former Yugoslavia | -0.6623 | 0.0114 | <.0001 | -0.4491 | 0.0117 | <.0001 |
| Romania | -0.4994 | 0.0112 | <.0001 | -0.6060 | 0.0116 | <.0001 |
| France | 0.6405 | 0.0079 | <.0001 | 0.3077 | 0.0094 | <.0001 |
| Jamaica | -0.8266 | 0.0126 | <.0001 | -0.6563 | 0.0131 | <.0001 |
| Taiwan | 0.6267 | 0.0074 | <.0001 | 0.4511 | 0.0079 | <.0001 |
| Morocco | -0.1599 | 0.0121 | <.0001 | -0.2263 | 0.0130 | <.0001 |
| Other countries in North America | 0.1462 | 0.0354 | <.0001 | -0.5287 | 0.0360 | <.0001 |
| Central America | -0.5709 | 0.0093 | <.0001 | -0.2044 | 0.0097 | <.0001 |
| Other Caribbean countries | -0.5796 | 0.0087 | <.0001 | -0.3802 | 0.0092 | <.0001 |
| South America | -0.4844 | 0.0072 | <.0001 | -0.3532 | 0.0076 | <.0001 |
| Other countries in Western Europe | 0.1210 | 0.0084 | <.0001 | 0.0551 | 0.0089 | <.0001 |
| Other countries in Northern Europe | 0.6358 | 0.0127 | <.0001 | 0.5682 | 0.0131 | <.0001 |
| Other countries in Southern and Eastern Europe | -0.1291 | 0.0075 | <.0001 | 0.0366 | 0.0078 | <.0001 |
| Africa (except Morocco) | -0.3314 | 0.0056 | <.0001 | -0.3084 | 0.0062 | <.0001 |
| Other countries in Central-Western Asia and Middle East | -0.1324 | 0.0067 | <.0001 | -0.0202 | 0.0071 | 0.0043 |
| Other countries in Eastern Asia | 0.3209 | 0.0124 | <.0001 | 0.1540 | 0.0126 | <.0001 |
| Other countries in Southern and Southeastern Asia | -0.4868 | 0.0103 | <.0001 | -0.3221 | 0.0105 | <.0001 |
| Oceania | 0.2804 | 0.0113 | <.0001 | 0.4292 | 0.0118 | <.0001 |
| Knowledge of official languages at admission | ||||||
| English only | Ref. | Ref. | Ref. | Ref. | Ref. | Ref. |
| French only | -0.2243 | 0.0061 | <.0001 | -0.1927 | 0.0074 | <.0001 |
| English and French | 0.3176 | 0.0042 | <.0001 | -0.0420 | 0.0055 | <.0001 |
| Neither English nor French | -0.3817 | 0.0028 | <.0001 | -0.2042 | 0.0035 | <.0001 |
| Admission category | ||||||
| Skilled Workers | Ref. | Ref. | Ref. | Ref. | Ref. | Ref. |
| Canadian Experience Class | 0.3812 | 0.0138 | <.0001 | -0.0122 | 0.0150 | 0.4169 |
| Provincial and Territorial Nominees | -0.2650 | 0.0084 | <.0001 | -0.1727 | 0.0096 | <.0001 |
| Caregivers | -1.1851 | 0.0116 | <.0001 | -0.7706 | 0.0127 | <.0001 |
| Entrepreneurs | 0.3260 | 0.0058 | <.0001 | 0.5192 | 0.0063 | <.0001 |
| Self-Employed | 0.0351 | 0.0109 | 0.0013 | 0.0352 | 0.0112 | 0.0017 |
| Investors | 0.6806 | 0.0059 | <.0001 | 0.7465 | 0.0067 | <.0001 |
| Refugees | -0.8511 | 0.0046 | <.0001 | -0.5312 | 0.0053 | <.0001 |
| Immigrants Sponsored by Family | -0.3789 | 0.0028 | <.0001 | -0.3320 | 0.0035 | <.0001 |
| Others | 0.0860 | 0.0083 | <.0001 | -0.1444 | 0.0088 | <.0001 |
| Level of education at admission | ||||||
| 0 to 12 years of schooling | Ref. | Ref. | Ref. | Ref. | Ref. | Ref. |
| 13 or more years of schooling | 0.3235 | 0.0043 | <.0001 | 0.1854 | 0.0045 | <.0001 |
| Trade certificate | 0.1718 | 0.0046 | <.0001 | 0.0648 | 0.0048 | <.0001 |
| Non-university diploma | 0.2746 | 0.0045 | <.0001 | 0.1047 | 0.0048 | <.0001 |
| Bachelor's degree | 0.4595 | 0.0032 | <.0001 | 0.3164 | 0.0038 | <.0001 |
| Master's degree | 0.8177 | 0.0043 | <.0001 | 0.4978 | 0.0050 | <.0001 |
| Doctorate | 1.0070 | 0.0077 | <.0001 | 0.5882 | 0.0082 | <.0001 |
| Non-permanent resident status before admission | ||||||
| No non-permanent resident permit | Ref. | Ref. | Ref. | Ref. | Ref. | Ref. |
| Work permit | 0.1347 | 0.0050 | <.0001 | -0.0659 | 0.0054 | <.0001 |
| Study permit | 0.7184 | 0.0059 | <.0001 | 0.1051 | 0.0063 | <.0001 |
| Work and study permits | -0.0416 | 0.0033 | <.0001 | -0.0215 | 0.0038 | <.0001 |
| Asylum claimant | -0.1716 | 0.0110 | <.0001 | -0.0857 | 0.0112 | <.0001 |
| Immigration cohort | ||||||
| 1982 | -0.4774 | 0.0114 | <.0001 | -0.2605 | 0.0119 | <.0001 |
| 1983 | -0.5437 | 0.0126 | <.0001 | -0.2602 | 0.0130 | <.0001 |
| 1984 | -0.5477 | 0.0126 | <.0001 | -0.2411 | 0.0130 | <.0001 |
| 1985 | -0.5021 | 0.0127 | <.0001 | -0.2359 | 0.0131 | <.0001 |
| 1986 | -0.5081 | 0.0121 | <.0001 | -0.2362 | 0.0125 | <.0001 |
| 1987 | -0.4245 | 0.0107 | <.0001 | -0.2178 | 0.0111 | <.0001 |
| 1988 | -0.3143 | 0.0105 | <.0001 | -0.1141 | 0.0109 | <.0001 |
| 1989 | -0.2719 | 0.0101 | <.0001 | -0.0101 | 0.0105 | 0.3379 |
| 1990 | -0.2182 | 0.0098 | <.0001 | 0.0279 | 0.0102 | 0.0063 |
| 1991 | -0.2276 | 0.0097 | <.0001 | 0.0565 | 0.0101 | <.0001 |
| 1992 | -0.2048 | 0.0096 | <.0001 | 0.0484 | 0.0100 | <.0001 |
| 1993 | -0.1590 | 0.0096 | <.0001 | 0.0713 | 0.0099 | <.0001 |
| 1994 | -0.0551 | 0.0098 | <.0001 | 0.1252 | 0.0101 | <.0001 |
| 1995 | -0.0941 | 0.0100 | <.0001 | 0.0957 | 0.0103 | <.0001 |
| 1996 | -0.0572 | 0.0099 | <.0001 | 0.0839 | 0.0102 | <.0001 |
| 1997 | -0.0505 | 0.0100 | <.0001 | 0.0796 | 0.0103 | <.0001 |
| 1998 | -0.1242 | 0.0107 | <.0001 | 0.0271 | 0.0109 | 0.0131 |
| 1999 | -0.0851 | 0.0105 | <.0001 | 0.0381 | 0.0107 | 0.0004 |
| 2000 | -0.0916 | 0.0102 | <.0001 | 0.0409 | 0.0104 | <.0001 |
| 2001 | -0.0648 | 0.0100 | <.0001 | 0.0572 | 0.0103 | <.0001 |
| 2002 | -0.0340 | 0.0103 | 0.0009 | 0.0881 | 0.0105 | <.0001 |
| 2003 | -0.0735 | 0.0105 | <.0001 | 0.0511 | 0.0107 | <.0001 |
| 2004 | -0.0298 | 0.0104 | 0.0042 | 0.0550 | 0.0106 | <.0001 |
| 2005 | -0.0434 | 0.0104 | <.0001 | 0.0470 | 0.0105 | <.0001 |
| 2006 | 0.0185 | 0.0105 | 0.0776 | 0.0672 | 0.0106 | <.0001 |
| 2007 | 0.0377 | 0.0108 | 0.0005 | 0.0425 | 0.0109 | <.0001 |
| 2008 | 0.0696 | 0.0108 | <.0001 | 0.0408 | 0.0109 | 0.0002 |
| 2009 | 0.0335 | 0.0111 | 0.0025 | 0.0175 | 0.0111 | 0.1154 |
| 2010 | Ref. | Ref. | Ref. | Ref. | Ref. | Ref. |
| 2011 | -0.0491 | 0.0121 | <.0001 | -0.0486 | 0.0122 | <.0001 |
| 2012 | 0.0146 | 0.0122 | 0.2323 | -0.0234 | 0.0123 | 0.0580 |
| 2013 | 0.0565 | 0.0126 | <.0001 | 0.0078 | 0.0128 | 0.5444 |
| 2014 | -0.1001 | 0.0142 | <.0001 | -0.1441 | 0.0146 | <.0001 |
| 2015 | -0.1786 | 0.0162 | <.0001 | -0.2058 | 0.0164 | <.0001 |
| 2016 | -0.0603 | 0.0180 | 0.0008 | -0.1276 | 0.0182 | <.0001 |
| 2017 | 0.1308 | 0.0225 | <.0001 | -0.0171 | 0.0229 | 0.4560 |
| Number of years since admission | ||||||
| 0 to 4 years | Ref. | Ref. | Ref. | Ref. | Ref. | Ref. |
| 5 to 9 years | 0.1292 | 0.0030 | <.0001 | 0.2363 | 0.0032 | <.0001 |
| 10 to 14 years | -0.1674 | 0.0036 | <.0001 | 0.0192 | 0.0039 | <.0001 |
| 15 to 19 years | -0.2819 | 0.0043 | <.0001 | -0.0317 | 0.0046 | <.0001 |
| 20 years or more | -0.3597 | 0.0043 | <.0001 | 0.0237 | 0.0049 | <.0001 |
| Number of observations | Note ...: not applicable | Note ...: not applicable | Note ...: not applicable | Note ...: not applicable | Note ...: not applicable | 75,196,174 |
| Pseudo R-square | Note ...: not applicable | Note ...: not applicable | Note ...: not applicable | Note ...: not applicable | Note ...: not applicable | 7.5% |
... not applicable
|
||||||
- Date modified: