
Demographic Documents
The Canadian diaspora: Estimating the number of Canadian citizens who live abroad
Skip to text
Text begins
Acknowledgements
Calculating estimates of the number of Canadian citizens who live abroad is a very challenging project. The authors would therefore like to thank several people for their significant contributions to this project.
First, we would like to give our most sincere thanks to Daphné Allard Gervais, who started the work on the Canadian diaspora during her time at Statistics Canada’s Centre for Demography. We would also like to thank Iuliia Bilan, who helped develop the fertility parameters thanks to her work on male fertility to obtain her master’s degree in demography at the Université de Montréal.
We would also like to thank Mélanie Meunier, Martin St-Pierre, Anna Mao, Stacey Hallman and Nicole Montsion, who worked on the issues concerning the acquisition and transmission of Canadian citizenship for the emigration and fertility assumptions as well as on data acquisitions.
The preliminary versions of this study benefited from the insightful comments of Patrice Dion, Hubert Denis and Laurent Martel.
Lastly, we would like to thank Carol D’Aoust for all the document formatting work and Statistics Canada’s translation team for the translation of this study from French into English.
Highlights
- According to the “medium numbers” scenario developed during this study, 4,038,700 Canadian citizens were living abroad in 2016. This number may vary between 2,953,500 and 5,549,800 people based on the “low numbers” and “high numbers” scenarios, which differ from the medium scenario because of different assumptions for emigration and the transmission of citizenship to children born abroad.
- Around half of Canadian citizens living abroad are Canadian citizens by descent, that is, they were born abroad to citizen parents from whom they obtained their citizenship. Citizens by birth born in Canada appear to make up around one-third of the diaspora, while naturalized citizens appear to represent around 15% of the diaspora.
- The age structure of the diaspora appears to be a bit older than that of the Canadian population, mainly because of the incomplete transmission of citizenship to people born abroad of Canadian parents and the contribution of emigration to the diaspora.
- The diaspora appears to be made up of a rather similar number of men and women.
List of acronyms
ACS = American Community Survey.
APFC = Asia Pacific Foundation of Canada.
CCB = Canada Child Benefit.
CTB = Canada Child Tax Benefit.
DEP = Demographic Estimates Program.
EC = Error of closure.
FAP = Family Allowance Program.
GAC = Global Affairs Canada.
IRCC = Immigration, Refugees and Citizenship Canada.
NHS = National Household Survey.
NPR = Non-permanent residents.
OECD = Organisation for Economic Co-operation and Development.
RRC = Reverse Record Check.
SGMUS = Survey of 1995 Graduates Who Moved to the United States.
TFR = Total fertility rate.
UN = United Nations.
Introduction
Developments in technologies and modes of transportation, globalization as well as various international crises have contributed to the increase in international migration around the world. In addition, climate change may also cause upward pressure on migration in the future. Canada is not immune to all these trends.
Although Canada is often seen as a country of immigration, thousands of Canadians leave the country each year to settle abroad. Over time, the total number of these emigrants means that a significant number of Canadians now live abroad.
The presence of Canadians around the world raises various issues. While these Canadians act as bridges to promote exchanges between Canada and the rest of the world, the Canadian government continues to have certain responsibilities to its nationals abroad and must provide them with certain services.
For three decades, the issues concerning the Canadian diasporaNote have focused on the departure of highly skilled workers.Note Several studies have shown that these emigrants have different characteristics from those of the Canadian population. In particular, they are younger, earn higher incomes, are more educated and often work in fields that require a high level of skill (Dion and Vézina 2010, Finnie 2006, Zhao et al. 2000). The departure of people with these characteristics raises concerns about the loss of significant economic potential and the retention of a highly skilled workforce for the country of origin (Dumont and Lemaître 2006).
Canadian citizens who live abroad have many rights (Chant 2006). They can notably return to settle permanently in Canada if they want. The Canadian government also must assist its nationals abroad. The costs associated with these services, and at certain times, the right to these services themselves, occasionally raises questions. From 1993 to 2003, the number of cases handled by consular services increased by 7.5% per year on average (Asia Pacific Foundation of Canada 2011).
Canadian government assistance to nationals also includes the possibility of being evacuated during an emergency or being transferred to Canada to serve a prison sentence. For example, in 2006, the evacuation of 15,000 Canadian citizens because of the armed conflict in Lebanon reportedly cost the Canadian government $94 million (Chant 2006). Although they are quite rare, evacuations of this scale often make the headlines and highlight the issues associated with the benefits and costs of government assistance to Canadian citizens living abroad. These responsibilities also resurfaced during the COVID-19 pandemic following the severe border restrictions around the world and government appeals for Canadians abroad to return to the country.
Alongside these issues, the international migratory dynamics of the Canadian population are becoming more complex. Emerging phenomena like the increase of international student migration, the rise in transnationalism and the diversification of destination countries for Canadian emigrants have been gradually repainting the portrait of the Canadian diaspora. Demographic projections suggest that these trends may continue over the coming decades (Sirag and Dion 2020).
A growing number of countries are developing strategies to maintain ties with their nationals abroad and, in some cases, promote their return to their country of origin (Agunias and Newland 2012, OECD 2015), particularly in a context of labour shortages. This heightened interest in diasporas is accompanied by a growing need for accurate statistics on this population (University of Oxford 2008).
Despite the growing significance of these issues, few studies have sought to estimate the size and characteristics of the Canadian diaspora. The numerous challenges associated with accurately measuring emigration and the significant conceptual differences in international data mean that the few sources that are currently available to provide very different numbers.
The goal of this study is to calculate an estimate of the number of Canadian citizens who live abroad in order to help fill this statistical gap. This estimate is calculated using a complex demographic method that consists of incorporating data from a large number of sources over several decades to estimate the contribution of various demographic events that influence the size of this population.
The following section reviews the data sources currently available that report on the size of the Canadian diaspora. Then, the relevant concepts and an overview of the methodology developed in this study are introduced. The next sections detail how each demographic event that influences the size of the diaspora, such as emigration and mortality, are considered. The last two sections present the results of the study and a series of consistency and sensitivity analyses that were conducted to test the main assumptions of the demographic model.
1. Background
Despite the significance of the issues associated with the Canadian diaspora, few data sources report the size and characteristics of this population. As a result, a relatively limited number of studies have addressed this topic. This section presents the available data and their advantages and limitations.
In general, there are two main approaches to measuring the size of this population (UNECE 2011). The first approach, known as the “country of origin approach,” involves examining Canadian data sources to estimate the number of Canadians who have emigrated from the country. This approach has the advantage of using Canadian concepts, but it tends to be limited by issues related to how emigration is measured. In fact, since reporting departures from Canada is not mandatory, few Canadian data sources provide an accurate measurement of the phenomenon (Bérard-Chagnon 2018). The other approach, known as the “country of destination approach,” involves examining data from the countries where Canadians have settled. This approach may provide a higher coverage of Canadians who live abroad, but it is limited by other countries’ use of concepts and data and by the effort required to access databases in these countries. While both these approaches have their strengths and weaknesses, they provide valuable additional data on the Canadian diaspora.
United Nations (UN) and Asia Pacific Foundation of Canada (APFC) statistics are the two main sources currently available for measuring the size of the Canadian diaspora. These sources provide the most plausible numbers compared with the concepts that they seek to measure. Three other Canadian sources (the data on passports issued, the International Register of Electors, and the Registration of Canadians Abroad system) also provide figures of Canadians who live abroad. However, their numbers are considerably lower than those of the UN or APFC. The World Bank and the Organization of Economic Cooperation and Development (OECD) also provide measurements of the size in numbers of the Canadian diaspora, but their approaches are overall similar to that of the UN.
1.1 United Nations method
The UN Statistics Division publishes statistics on the numbers of international migrants. These data have been published regularly since 1960. This study relies on the data from the 2017 version.Note These data are drawn from censuses, population registers and surveys in countries around the world (United Nations 2017). The UN defines a migrant as someone who does not live in their country of birth. These data are disseminated in tables and are broken down by either country of origin and country of destination or by broad age group and sex.
The major strength of this database is its completeness. By using the data from each country (country of destination approach), it shows the Canadian-born population that lives all around the world. This approach also reveals the countries where a large number of people born in Canada live. Another important feature of this database is that it is regularly updated, which means that trends can be observed over several years.
The main shortcoming of these data is in the sole use of the country of birth to characterize migrants.Note It therefore does not consider two other groups of Canadian citizens: 1) naturalized citizens and 2) citizens by descent (the descendants of Canadian citizens who were born abroad). This limitation is especially significant for countries where a significant number of naturalized Canadian citizens or citizens by descent live, such as Hong Kong or the United States. For example, around 250,000 Canadian citizens live in Hong Kong according to passport renewal data from the Consulate General of Canada in Hong Kong (DeVoretz and Battisti 2009), compared with less than 15,000 according to the UN. The gap between these two figures is because of naturalized Canadian citizens, since less than 20% of Canadian citizens who live in Hong Kong were born in Canada (Zhang and DeGolyer 2011). Consequently, the UN figures represent a lower limit of the possible number of Canadian citizens who live abroad.
Aside from the issues surrounding the definition of a migrant, the quality of data from the UN database naturally relies on the quality of the data from each country. However, the quality, availability and timeliness of data vary from one country to the next. International migrants tend to be especially difficult to count, even when dealing with developed countries where many Canadians can reside, like the United States (Jenson et al. 2015). In addition, these estimates often rely on censuses conducted in the destination countries and the frequency at which these censuses are taken. The UN uses interpolation and extrapolation techniques to cover the periods for which data for certain countries are missing. This adds a degree of uncertainty to these statistics.
The following table uses UN data and shows the progression of the Canadian-born population living abroad from 1990 to 2017 for certain destination countries.
| Countries | 1990 | 1995 | 2000 | 2005 | 2010 | 2015 | 2017 |
|---|---|---|---|---|---|---|---|
| number | |||||||
| Total | 997,144 | 1,067,801 | 1,146,883 | 1,187,046 | 1,268,970 | 1,313,217 | 1,359,585 |
| United States | 744,830 | 793,278 | 841,612 | 842,344 | 868,967 | 864,806 | 893,491 |
| United Kingdom | 63,555 | 66,277 | 70,115 | 70,642 | 76,921 | 87,086 | 91,545 |
| Australia | 27,452 | 27,916 | 30,240 | 36,270 | 44,540 | 54,034 | 56,651 |
| France | 16,520 | 17,054 | 17,588 | 22,661 | 23,794 | 26,180 | 26,128 |
| Italy | 10,188 | 8,234 | 6,280 | 15,908 | 25,536 | 25,540 | 25,989 |
| Rest of the world | 134,599 | 155,042 | 181,048 | 199,221 | 229,212 | 255,571 | 265,781 |
|
Note: The five countries shown here are those with the highest numbers of Canadians in 2017. Source: UN (2017). |
|||||||
According to the UN, around 1.3 million people born in Canada were living abroad in 2017. This number represents a nearly 36% increase over the 1990 estimate. The United States is by far the main destination country for Canadian emigrants. However, destination countries are becoming more diverse. In 2017, two-thirds of the Canadian-born population who lived abroad were in the United States, compared with close to 75% in 1990.
The UN also produces tables based on country of citizenship.Note However, information for many countries, including the United States, is missing. Furthermore, the data for some countries where many Canadian citizens live are not very current (1999 for Australia and 2009 for France). Based on these data, slightly fewer than 300,000 Canadian citizens live abroad, a figure that is not plausible at all.
1.2. Asia Pacific Foundation of Canada method
The APFC has extensively studied the issues concerning the Canadian diaspora in the first decade of the 2000s. According to their calculations, the size of the Canadian diaspora was around 2.7 million people in 2001 (Zhang 2006).
The APFC defines the diaspora as Canadian citizens (either by birth or naturalized) who have been living abroad for one year or more. The APFC used a residual methodNote based on censuses from 1941 to 2001 to approximate the number of Canadian citizens who emigrated from Canada. Afterwards, they applied mortality rates to this number, assuming that the mortality of emigrants is the same as that of the Canadian population.
The APFC’s work is an interesting starting point for measuring the size of the Canadian diaspora. This estimate is also independent of the UN’s.
However, it has some weaknesses. The main drawback is that their method excludes citizens by descent if they never lived in Canada. In addition, the APFC method only considers migrations in the last 60 years, which may not be long enough to include all emigrants who were still alive in 2001. For example, an emigrant who was born in 1925 and emigrated in 1936 would have been 76 years old in 2001. This person may still have been alive, yet not considered by the APFC because the method only starts with 1941.
It is unclear whether the APFC numbers are more likely to overestimate or underestimate the population that they target, since the strengths and weaknesses of the method may favour both underestimation and overestimation.
DeVoretz (2009), also from the APFC, assessed the calculations of Zhang (2006). He estimated the size of the Canadian diaspora at 2.8 million people in 2006 and concluded that Zhang’s estimates are plausible. However, a major shortcoming of this assessment is the use of methods similar to those of Zhang, which meant that the consistency between the two studies could be partially artificial.
To our knowledge, the APFC has not made any more recent estimates.
1.3. Data on passports issued
Immigration, Refugees and Citizenship Canada (IRCC) is responsible for passport services. Passports issued abroad are an indicator of the number of Canadian citizens who live abroad in that they can eventually obtain or renew their Canadian passports. Public data show that 962,792 passports and other travel documents were issued between April 2015 and March 2019 by the Government of Canada offices delivering passports abroad and by mail to the United States.Note
An interesting advantage of these data compared with other sources is that they can report citizens by descent. However, these data have two notable drawbacks. First, some citizens who live abroad may not have a valid Canadian passport, particularly if they have a passport for another nationality, or have no intention of visiting or living in Canada. Second, passports can be valid for a maximum of 10 years. The available table only covers four years, so it omits several passport renewals. Conversely, a table that covers a longer period may include several renewals for the same person.
1.4. Registration of Canadians Abroad service
Canadian citizens who are travelling or who live abroad may register in the Registration of Canadians Abroad service on the Global Affairs Canada (GAC) site.Note This free and optional service allows registered people to receive government communications in case of emergency, like a natural disaster or civil unrest.
An extraction done specifically for Statistics Canada reported that 235,686 Canadian citizens declared being abroad to GAC on October 29, 2019. The five countries with the highest numbers of Canadian citizens were Paraguay (14,051), the United States (11,013), China (8,582), Lebanon (8,402) and the United Kingdom (7,681). These countries reflect both the countries where there appears to be a higher number of Canadians and where emergency risks are higher. Paraguay appears among the top five countries in the register because certain Mennonite communities alternate between this country and Canada and have many members listed in the register.
For this present study, the database has two major drawbacks. First, since registration is optional, it is expected that many people abroad will not register, which leads to a very significant underestimation of the real number of Canadians abroad. Second, since this service is intended for travellers and emigration is a much rarer phenomenon than travelling abroad, this database mainly contains travellers who are temporarily absent and whose usual place of residence remains in Canada.
These numbers don’t represent a plausible estimate of the diaspora and reflect the optional nature of registering.
1.5. International Register of Electors
The International Register of Electors is a database managed by Elections Canada that contains Canadian electors living outside the country who have requested to vote by special mail-in ballot.Note The two criteria to be included in the register are 1) be a Canadian citizen at least 18 years of age on polling day and 2) have lived in Canada at some point in your life.
A recent extraction (2019) for Statistics Canada reported that 83,774 people were in the register. According to these data, the five countries with the most Canadian citizens were the United States (28,993), Canada (14,695), the United Kingdom (8,459), Australia (3,288) and Hong Kong (3,090). These countries reflect the main countries of residence of Canadian citizens who live abroad. People in the register whose country of residence is Canada are mainly GAC employees who are temporarily stationed abroad. It must be noted that before January 2019, only people who were abroad for less than five years were eligible to vote during a federal election.
Like the Registration of Canadians Abroad service, the numbers of the International Register of Electors do not represent a plausible estimate of the diaspora because of the optional nature of registration.
1.6. World Bank and Organization of Economic Cooperation and Development
The World Bank and OECD also have databases on the stocks of international migrants by country of origin and destination. In both cases, they use approaches that are similar overall to the UN’s, compiling information from censuses and population registers from around the world and by calculating adjustments when the data are not available. As a result, these data tend to have strengths and weaknesses that are alike to those of the UN.
The World Bank’s Global Bilateral Migration DatabaseNote provides estimates on the Canadian diaspora that are overall close to those of the UN. This database suggests that the numbers were 1,143,607 people in 1990 and 1,255,438 people in 2000, which represent discrepancies of 15% and 9%, respectively, from the UN’s figures. The timeliness of the World Bank’s data by country of origin and of destination is a significant limitation of these data; the most recent data are from 2000.
The OECD International Migration DatabaseNote contains only information on OECD countries. As a result, the numbers it provides for people born in Canada and who live abroad are lower than those of the UN and the World Bank. The OECD reported that in 2017, the size of the Canadian diaspora in other OECD countries was 1,041,866, compared with 1,313,215 people according to the UN. Some OECD data also reveal the country of citizenship. According to these data, 531,291 Canadian citizens were living in other OECD countries in 2017, a number that is far too low to be plausible. The OECD data examine some socioeconomic characteristics of migrants, including education. The availability of these characteristics can enrich the study of the Canadian diaspora, but is not very relevant for estimating its size.
1.7. Summary of available sources
The following table compares the main characteristics of all the data sources that were just presented.
| Characteristics | United Nations (international migrant stocks) | United Nations (countries of citizenship) | Asia Pacific Foundation of Canada | Data on passports issued | International Register of Electors | Registration of Canadians Abroad service | World Bank | Organization for Economic Cooperation and Development (country of birth) | Organization for Economic Cooperation and development (country of citizenship) |
|---|---|---|---|---|---|---|---|---|---|
| General approach | Country of destination | Country of destination | Country of origin | Country of origin | Country of origin | Country of origin | Country of destination | Country of destination | Country of destination |
| Data sources | Censuses, population registers and surveys | Censuses, population registers and surveys | Censuses and life tables | Immigration, Citizenship and Refugees Canada | Elections Canada | Global Affairs Canada | Censuses, population registers and surveys | Censuses, population registers and surveys | Censuses, population registers and surveys |
| Concept of migrant | Country of birth | Country of citizenship | Country of citizenship | Country of citizenship | Country of citizenship | Country of citizenship | Country of birth | Country of birth | Country of citizenship |
| Universe | Every country in the world | Only countries that have data on citizenship | Emigrants from 1941 to 2001 who were alive in 2001 | Citizens who apply for or renew their passports while abroad | Citizens abroad who are on the register | Citizens abroad who are on the register | Every country in the world | Only OECD countries | Only OECD countries that have data on citizenship |
| Most recent reference date | 2020 | 2017 | 2006 | 2019 | Variable | Variable | 2000 | 2017 | 2017 |
| Number of Canadian citizens who live abroad | 1,350,000 (2017) | 300,000 | 2,733,000 (2001) and 2,781,000 (2006) |
962,700 | 83,800 | 236,000 | 1,250,000 | 1,000,000 | 500,000 |
2. Methodology for estimating the number of Canadian citizens who live abroad
This section presents the method developed in this study to estimate the size of the Canadian diaspora. It is divided into four parts: the definition of the diaspora used in this study, the description of the strategy for estimating the size of the diaspora, the description of the approach used to evaluate the uncertainty inherent in the study and the presentation of assumptions for the three scenarios developed to address this uncertainty.
2.1 Definition of the Canadian diaspora in this study
To our knowledge, there is no official definition of the diaspora. The literature on the subject proposes a range of definitions that vary based on the specific objectives of each study. In this project, the Canadian diaspora is defined as the number of Canadian citizens whose usual place of residence is not in Canada. As a result, the concepts of Canadian citizenship and usual place of residence are central to establishing this criterion.
This definition was chosen for three main reasons. First, as mentioned in the introduction, Canadian citizenship is an important and measurable relationship had by members of the diaspora with Canada. Second, not considering Canada as their usual place of residence is a strong signal that people no longer live in Canada. Third, this definition can be applied in practice, since several Canadian databases, namely the censuses, report on citizenship and usual place of residence.
2.1.1 Canadian citizenship
Sections 3 and 4 of the Citizenship Act of Canada define the concept of Canadian citizenship. Under the act, a person can become a Canadian citizen in the following ways:Note
- be born in Canada, except if the parents are accredited foreign diplomats (jus soli);
- obtain citizenship through the naturalization process (permanent resident who obtains citizenship);
- be born abroad to a parent who is a Canadian citizen at the time of birth (jus sanguinis for the first generation born abroad);
- be born abroad between January 1, 1947 and April 16, 2009, to a parent who is a Canadian citizen who was also born abroad to a parent who is a Canadian citizen (jus sanguinis for the second generation born abroad);
- be adopted abroad by a parent who is a Canadian citizen after January 1, 1947.
Many amendments have been made to the Citizenship Act over time. Two amendments concerning persons born abroad to Canadian parents have received special attention in this study. First, from 1947 to 2009, Canadian citizenship could be transmitted up to the second generation of children born or adopted abroad. Since 2009, only the first generation born or adopted abroad can apply for Canadian citizenship by jus sanguinis. Then, from 1947 to 1977, children born abroad can only acquire citizenship if their birth was registered within two years. From 1977 to 2009, children from the second generation or subsequent generations born abroad had to apply for citizenship before the age of 28. This rule was eliminated in 2009. The section of fertility assumptions describes how these changes were considered in this study.
2.1.2 Usual place of residence
Canadian censuses define the usual place of residence as the dwelling in which the person usually lives.Note The census specifies this definition for certain residential situations that are more complex. Thus, the usual place of residence for people with a residence in Canada and a residence abroad is the one in Canada. Employees of the Canadian government, including personnel of the Canadian Armed Forces, who live abroad are included in the census at their last permanent address or the one they provided for elections.
A notable corollary of using this definition is that Canadians who have travelled and who have not changed their usual place of residence, like a trip or pilgrimage, are not included in the Canadian diaspora.
2.2 Estimation methodology
By using the definition of Canadian diaspora that was just introduced, it is possible to divide the number of Canadian citizens who live abroad into three groups: 1) citizens by birth born in Canada, 2) naturalized citizens and 3) citizens by descent (citizens by birth born abroad). This distinction is important for three reasons. First, the issue of measuring the number of Canadian citizens who live abroad differs from group to group. Second, some sources like the UN or the APFC do not provide a measurement for these three groups. This situation must be considered when comparing these sources. Third, breaking the overall number down into three groups allows for a better understanding of the processes by which the size of the diaspora has grown over time.
This document provides estimates of the number of Canadian citizens who live abroad calculated by adapting the component method (Statistics Canada 2016). Instead of using data from a census or another similar source as a starting point, this approach begins with a zero size in 1921. Then, the size of the diaspora is determined by isolating and modelling all the demographic events that influence its size. Five events need to be modelled: emigration, fertility (and the transmission of citizenship to children born abroad), mortality, returning emigration and the loss of Canadian citizenship. The people who experienced these events are gradually added or removed from the Canadian diaspora from 1921 to 2016 to provide an estimate of the size in numbers of the diaspora in 2016. The period from 1921 to 2016 is assumed to be long enough to cover all Canadian citizens who lived abroad in 2016. This variation in the component method is similar to the techniques often used to estimate the coverage of censuses, notably in the United States (Robinson 2010).
Chart 1 presents a diagram that illustrates the demographic events that must be considered to calculate this number and the iterative aspect of this exercise.

Data table for Chart 1
To calculate the number of Canadian citizens abroad at time t, we must take the number of citizens residing abroad at time t-1 and add the citizens who can enter the Canadian diaspora. This can happen in two ways (green box): they can emigrate from Canada or be born (or adopted) abroad to Canadian parents from whom they received citizenship. Conversely, members of the diaspora who die, return to live in Canada or lose their Canadian citizenship must be removed (orange box).
Canadian citizens can enter the Canadian diaspora in two ways (green box): they can emigrate from Canada or they can be born (or adopted) abroad to Canadian parents from whom they receive citizenship. Conversely, members of the diaspora can leave by dying, returning to live in Canada or by losing their Canadian citizenshipNote (orange box).
The two main advantages of this method are that it provides a rigorous conceptual framework of all the factors that influence the size of the diaspora and it allows for various sensitivity scenarios to be developed by varying the assumptions made for each component.
However, it has notable drawbacks. Many data sources need to be analyzed, the quality and consistency of which are not always ideal, and various models must be developed to estimate each component separately over a timespan that is close to a century. Furthermore, this approach is largely based on Canadian data, which generally do not include information on the country of residence for members of the diaspora. Another drawback is that a small number of very elderly Canadian citizens who live abroad are not covered by the 1921 to 2016 period if they emigrated before 1921 or if they were born to parents who emigrated before this date.
2.3 Accounting for uncertainty
Like any statistical study, estimating the number of Canadian citizens who live abroad has a certain degree of uncertainty. The uncertainty is even greater because the method developed here is an indirect approach that relies on incorporating several data sources over a period of close to a century.
The approach used in this study to account for uncertainty is inspired by good practices proposed by the United Nations in chapter 4 of the document Recommendations on Communicating Population Projections (United Nations 2018). Several of the practices suggested in this document have proven to be very relevant to communicating the inherent uncertainty of this study. The following practices were adopted in this study:
- The main strengths and weaknesses of the data sources and techniques used are described explicitly;
- The main assumptions underlying the estimate of each demographic phenomenon are detailed explicitly;
- Where possible, various assumptions (low, medium and high) are developed for demographic events considered to be the most uncertain. This allows for various scenarios to be developed (and thus obtain intervals instead of a single figure) and conduct sensitivity analyses;
- Several Statistics Canada experts were consulted at different times in the project’s development;
- The results obtained are compared with those of other sources while considering the drawbacks of these sources to evaluate their consistency.
2.4 Assumptions and scenarios selection
Three scenarios, all deemed to be plausible, were developed as part of this study to address the uncertainty inherent in this study. The following table provides a summary of the assumptions made to develop each scenario.
| Components | Scenarios | ||
|---|---|---|---|
| Low numbers |
Medium numbers |
High numbers |
|
| Emigration | Low emigration | Medium emigration | High emigration |
| Fertility | Low fertility | Medium fertility | High fertility |
| Mortality | Medium mortality | Medium mortality | Medium mortality |
| Returning emigration | Medium returning emigration | Medium returning emigration | Medium returning emigration |
| Loss of citizenship | No loss of citizenship | No loss of citizenship | No loss of citizenship |
The three scenarios developed in this study are distinguished by the assumptions concerning emigration and fertility. These two components of demographic growth are considered to be the most uncertain. The assumptions concerning each demographic event are detailed in the following sections.
3. Emigration
Each year, several thousand Canadian citizens leave Canada to settle abroad. Emigration is one of the main contributors to the size of the Canadian diaspora.
Emigration is a demographic event that is difficult to measure accurately, since it is not mandatory for Canadian citizens to report their departure from the country. As a result, few data sources directly report on this phenomenon (Bérard-Chagnon 2018). The studies that examine this topic must rely on limited data sources or indirect methods. One consequence of this situation is that the proposed numbers of emigrants may vary significantly based on the approach used.
Three assumptions on emigration were developed. They were obtained in two stages. First, estimates of the number of emigrants were calculated by relying on a study by Statistics Canada (George 1976) and on the estimates of the Demographic Estimates Program (DEP). Then, Canadian citizenship rates were calculated using various sources and applied to the number of emigrants. The assumptions about emigration were divided into two periods, 1921 to 1970 and 1971 to 2016, because of differences in availability and data collection methods. The three emigration assumptions are summarized in the following table.
| Steps | Periods | Low emigration | Medium emigration | High emigration |
|---|---|---|---|---|
| Estimate of the number of emigrants |
1921 to 1970 | George (1976) | ||
| 1971 to 2016 | Emigration estimates and 33% error of closure | Emigration estimates and 67% error of closure | Emigration estimates and 100% error of closure | |
| Citizenship rates of emigrants |
1921 to 1970 | Residual method | ||
| 1971 to 2016 | Reverse Record Check and linkage between T1 tax data and the National Household Survey | |||
| Estimates of the number of citizen emigrants | 4,274,100 | 4,464,000 | 4,653,900 | |
| Note: The error of closure is the difference between the postcensal estimates of the population and census counts, adjusted for its incomplete coverage. | ||||
The medium emigration assumption gives an estimate of 4,464,000 Canadian citizens emigrants from 1921 to 2016. The low and high assumptions fluctuate around 4% of the medium assumption’s estimates.
The rest of this section describes the data and methods used to calculate the three assumptions.
3.1 Estimates of the number of emigrants
3.1.1 Estimates of emigration for 1921 to 1970
Since the data published by the DEP do not date back to 1921, the estimates for 1921 to 1970 come from a Statistics Canada study (George 1976). These estimates were calculated using residual methods. They refer to net emigration, i.e. the difference between the number of emigrants and returning emigrants. To our knowledge, these statistics are the only estimates published on Canadian emigration for this period. It is difficult to evaluate the accuracy of these data.
3.1.2 Estimates of emigration for 1971 to 2016
Statistics Canada’s DEP produces emigration estimates for the purposes of calculating estimates of the Canadian population. Since 1991, emigration estimates have been divided into two categories: permanent emigration and temporary emigration.Note
Permanent emigration is the number of Canadian citizens and permanent residents who left Canada to permanently settle in another country. The published data date back to 1971/1972. Until 1981, intercensal estimates of emigration were calculated using residual methods (Statistics Canada 2003). From 1981 to 1993, data from the Family Allowance Program (FAP) were used to measure emigration. Various adjustments were applied to these data, for example, to take account of their partial coverage. Since 1993, permanent emigration has been estimated using data from the Child Tax Benefit Program (CTB), now known as the Canada Child Benefit (CCB), and immigration data from the United States Department of Justice.Note
Since 1991, the DEP has also calculated estimates of temporary emigration. This phenomenon represents Canadian citizens and permanent residents who leave Canada to stay temporarily in another country without maintaining a usual place of residence in Canada. Temporary departures are taken from the Reverse Record Check (RRC), the survey that estimates the undercoverage of censuses. Temporary returns are derived from census data and estimates of returning emigration from the DEP. Temporary emigration is disseminated in net numbers.
It is assumed that the DEP’s estimates slightly underestimate the annual number of emigrants (Bérard-Chagnon 2018, Statistics Canada 2003). For this reason, a correction has been made to the DEP’s estimates in this study. When a new census is available and is adjusted for its incomplete coverage,Note the demographic estimates are compared with these new data. The discrepancy between the two series is called the “error of closure” (EC). It is assumed that emigration is one of the main contributors to the national error of closure (Statistics Canada 2020).. In this study, the EC is added to the DEP’s emigration estimates to account for their underestimation. This error is negative for certain years of age. This may cause inconsistencies in the diaspora’s age and sex structure. To correct this situation, the age and sex structure of the DEP’s permanent emigrants is applied to the EC.
The three emigration assumptions can be distinguished from one another by the proportion of the EC that is added to the DEP’s estimates. The low emigration assumption adds a correction by taking 33% of the total EC value, while the medium and high emigration assumptions are based on corrections of 67% and 100% of EC, respectively. These choices rely on the state of knowledge in emigration, namely that the DEP data underestimate the number of emigrants. In this context, choosing assumptions that adjust the number of DEP emigrants upward seems to be a reasonable choice.
The following chart presents the estimates from George (1976) and the DEP used in the development of the three emigration assumptions.

Data table for Chart 2
| Year | DEP + 33% correction | DEP + 67% correction | DEP + 100% correction |
|---|---|---|---|
| number | |||
| 1921 | 97,000 | 97,000 | 97,000 |
| 1922 | 97,000 | 97,000 | 97,000 |
| 1923 | 97,000 | 97,000 | 97,000 |
| 1924 | 97,000 | 97,000 | 97,000 |
| 1925 | 97,000 | 97,000 | 97,000 |
| 1926 | 97,000 | 97,000 | 97,000 |
| 1927 | 97,000 | 97,000 | 97,000 |
| 1928 | 97,000 | 97,000 | 97,000 |
| 1929 | 97,000 | 97,000 | 97,000 |
| 1930 | 97,000 | 97,000 | 97,000 |
| 1931 | 24,100 | 24,100 | 24,100 |
| 1932 | 24,100 | 24,100 | 24,100 |
| 1933 | 24,100 | 24,100 | 24,100 |
| 1934 | 24,100 | 24,100 | 24,100 |
| 1935 | 24,100 | 24,100 | 24,100 |
| 1936 | 24,100 | 24,100 | 24,100 |
| 1937 | 24,100 | 24,100 | 24,100 |
| 1938 | 24,100 | 24,100 | 24,100 |
| 1939 | 24,100 | 24,100 | 24,100 |
| 1940 | 24,100 | 24,100 | 24,100 |
| 1941 | 37,900 | 37,900 | 37,900 |
| 1942 | 37,900 | 37,900 | 37,900 |
| 1943 | 37,900 | 37,900 | 37,900 |
| 1944 | 37,900 | 37,900 | 37,900 |
| 1945 | 37,900 | 37,900 | 37,900 |
| 1946 | 37,900 | 37,900 | 37,900 |
| 1947 | 37,900 | 37,900 | 37,900 |
| 1948 | 37,900 | 37,900 | 37,900 |
| 1949 | 37,900 | 37,900 | 37,900 |
| 1950 | 37,900 | 37,900 | 37,900 |
| 1951 | 46,300 | 46,300 | 46,300 |
| 1952 | 46,300 | 46,300 | 46,300 |
| 1953 | 46,300 | 46,300 | 46,300 |
| 1954 | 46,300 | 46,300 | 46,300 |
| 1955 | 46,300 | 46,300 | 46,300 |
| 1956 | 46,300 | 46,300 | 46,300 |
| 1957 | 46,300 | 46,300 | 46,300 |
| 1958 | 46,300 | 46,300 | 46,300 |
| 1959 | 46,300 | 46,300 | 46,300 |
| 1960 | 46,300 | 46,300 | 46,300 |
| 1961 | 70,700 | 70,700 | 70,700 |
| 1962 | 70,700 | 70,700 | 70,700 |
| 1963 | 70,700 | 70,700 | 70,700 |
| 1964 | 70,700 | 70,700 | 70,700 |
| 1965 | 70,700 | 70,700 | 70,700 |
| 1966 | 70,700 | 70,700 | 70,700 |
| 1967 | 70,700 | 70,700 | 70,700 |
| 1968 | 70,700 | 70,700 | 70,700 |
| 1969 | 70,700 | 70,700 | 70,700 |
| 1970 | 70,700 | 70,700 | 70,700 |
| 1971 | 75,617 | 85,199 | 94,782 |
| 1972 | 73,407 | 82,963 | 92,520 |
| 1973 | 93,058 | 102,615 | 112,172 |
| 1974 | 87,579 | 97,136 | 106,694 |
| 1975 | 76,058 | 85,402 | 94,746 |
| 1976 | 64,454 | 71,100 | 77,747 |
| 1977 | 69,966 | 76,612 | 83,257 |
| 1978 | 69,004 | 75,649 | 82,295 |
| 1979 | 56,543 | 63,208 | 69,872 |
| 1980 | 51,552 | 58,242 | 64,931 |
| 1981 | 61,992 | 69,199 | 76,405 |
| 1982 | 66,431 | 73,637 | 80,842 |
| 1983 | 64,996 | 72,223 | 79,449 |
| 1984 | 62,408 | 69,615 | 76,821 |
| 1985 | 57,317 | 64,038 | 70,760 |
| 1986 | 48,595 | 49,484 | 50,372 |
| 1987 | 41,869 | 42,760 | 43,651 |
| 1988 | 41,283 | 42,172 | 43,060 |
| 1989 | 40,649 | 41,538 | 42,427 |
| 1990 | 45,110 | 46,527 | 47,945 |
| 1991 | 73,435 | 81,496 | 89,557 |
| 1992 | 71,777 | 79,817 | 87,857 |
| 1993 | 77,241 | 85,279 | 93,318 |
| 1994 | 79,854 | 87,895 | 95,935 |
| 1995 | 75,583 | 83,025 | 90,467 |
| 1996 | 81,705 | 85,031 | 88,357 |
| 1997 | 80,705 | 84,031 | 87,357 |
| 1998 | 76,901 | 80,226 | 83,552 |
| 1999 | 76,989 | 80,325 | 83,661 |
| 2000 | 76,503 | 79,676 | 82,850 |
| 2001 | 79,847 | 81,986 | 84,126 |
| 2002 | 83,588 | 85,728 | 87,867 |
| 2003 | 87,889 | 90,033 | 92,178 |
| 2004 | 87,332 | 89,472 | 91,612 |
| 2005 | 92,058 | 95,147 | 98,235 |
| 2006 | 94,698 | 104,361 | 114,024 |
| 2007 | 94,373 | 104,063 | 113,753 |
| 2008 | 89,723 | 99,386 | 109,049 |
| 2009 | 86,234 | 95,897 | 105,561 |
| 2010 | 89,321 | 98,653 | 107,986 |
| 2011 | 99,423 | 106,789 | 114,156 |
| 2012 | 96,142 | 103,489 | 110,835 |
| 2013 | 97,736 | 105,082 | 112,428 |
| 2014 | 99,847 | 107,192 | 114,537 |
| 2015 | 100,877 | 107,197 | 113,517 |
Emigration is not a new phenomenon. The 1920s were marked by strong emigration to the United States (Lavoie 1981). Afterwards, the economic crisis contributed to a significant reduction in the number of emigrants. The numbers of emigrants then increased in the following decades and generally continued to increase until 2016.
3.2 Citizenship rates of emigrants
The estimates of emigration used in this study combine citizens (by birth or naturalization) and permanent residents. An adjustment was applied to consider only the emigration of Canadian citizens and to divide citizens into citizens by birth and citizen by naturalization. The adjustment for citizenship was calculated in two ways based on the period being considered. The adjustment for 1921 to 1970 is based on the residual method, while the one for 1971 to 2016 comes from a model based on the RRC, censuses and a linkage between the National Household Survey (NHS) and T1 tax data.
3.2.1 Citizenship rates for 1921 to 1970
The citizenship rates for 1921 to 1970 are obtained by using a residual method. They are estimated by using and keeping the citizenship rates for 1971 to 1981 constant.
The residual method is a proven technique in demography.Note In this context, the residual method consists of isolating emigration in the demographic equation. To do so, the numbers for each demographic cohort are compared at two points in time using censuses. A residual is calculated by subtracting, for each cohort, all other components of demographic growth, such as births and deaths. This residual can be interpreted as the emigration that occurred between these two points in time.Note The residual method allows for the number of emigrants to be broken down based on citizenship status by adding this characteristic to the cohorts that are modelled using this method.
The residual obtained by this method not only represents emigration, but also the total errors in the other components of the method. Because emigration is generally a rather rare phenomenon, the proportion of errors in the residual is significant (Jensen 2013). The introduction of citizenship in the residual method adds to the uncertainty because permanent residents who acquire citizenship between 1971 and 1981 are not in the same cohort at the start and at the end of the period.
However, this approach is considered reasonable in the absence of other data. In addition, since dual citizenship has only been allowed in Canada since 1977, it is assumed that schemes for acquiring citizenship by naturalization changed little between 1921 and 1970 and that this approach is more appropriate than the one used for 1971 to 2016.
3.2.2 Citizenship rates for 1971 to 2016
For 1971 to 2016, data from the RRC, censuses, the NHS and T1 tax returns were used to identify citizens from among the total number of emigrants. The RRC is the survey used to estimate census undercoverage. The NHS is the voluntary survey that replaced the long-form questionnaire for the 2011 Census. The T1 tax returns are the returns filled out every year by Canadian taxpayers.
The citizenship rates by birth and by naturalization are obtained using the following elements:
Where:
MOD_CIT_RATE_EMI = modelled citizenship rate of emigrants (excluding non-permanent residents) for the period y to y+1;
CIT_POP_RATE = citizenship rates in the Canadian population drawn from the census in year c, which precedes year y or the NHS for 2011 (excluding non-permanent residents);
CIT_RATE_EMI = citizenship rate of emigrants (excluding non-permanent residents) estimated by the RRC and the linkage for 2011 to 2016.
Citizenship rates for emigrants were calculated for 2011 and 2016 using the RRC, the NHS and T1 tax returns to account for the fact that the characteristics of emigrants differ from those of the Canadian population as a whole. The calculation of these rates is described in the following section. The citizenship rates for emigrants in 2011 and 2016 were applied to the Canadian population in each census since 1971, broken down by citizenship status. This produces emigrant citizenship rates that vary over time by considering the evolution of the population distribution by citizenship status. Those rates were then applied to the DEP’s annual emigration estimates.
The main assumption of this method is that the relationships between the citizenship status of emigrants and that of the Canadian population remain constant over time. In other words, the gap between naturalized citizens, citizens by birth and permanent residents concerning their propensity to emigrate do not vary over time.
3.2.2.1 Citizenship rates of emigrants in 2011 and 2016The calculation of citizenship rates of emigrants from 2011 to 2016 relies on the integration of two data sources.
First, data from the 2016 RRC consider the citizenship status of people from the sample who were labelled as emigrants. The main advantages of using the RRC are that this survey’s concept of emigration is close to that of the DEP and the definition of the usual place of residence and that the survey’s frames cover the universe of censuses very well. However, the use of the RRC is limited by the relatively small number of emigrants in the sample (around 500) and by the effects of non-response and proxy responses for emigrants.
Second, a linkage between the NHS and 2011 T1 tax data also allows for the citizenship status of emigrants to be examined. Citizenship information is drawn from the NHS, while emigrants are identified using departure dates listed by tax filers in their tax returns. This approach results in a database of more than 2,000 emigrants, a higher number than that of the RRC. The main shortcomings of this approach are that the tax concept of emigration differs from that of the DEP and that the linkage is not totally representative of the census’ universe, since many people are not linked or do not appear in the tax data or in the NHS. This is particularly the case for recent immigrants, who are both very likely to have been missed by the census and to emigrate (Finnie 2006, Bérard-Chagnon et al. 2019). It is assumed that these limitations do not impact the distribution of emigrants based on citizenship status.
In both sources, non-permanent residents (NPR) were identified and removed from the calculations. The following table reports the distributions of emigrants by citizenship status from both sources.
| Canadian citizenship statuses of emigrants | Reverse Record Check | Linkage between the National Household Survey and tax data | Average |
|---|---|---|---|
| percent | |||
| Citizens | 62 | 82 | 72 |
| Citizens by birth | 42 | 48 | 45 |
| Citizens by naturalization | 20 | 34 | 27 |
| Non-citizens (permanent residents) | 38 | 18 | 28 |
| Total | 100 | 100 | 100 |
|
Note: Non-permanent residents were removed from the calculations. Sources: Reverse Record Check (2016), National Household Survey (2011) and T1 tax returns (2011). |
|||
The results of this table show that between 62% and 82% of emigrants in the RRC and the linkage are Canadian citizens. These proportions are considerably lower than those of the Canadian population as a whole (94% in 2016 after excluding NPRs). In addition, 42% to 48% of citizen emigrants are citizens by birth.
Because of the limitations of both sources, the average of both approaches was used to model the number of citizens among emigrants on the assumption that the average would reconcile the strengths and weaknesses of both sources in a situation where it is difficult to determine which source is the more plausible one.
The following chart shows the rates of citizenship by birth and by naturalization that are applied to the numbers of emigrants.

Data table for Chart 3
| Year | Citizens by birth | Citizens by naturalization | Permanent residents |
|---|---|---|---|
| percent | |||
| 1921 | 58 | 11 | 31 |
| 1922 | 58 | 11 | 31 |
| 1923 | 58 | 11 | 31 |
| 1924 | 58 | 11 | 31 |
| 1925 | 58 | 11 | 31 |
| 1926 | 58 | 11 | 31 |
| 1927 | 58 | 11 | 31 |
| 1928 | 58 | 11 | 31 |
| 1929 | 58 | 11 | 31 |
| 1930 | 58 | 11 | 31 |
| 1931 | 58 | 11 | 31 |
| 1932 | 58 | 11 | 31 |
| 1933 | 58 | 11 | 31 |
| 1934 | 58 | 11 | 31 |
| 1935 | 58 | 11 | 31 |
| 1936 | 58 | 11 | 31 |
| 1937 | 58 | 11 | 31 |
| 1938 | 58 | 11 | 31 |
| 1939 | 58 | 11 | 31 |
| 1940 | 58 | 11 | 31 |
| 1941 | 58 | 11 | 31 |
| 1942 | 58 | 11 | 31 |
| 1943 | 58 | 11 | 31 |
| 1944 | 58 | 11 | 31 |
| 1945 | 58 | 11 | 31 |
| 1946 | 58 | 11 | 31 |
| 1947 | 58 | 11 | 31 |
| 1948 | 58 | 11 | 31 |
| 1949 | 58 | 11 | 31 |
| 1950 | 58 | 11 | 31 |
| 1951 | 58 | 11 | 31 |
| 1952 | 58 | 11 | 31 |
| 1953 | 58 | 11 | 31 |
| 1954 | 58 | 11 | 31 |
| 1955 | 58 | 11 | 31 |
| 1956 | 58 | 11 | 31 |
| 1957 | 58 | 11 | 31 |
| 1958 | 58 | 11 | 31 |
| 1959 | 58 | 11 | 31 |
| 1960 | 58 | 11 | 31 |
| 1961 | 58 | 11 | 31 |
| 1962 | 58 | 11 | 31 |
| 1963 | 58 | 11 | 31 |
| 1964 | 58 | 11 | 31 |
| 1965 | 58 | 11 | 31 |
| 1966 | 58 | 11 | 31 |
| 1967 | 58 | 11 | 31 |
| 1968 | 58 | 11 | 31 |
| 1969 | 58 | 11 | 31 |
| 1970 | 58 | 11 | 31 |
| 1971 | 45 | 23 | 32 |
| 1972 | 45 | 23 | 32 |
| 1973 | 45 | 23 | 32 |
| 1974 | 45 | 23 | 32 |
| 1975 | 45 | 23 | 32 |
| 1976 | 45 | 22 | 32 |
| 1977 | 45 | 22 | 32 |
| 1978 | 45 | 22 | 32 |
| 1979 | 45 | 22 | 32 |
| 1980 | 45 | 22 | 32 |
| 1981 | 46 | 24 | 30 |
| 1982 | 46 | 24 | 30 |
| 1983 | 46 | 24 | 30 |
| 1984 | 46 | 24 | 30 |
| 1985 | 46 | 24 | 30 |
| 1986 | 46 | 24 | 30 |
| 1987 | 46 | 24 | 30 |
| 1988 | 46 | 24 | 30 |
| 1989 | 46 | 24 | 30 |
| 1990 | 46 | 24 | 29 |
| 1991 | 47 | 21 | 32 |
| 1992 | 47 | 21 | 32 |
| 1993 | 47 | 22 | 32 |
| 1994 | 47 | 22 | 32 |
| 1995 | 47 | 21 | 32 |
| 1996 | 47 | 23 | 30 |
| 1997 | 47 | 23 | 30 |
| 1998 | 47 | 23 | 30 |
| 1999 | 47 | 23 | 30 |
| 2000 | 47 | 23 | 30 |
| 2001 | 47 | 22 | 31 |
| 2002 | 47 | 22 | 31 |
| 2003 | 47 | 22 | 31 |
| 2004 | 47 | 22 | 31 |
| 2005 | 47 | 22 | 31 |
| 2006 | 47 | 24 | 29 |
| 2007 | 47 | 24 | 29 |
| 2008 | 47 | 25 | 29 |
| 2009 | 46 | 25 | 29 |
| 2010 | 46 | 25 | 29 |
| 2011 | 46 | 27 | 27 |
| 2012 | 46 | 27 | 27 |
| 2013 | 46 | 27 | 27 |
| 2014 | 46 | 27 | 27 |
| 2015 | 46 | 27 | 27 |
According to the model developed in this study, most emigrants are citizens by birth. Before 1971, nearly 60% of emigrants were citizens by birth, while 1 in 10 emigrant was a naturalized citizen. Since Canada did not accept dual citizenship at the time, it is reasonable to suppose that immigrants who obtained Canadian citizenship were much more likely to stay in Canada than those who preferred to keep the citizenship of another country.
Starting in 1971, the results of this study give a proportion of citizens by birth that fluctuates between 40% and 50%. This is a lower proportion than for the 1921 to 1970 period. These results also indicate that naturalized citizens may make up between 20% and 30% of emigrants, which seems completely plausible, given the significant increase in immigration in the 1980s. Lastly, it must be noted that permanent residents may make up around 30% of emigrants for the entire period examined.
4. Fertility
According to section 3 of the Citizenship Act, a child can become a Canadian citizen if they are born or adopted abroad and one of both parents is a Canadian citizen at the time of birth or adoption.
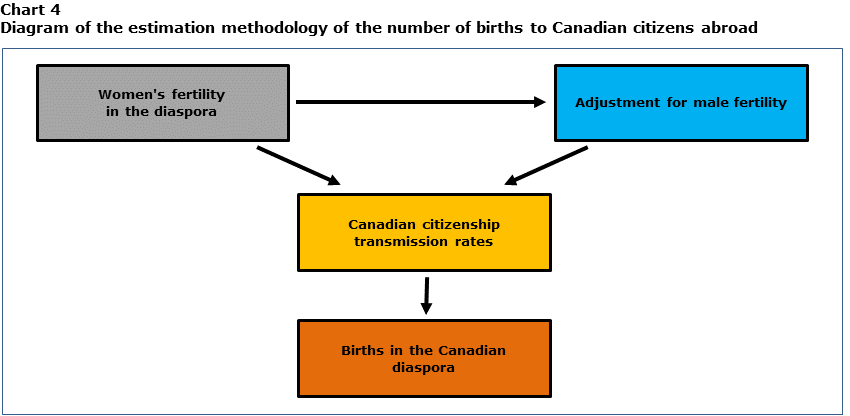
This section shows how the number of births abroad is estimated for the purposes of this analysis. The following chart gives a diagram of the process developed in this study.
Data table for Chart 4
The number of children born to Canadian citizens abroad was estimated in three steps. First, fertility rates were applied annually to the stock of women in the diaspora (black box). Second, an adjustment was made to account for births to a Canadian father with a non-Canadian mother (blue box). This step is necessary since the fertility rates used in the black box do not take this situation into account. Third, Canadian citizenship transmission rates were applied to the births just estimated (yellow box). Even if they are entitled to Canadian citizenship, some people never apply for it, so not all births abroad to parents who are Canadian citizens enter the Canadian diaspora as defined in this study. Finally, the sum of the births obtained from the black and blue boxes, to which the citizenship transmission rates have been applied, gives the number of children born to Canadian citizens abroad in the Canadian diaspora (orange box).
The number of children born to Canadian citizens abroad was estimated in three steps. First, fertility rates were applied annually to the number of women in the diaspora. Second, an adjustment was made to account for the number of births involving a Canadian father and a non-Canadian mother. This step is necessary because the fertility rates used in step 1 do not account for this situation. Third, Canadian citizenship transmission rates were applied to the births that were just estimated. Even if they are entitled to Canadian citizenship, some people never apply for it, meaning that not all births abroad to Canadian citizen parents enter the Canadian diaspora as defined in this study. It must be remembered that the two other main sources that provide estimates of the size of the Canadian diaspora, namely the APFC and the UN, do not consider this part of the diaspora.
The fertility rates and the adjustment for male fertility are the same for the three fertility assumptions. They are set apart by the different Canadian citizenship transmission rates:
- Low fertility: citizenship transmission rates of the United Kingdom;
- Medium fertility: citizenship transmission rates of the United States;
- High fertility: citizenship transmission rates of Australia.
The rest of this section describes the methods used to obtain these assumptions.
As mentioned previously, since 2009, only the first generation of children born abroad can become citizens by descent. Since the reference year for the estimates in this study is 2016, this situation only affects children born from 2009 to 2016. It is assumed that the effect of this change is negligible.
4.1 Fertility rates
The Canadian fertility rates by age from 1921 to 2016 were applied each year to the women in the diaspora.
This approach relies on the assumption that fertility behaviours of women in the diaspora are the same as for those who live in Canada. The literature suggests that immigrant women tend to adopt the fertility behaviours of the country of destination (Bélanger and Gilbert 2006). Since Canadian emigrants mainly settle in countries with similar fertility levels than Canada, this assumption seems plausible.
It is assumed that the number of adoptions is negligible for the purposes of calculating the number of Canadian citizens who live abroad.
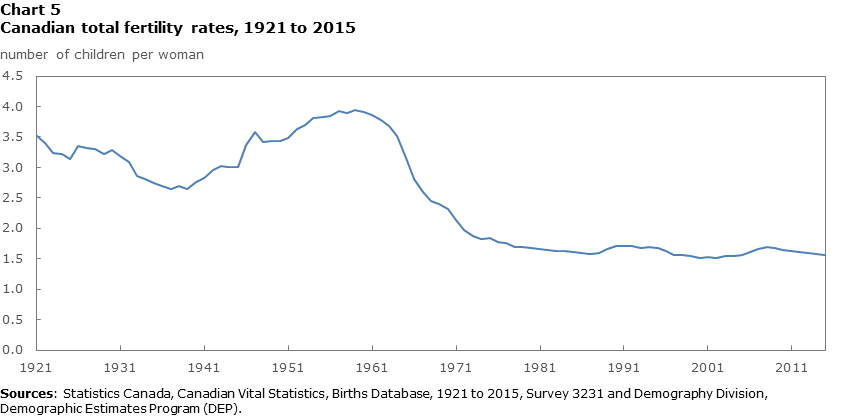
The following chart illustrates the Canadian total fertility rates (TFR) that were used in this study.
Data table for Chart 5
| Year | Number of children per woman |
|---|---|
| 1921 | 3.53 |
| 1922 | 3.40 |
| 1923 | 3.23 |
| 1924 | 3.22 |
| 1925 | 3.13 |
| 1926 | 3.35 |
| 1927 | 3.32 |
| 1928 | 3.29 |
| 1929 | 3.22 |
| 1930 | 3.28 |
| 1931 | 3.19 |
| 1932 | 3.08 |
| 1933 | 2.86 |
| 1934 | 2.80 |
| 1935 | 2.75 |
| 1936 | 2.69 |
| 1937 | 2.64 |
| 1938 | 2.70 |
| 1939 | 2.65 |
| 1940 | 2.76 |
| 1941 | 2.82 |
| 1942 | 2.95 |
| 1943 | 3.03 |
| 1944 | 3.00 |
| 1945 | 3.00 |
| 1946 | 3.36 |
| 1947 | 3.58 |
| 1948 | 3.42 |
| 1949 | 3.44 |
| 1950 | 3.43 |
| 1951 | 3.48 |
| 1952 | 3.62 |
| 1953 | 3.70 |
| 1954 | 3.81 |
| 1955 | 3.82 |
| 1956 | 3.84 |
| 1957 | 3.93 |
| 1958 | 3.89 |
| 1959 | 3.94 |
| 1960 | 3.91 |
| 1961 | 3.85 |
| 1962 | 3.77 |
| 1963 | 3.68 |
| 1964 | 3.51 |
| 1965 | 3.15 |
| 1966 | 2.82 |
| 1967 | 2.60 |
| 1968 | 2.45 |
| 1969 | 2.40 |
| 1970 | 2.31 |
| 1971 | 2.14 |
| 1972 | 1.96 |
| 1973 | 1.88 |
| 1974 | 1.83 |
| 1975 | 1.83 |
| 1976 | 1.78 |
| 1977 | 1.75 |
| 1978 | 1.70 |
| 1979 | 1.70 |
| 1980 | 1.68 |
| 1981 | 1.65 |
| 1982 | 1.64 |
| 1983 | 1.62 |
| 1984 | 1.62 |
| 1985 | 1.61 |
| 1986 | 1.59 |
| 1987 | 1.58 |
| 1988 | 1.60 |
| 1989 | 1.66 |
| 1990 | 1.72 |
| 1991 | 1.71 |
| 1992 | 1.71 |
| 1993 | 1.68 |
| 1994 | 1.69 |
| 1995 | 1.67 |
| 1996 | 1.63 |
| 1997 | 1.57 |
| 1998 | 1.56 |
| 1999 | 1.54 |
| 2000 | 1.51 |
| 2001 | 1.53 |
| 2002 | 1.51 |
| 2003 | 1.54 |
| 2004 | 1.55 |
| 2005 | 1.57 |
| 2006 | 1.61 |
| 2007 | 1.66 |
| 2008 | 1.68 |
| 2009 | 1.68 |
| 2010 | 1.64 |
| 2011 | 1.62 |
| 2012 | 1.61 |
| 2013 | 1.59 |
| 2014 | 1.58 |
| 2015 | 1.56 |
Fertility surpassed 2.5 children per woman in the 1920s and 1930s. It then rose to nearly 4.0 children per woman during the baby boom, which was from 1946 to 1965. Afterwards, fertility decreased to between 1.5 and 1.7 children per woman starting in the early 1980s.
4.2 Adjustment for male fertility
The application of fertility rates for women in the diaspora does not cover all births abroad to Canadian citizen parents. In fact, three scenarios are possible concerning the citizenship of parents to a child born abroad. The following table presents these three possibilities.
| Cases | Mother's Canadian citizenship status | Father's Canadian citizenship status |
|---|---|---|
| 1 | Canadian | Canadian |
| 2 | Canadian | Non-Canadian |
| 3 | Non-Canadian | Canadian |
The application of the fertility rates to women in the diaspora allows the consideration of the births for Canadian mothers (cases 1 and 2), but not those where only the father is a Canadian citizen (case 3). An adjustment is necessary to consider this scenario.
This adjustment was calculated using data from the American Community Survey (ACS) (Bilan 2020). The ACS is the annual survey that replaced the long-form questionnaire of the American census after 2000. It provides information on the country of birth and fertility of respondents. It must be remembered that the ACS is subject to the usual limitations of sample surveys, such as sampling variability. The data from the ACS public files, which group the annual data from 2013 to 2017, were used here. Although the public files are a sample of the ACS, the use of the compiled data helps make the results more robust.
The country of birth for women who gave birth to a child in the year preceding the survey was identified. Then, the country of birth of the mother’s partner was added if it was known. The following table shows the distribution of countries of birth for both parents.
| Standpoint | Mother's country of birth | Father's country of birth | 2013/2017 |
|---|---|---|---|
| percent | |||
| Mother's | Canada | Canada | 13.3 |
| Foreign | 76.1 | ||
| Unknown | 10.5 | ||
| Total | 100.0 | ||
| Father's | Canada | Canada | 16.9 |
| Foreign | 83.1 | ||
| Total | 100.0 | ||
| Source: Bilan (2020). | |||
The main finding that emerged from examining these data is that people born in Canada and who live in the United States often have children with partners who were not born in Canada. This is the case approximately for three-quarters of women and for more than 80% of men. This result is plausible, since young adults and single people are especially likely to emigrate (Finnie 2006). Upon reaching the country of destination, these people may find partners who are not born in Canada. The corollary of the result of this table is that applying the TFR to the female population of the diaspora significantly underestimates the number of births to Canadian parents.
The adjustment is calculated in three steps. First, the ratio between fertility rates of men born in Canada who had a child with a woman born abroad (case 3) and those of women born in Canada (regardless of the father’s country, cases 1 and 2) was calculated using the weighted ACS data from 2013 to 2017. Second, this ratio was applied to the annual fertility rates in order to determine the male fertility adjustment. Third, this adjustment was applied to the male population of the diaspora to obtain a number of births for Canadian fathers with non-Canadian mothers. This approach relies on the assumption that the fertility rate ratios are constant over time.
The following chart shows the ratios between the fertility rates for men born in Canada who had a child with a woman born abroad and those of women born in Canada (regardless of father’s country of birth) drawn from the ACS. These data are calculated during the first step of the adjustment.

Data table for Chart 6
| Age | Ratio |
|---|---|
| 25 | 0.07 |
| 26 | 0.41 |
| 27 | 0.04 |
| 28 | 0.67 |
| 29 | 0.39 |
| 30 | 0.43 |
| 31 | 0.42 |
| 32 | 0.71 |
| 33 | 0.81 |
| 34 | 0.77 |
| 35 | 0.93 |
| 36 | 1.21 |
| 37 | 1.07 |
| 38 | 0.79 |
| 39 | 0.83 |
| 40 | 0.97 |
| 41 | 0.57 |
| 42 | 1.27 |
| 43 | 3.92 |
| 44 | 2.08 |
The ratios are in general much lower than one. This situation, which was expected, means that the fertility rates for men born in Canada who had a child with a woman born abroad are lower than those of women born in Canada (regardless of the father’s country of birth). However, starting in the mid-thirties, the ratios draw closer to one another and sometimes surpass one. This result is because fathers tend to be older than mothers and because fertility decreases starting in the mid-thirties (Provencher et al. 2018).
The following chart compares the adjustment calculated to take account of male fertility with women who are not Canadian in the TFR for Canada.

Data table for Chart 7
| Year | Total fertility rates | Adjustments for male fertility with non-Canadian women |
|---|---|---|
| number of children per woman | ||
| 1921 | 3.53 | 1.80 |
| 1922 | 3.40 | 1.77 |
| 1923 | 3.23 | 1.71 |
| 1924 | 3.22 | 1.69 |
| 1925 | 3.13 | 1.64 |
| 1926 | 3.35 | 1.85 |
| 1927 | 3.32 | 1.82 |
| 1928 | 3.29 | 1.81 |
| 1929 | 3.22 | 1.73 |
| 1930 | 3.28 | 1.77 |
| 1931 | 3.19 | 1.71 |
| 1932 | 3.08 | 1.67 |
| 1933 | 2.86 | 1.56 |
| 1934 | 2.80 | 1.53 |
| 1935 | 2.75 | 1.49 |
| 1936 | 2.69 | 1.46 |
| 1937 | 2.64 | 1.41 |
| 1938 | 2.70 | 1.42 |
| 1939 | 2.65 | 1.38 |
| 1940 | 2.76 | 1.40 |
| 1941 | 2.82 | 1.39 |
| 1942 | 2.95 | 1.45 |
| 1943 | 3.03 | 1.50 |
| 1944 | 3.00 | 1.51 |
| 1945 | 3.00 | 1.51 |
| 1946 | 3.36 | 1.63 |
| 1947 | 3.58 | 1.68 |
| 1948 | 3.42 | 1.60 |
| 1949 | 3.44 | 1.59 |
| 1950 | 3.43 | 1.58 |
| 1951 | 3.48 | 1.58 |
| 1952 | 3.62 | 1.63 |
| 1953 | 3.70 | 1.65 |
| 1954 | 3.81 | 1.70 |
| 1955 | 3.82 | 1.69 |
| 1956 | 3.84 | 1.69 |
| 1957 | 3.93 | 1.70 |
| 1958 | 3.89 | 1.66 |
| 1959 | 3.94 | 1.67 |
| 1960 | 3.91 | 1.64 |
| 1961 | 3.85 | 1.61 |
| 1962 | 3.77 | 1.57 |
| 1963 | 3.68 | 1.54 |
| 1964 | 3.51 | 1.48 |
| 1965 | 3.15 | 1.32 |
| 1966 | 2.82 | 1.16 |
| 1967 | 2.60 | 1.04 |
| 1968 | 2.45 | 0.96 |
| 1969 | 2.40 | 0.94 |
| 1970 | 2.31 | 0.89 |
| 1971 | 2.14 | 0.80 |
| 1972 | 1.96 | 0.73 |
| 1973 | 1.88 | 0.67 |
| 1974 | 1.83 | 0.65 |
| 1975 | 1.83 | 0.64 |
| 1976 | 1.78 | 0.63 |
| 1977 | 1.75 | 0.62 |
| 1978 | 1.70 | 0.60 |
| 1979 | 1.70 | 0.61 |
| 1980 | 1.68 | 0.60 |
| 1981 | 1.65 | 0.60 |
| 1982 | 1.64 | 0.60 |
| 1983 | 1.62 | 0.60 |
| 1984 | 1.62 | 0.61 |
| 1985 | 1.61 | 0.62 |
| 1986 | 1.59 | 0.62 |
| 1987 | 1.58 | 0.62 |
| 1988 | 1.60 | 0.64 |
| 1989 | 1.66 | 0.66 |
| 1990 | 1.72 | 0.69 |
| 1991 | 1.71 | 0.69 |
| 1992 | 1.71 | 0.70 |
| 1993 | 1.68 | 0.70 |
| 1994 | 1.69 | 0.71 |
| 1995 | 1.67 | 0.71 |
| 1996 | 1.63 | 0.71 |
| 1997 | 1.57 | 0.69 |
| 1998 | 1.56 | 0.69 |
| 1999 | 1.54 | 0.70 |
| 2000 | 1.51 | 0.69 |
| 2001 | 1.53 | 0.72 |
| 2002 | 1.51 | 0.72 |
| 2003 | 1.54 | 0.75 |
| 2004 | 1.55 | 0.77 |
| 2005 | 1.57 | 0.78 |
| 2006 | 1.61 | 0.82 |
| 2007 | 1.66 | 0.85 |
| 2008 | 1.68 | 0.86 |
| 2009 | 1.68 | 0.87 |
| 2010 | 1.64 | 0.86 |
| 2011 | 1.62 | 0.86 |
| 2012 | 1.61 | 0.87 |
| 2013 | 1.59 | 0.87 |
| 2014 | 1.58 | 0.88 |
| 2015 | 1.56 | 0.89 |
The adjustment follows the TFR curve relatively well. Its scale seems reasonable considering the results that were just presented.
4.3 Canadian citizenship transmission rates
Although people born abroad to or adopted abroad by citizen parents are entitled to Canadian citizenship, they have not necessarily taken the steps to obtain it. Some people may not be interested in this process or not be aware of this right.
To our knowledge, the data from countries to which most Canadians emigrate do not provide any information on the transmission of Canadian citizenship. As a result, Canadian census data were used to calculate citizenship transmission rates for nationals from a few countries.Note The selected countries are the United Kingdom (low fertility assumption), the United States (medium fertility assumption) and Australia (high fertility assumption). These countries were chosen for three main reasons: 1) they have a citizenship system that resembles that of Canada, 2) they accept dual citizenship and 3) a relatively large number of Canadians live in these countries according to UN statistics.
Transmission is defined here as when a person born in Canada is a citizen of the country of birth of one of his or her parents. For example, citizenship is transmitted if a person born in Canada to parents born in Australia gains Australian citizenship. The central assumption of this approach is that the citizenship transmission behaviour of nationals from these countries who are living in Canada are similar to those of Canadian citizens who live abroad. This assumption has a high degree of uncertainty and was made in the absence of direct data on this phenomenon.
According to the 2016 Census, the general rates of citizenship transmission are 13.2% for the United Kingdom, 23.0% for the United States and 41.4% for Australia.
The transmission rates are applied in two steps. First, the rates were calculated by cohort using the 2016 Census. Second, the 2016 Census does not give any information on the time when citizenship in the parents’ country of birth was acquired. The transmission rates per cohort in the first step were consistently applied to each age from 0 to 35. After that age, it is assumed that these persons have not acquired citizenship in their parents’ country of birth. This assumption was made after examining the citizenship patterns of the children of American parents using fictitious cohorts in the censuses from 2001 to 2016, which did not increase much more after age 35. The following chart presents the citizenship transmission rates by cohort.

Data table for Chart 8
| Year of birth | United Kingdom | United States | Australia |
|---|---|---|---|
| percent | |||
| 1921 | 6.0 | 4.7 | 0.0 |
| 1922 | 6.9 | 8.8 | 0.0 |
| 1923 | 6.6 | 8.0 | 0.0 |
| 1924 | 6.5 | 6.6 | 15.6 |
| 1925 | 5.5 | 7.6 | 19.1 |
| 1926 | 6.3 | 6.3 | 7.7 |
| 1927 | 7.2 | 6.9 | 9.9 |
| 1928 | 7.0 | 6.9 | 12.1 |
| 1929 | 7.7 | 8.0 | 10.2 |
| 1930 | 6.9 | 7.2 | 23.6 |
| 1931 | 6.8 | 8.0 | 31.7 |
| 1932 | 7.5 | 8.8 | 15.2 |
| 1933 | 8.6 | 7.5 | 30.0 |
| 1934 | 8.9 | 9.1 | 35.1 |
| 1935 | 9.2 | 9.4 | 40.1 |
| 1936 | 10.3 | 8.2 | 48.4 |
| 1937 | 10.4 | 11.1 | 35.8 |
| 1938 | 11.2 | 12.0 | 36.1 |
| 1939 | 12.1 | 11.7 | 35.1 |
| 1940 | 12.3 | 14.5 | 49.5 |
| 1941 | 13.3 | 15.3 | 44.3 |
| 1942 | 13.1 | 17.2 | 23.5 |
| 1943 | 14.5 | 17.7 | 34.4 |
| 1944 | 15.5 | 19.4 | 40.2 |
| 1945 | 14.9 | 19.4 | 47.3 |
| 1946 | 12.7 | 19.9 | 46.6 |
| 1947 | 11.5 | 22.7 | 41.0 |
| 1948 | 11.9 | 22.1 | 36.8 |
| 1949 | 12.7 | 21.5 | 29.1 |
| 1950 | 11.5 | 21.9 | 39.5 |
| 1951 | 11.3 | 21.3 | 32.0 |
| 1952 | 12.5 | 23.8 | 32.3 |
| 1953 | 12.7 | 23.3 | 36.5 |
| 1954 | 12.4 | 22.6 | 40.7 |
| 1955 | 12.5 | 26.5 | 42.3 |
| 1956 | 12.9 | 24.8 | 30.9 |
| 1957 | 12.3 | 25.8 | 37.2 |
| 1958 | 11.6 | 25.8 | 38.9 |
| 1959 | 12.1 | 26.8 | 34.6 |
| 1960 | 12.7 | 27.6 | 37.8 |
| 1961 | 13.6 | 29.9 | 41.4 |
| 1962 | 14.6 | 30.9 | 49.5 |
| 1963 | 15.0 | 31.0 | 40.2 |
| 1964 | 15.7 | 32.2 | 31.1 |
| 1965 | 16.1 | 32.9 | 43.1 |
| 1966 | 17.0 | 38.4 | 40.1 |
| 1967 | 17.3 | 37.1 | 44.0 |
| 1968 | 16.6 | 38.6 | 44.0 |
| 1969 | 16.8 | 38.4 | 38.0 |
| 1970 | 16.2 | 37.9 | 38.7 |
| 1971 | 17.0 | 36.1 | 50.9 |
| 1972 | 17.7 | 33.9 | 46.4 |
| 1973 | 17.7 | 37.3 | 50.6 |
| 1974 | 15.6 | 36.6 | 48.7 |
| 1975 | 16.1 | 30.8 | 57.7 |
| 1976 | 16.0 | 34.8 | 48.2 |
| 1977 | 14.9 | 32.3 | 48.3 |
| 1978 | 16.6 | 32.9 | 58.4 |
| 1979 | 16.6 | 32.8 | 55.0 |
| 1980 | 16.8 | 31.5 | 55.1 |
| 1981 | 16.5 | 33.9 | 60.8 |
| 1982 | 16.1 | 31.8 | 65.4 |
| 1983 | 16.0 | 34.0 | 67.0 |
| 1984 | 16.5 | 30.5 | 71.7 |
| 1985 | 15.7 | 29.4 | 67.2 |
| 1986 | 18.1 | 31.9 | 61.8 |
| 1987 | 17.0 | 30.8 | 64.9 |
| 1988 | 17.0 | 28.6 | 64.3 |
| 1989 | 15.8 | 27.1 | 58.8 |
| 1990 | 14.3 | 25.4 | 66.5 |
| 1991 | 14.3 | 24.5 | 50.5 |
| 1992 | 13.8 | 24.3 | 44.1 |
| 1993 | 13.2 | 21.2 | 47.6 |
| 1994 | 12.2 | 20.3 | 37.1 |
| 1995 | 12.4 | 22.3 | 34.7 |
| 1996 | 11.9 | 21.3 | 30.2 |
| 1997 | 13.5 | 17.7 | 26.3 |
| 1998 | 13.3 | 17.3 | 29.3 |
| 1999 | 13.9 | 18.1 | 22.5 |
| 2000 | 13.4 | 18.0 | 27.4 |
| 2001 | 14.2 | 19.3 | 29.2 |
| 2002 | 13.5 | 16.8 | 25.2 |
| 2003 | 13.6 | 17.3 | 23.2 |
| 2004 | 15.0 | 18.3 | 28.5 |
| 2005 | 13.4 | 18.4 | 27.3 |
| 2006 | 13.4 | 18.4 | 25.3 |
| 2007 | 13.7 | 18.6 | 30.5 |
| 2008 | 11.6 | 18.7 | 28.0 |
| 2009 | 11.9 | 17.7 | 29.3 |
| 2010 | 11.8 | 18.1 | 27.3 |
| 2011 | 12.1 | 17.3 | 24.6 |
| 2012 | 9.3 | 15.9 | 20.1 |
| 2013 | 9.2 | 17.2 | 22.9 |
| 2014 | 8.1 | 12.8 | 18.9 |
| 2015 | 7.2 | 11.6 | 13.8 |
| 2016 | 3.9 | 9.6 | 4.6 |
Transmission of citizenship by year of birth is not consistent for the countries identified for the citizenship transmission assumptions. The rates are almost always between 10% and 20% for each cohort of the United Kingdom. American rates come close to 40% for the generations born in the 1960s. Lastly, Australia’s rates are not only the highest, but are also the most volatile. These rates reached an apex of nearly 60% among the cohorts born in the 1980s.
5. Mortality
Mortality is one of the three demographic events that reduce the size of the Canadian diaspora.
Only one assumption was developed for mortality. The Canadian life tables calculated by Statistics Canada were applied to the population of the diaspora to estimate the number of deaths. Since they are not available for every year in the period from 1921 to 2016, the 1931 tables were used from 1921 to 1940. Afterwards, the last available table was used until the next one appeared. For example, the table for 1950 to 1952 is used for the period from 1950 to 1954. Starting in 1981, Canadian life tables became annual.Note
The use of these tables relies on the assumption that Canadian citizens who live abroad experience the same risks of mortality as those of the Canadian population. The use of Canadian life tables can be seen as optimistic, given the fact that the life expectancy in Canada is among the highest in the world. However, Canadian emigrants largely live in countries where the life expectancy is relatively similar to that of Canada and have characteristics associated with longevity, such as a higher level of education (Canon 2017). This suggests that the mortality assumption is plausible.
The literature reports that immigrants live longer than the population in the country of destination. This phenomenon, often called the “healthy immigrant effect”, may have an impact on the mortality of Canadian citizens who live abroad. This effect gradually fades away after settlement, such that the life expectancy of immigrants converges with that of the population in the country of destination (Ng 2011). As a result, this effect is considered to be negligible here.
The following chart shows the life expectancy calculated from the life tables used in this study.

Data table for Chart 9
| Year | Males | Females |
|---|---|---|
| in years | ||
| 1921 | 60.0 | 62.1 |
| 1922 | 60.0 | 62.1 |
| 1923 | 60.0 | 62.1 |
| 1924 | 60.0 | 62.1 |
| 1925 | 60.0 | 62.1 |
| 1926 | 60.0 | 62.1 |
| 1927 | 60.0 | 62.1 |
| 1928 | 60.0 | 62.1 |
| 1929 | 60.0 | 62.1 |
| 1930 | 60.0 | 62.1 |
| 1931 | 60.0 | 62.1 |
| 1932 | 60.0 | 62.1 |
| 1933 | 60.0 | 62.1 |
| 1934 | 60.0 | 62.1 |
| 1935 | 60.0 | 62.1 |
| 1936 | 60.0 | 62.1 |
| 1937 | 60.0 | 62.1 |
| 1938 | 60.0 | 62.1 |
| 1939 | 60.0 | 62.1 |
| 1940 | 60.0 | 62.1 |
| 1941 | 63.0 | 66.3 |
| 1942 | 63.0 | 66.3 |
| 1943 | 63.0 | 66.3 |
| 1944 | 63.0 | 66.3 |
| 1945 | 64.7 | 68.0 |
| 1946 | 64.7 | 68.0 |
| 1947 | 64.7 | 68.0 |
| 1948 | 64.7 | 68.0 |
| 1949 | 64.7 | 68.0 |
| 1950 | 66.3 | 70.8 |
| 1951 | 66.3 | 70.8 |
| 1952 | 66.3 | 70.8 |
| 1953 | 66.3 | 70.8 |
| 1954 | 66.3 | 70.8 |
| 1955 | 67.6 | 72.9 |
| 1956 | 67.6 | 72.9 |
| 1957 | 67.6 | 72.9 |
| 1958 | 67.6 | 72.9 |
| 1959 | 67.6 | 72.9 |
| 1960 | 68.4 | 74.2 |
| 1961 | 68.4 | 74.2 |
| 1962 | 68.4 | 74.2 |
| 1963 | 68.4 | 74.2 |
| 1964 | 68.4 | 74.2 |
| 1965 | 68.8 | 75.2 |
| 1966 | 68.8 | 75.2 |
| 1967 | 68.8 | 75.2 |
| 1968 | 68.8 | 75.2 |
| 1969 | 68.8 | 75.2 |
| 1970 | 69.3 | 76.4 |
| 1971 | 69.3 | 76.4 |
| 1972 | 69.3 | 76.4 |
| 1973 | 69.3 | 76.4 |
| 1974 | 69.3 | 76.4 |
| 1975 | 70.2 | 77.5 |
| 1976 | 70.2 | 77.5 |
| 1977 | 70.2 | 77.5 |
| 1978 | 70.2 | 77.5 |
| 1979 | 70.2 | 77.5 |
| 1980 | 72.0 | 79.1 |
| 1981 | 72.3 | 79.4 |
| 1982 | 72.7 | 79.6 |
| 1983 | 72.9 | 79.7 |
| 1984 | 73.1 | 79.8 |
| 1985 | 73.3 | 80.0 |
| 1986 | 73.5 | 80.1 |
| 1987 | 73.7 | 80.3 |
| 1988 | 73.9 | 80.5 |
| 1989 | 74.3 | 80.7 |
| 1990 | 74.5 | 80.9 |
| 1991 | 74.7 | 80.9 |
| 1992 | 74.8 | 81.0 |
| 1993 | 74.9 | 80.9 |
| 1994 | 75.1 | 81.0 |
| 1995 | 75.4 | 81.1 |
| 1996 | 75.7 | 81.3 |
| 1997 | 76.0 | 81.4 |
| 1998 | 76.3 | 81.6 |
| 1999 | 76.6 | 81.8 |
| 2000 | 76.9 | 81.9 |
| 2001 | 77.1 | 82.0 |
| 2002 | 77.4 | 82.2 |
| 2003 | 77.6 | 82.3 |
| 2004 | 77.9 | 82.6 |
| 2005 | 78.1 | 82.7 |
| 2006 | 78.3 | 82.9 |
| 2007 | 78.5 | 83.0 |
| 2008 | 78.8 | 83.3 |
| 2009 | 79.1 | 83.5 |
| 2010 | 79.4 | 83.7 |
| 2011 | 79.6 | 83.8 |
| 2012 | 79.7 | 83.9 |
| 2013 | 79.8 | 83.9 |
| 2014 | 79.9 | 84.0 |
| 2015 | 79.9 | 84.0 |
Two results stand out for the purposes of this study. The life expectancy of the Canadian population extended considerably over the 20th century. Women routinely have a longer life expectancy than men.
6. Returning emigration
Emigration is not necessarily a definitive phenomenon. Many emigrants eventually come back to Canada. The data in the Survey of 1995 Graduates Who Moved to the United States (SGMUS) reported that over 40% of respondents who were still in the United States in 1999 intended to return to Canada (Frank and Bélair 1999). Returning emigration reduces the number of Canadian citizens who live abroad. Conceptually, returning emigration also includes citizens by descent who come to settle in Canada.
Only one returning emigration assumption was developed. Like the emigration assumptions, the returning emigration assumption is obtained in two steps. First of all, estimates of the number of returning emigrants were calculated using the DEP’s estimates. Then, Canadian citizenship rates were calculated using censuses and applied to the estimates of the number of returning emigrants. This assumption gives a total of 1,080,500 returning emigrants who were Canadian citizens for the period being studied.
6.1 Estimates of the number of returning emigrants
6.1.1 Estimates of returning emigration for 1921 to 1970
It must be remembered that the emigration estimates for 1921 to 1970 come from the residual method calculated by George (1976). These data refer to net emigration, that is, they already implicitly include returning emigration. For this reason, returning emigration is considered to be zero for 1921 to 1970.
6.1.2 Estimates of returning emigration for 1971 to 2016
As is the case for emigration, the DEP provides estimates on returning emigration to calculate Canada’s population estimates. The DEP defines a returning emigrant as a Canadian citizen or permanent resident who had previously emigrated and then returned to settle in Canada. Returning emigration also includes citizens by descent.
DEP data on returning emigrants has been available since 1971. Like for emigration, estimates of returning emigration were calculated using the FAP until 1993 (Statistics Canada 2003). Various adjustments were applied to these data, for example, to consider their incomplete coverage. Since 1993, returning emigration has been calculated using CTB data, now known as the CCB, with adjustments that are similar to those of the FAP (Statistics Canada 2016).
The following chart presents the DEP estimates of the number of returning emigrants used in this study.
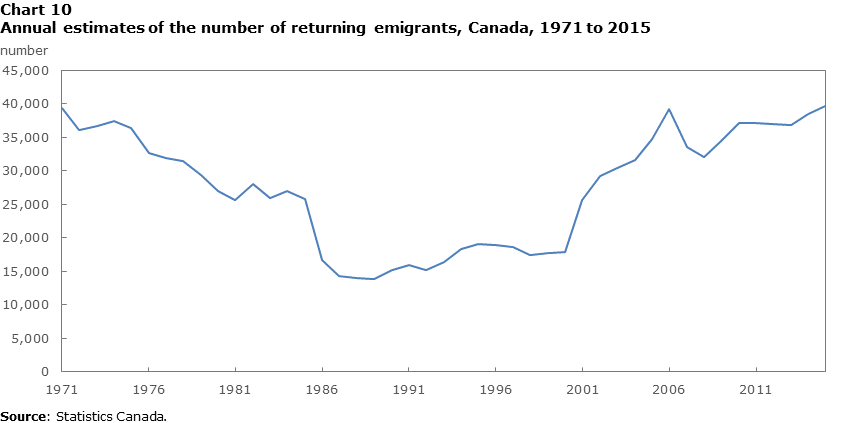
Data table for Chart 10
| Year | Number of returning emigrants |
|---|---|
| 1971 | 39,457 |
| 1972 | 36,117 |
| 1973 | 36,747 |
| 1974 | 37,519 |
| 1975 | 36,399 |
| 1976 | 32,750 |
| 1977 | 31,884 |
| 1978 | 31,501 |
| 1979 | 29,358 |
| 1980 | 27,044 |
| 1981 | 25,676 |
| 1982 | 28,105 |
| 1983 | 26,020 |
| 1984 | 27,068 |
| 1985 | 25,801 |
| 1986 | 16,701 |
| 1987 | 14,293 |
| 1988 | 14,087 |
| 1989 | 13,926 |
| 1990 | 15,208 |
| 1991 | 15,899 |
| 1992 | 15,279 |
| 1993 | 16,358 |
| 1994 | 18,388 |
| 1995 | 19,035 |
| 1996 | 18,956 |
| 1997 | 18,671 |
| 1998 | 17,491 |
| 1999 | 17,680 |
| 2000 | 17,910 |
| 2001 | 25,727 |
| 2002 | 29,257 |
| 2003 | 30,441 |
| 2004 | 31,620 |
| 2005 | 34,711 |
| 2006 | 39,235 |
| 2007 | 33,576 |
| 2008 | 32,069 |
| 2009 | 34,496 |
| 2010 | 37,126 |
| 2011 | 37,170 |
| 2012 | 36,994 |
| 2013 | 36,889 |
| 2014 | 38,458 |
| 2015 | 39,660 |
The DEP estimates report 1.2 million returning emigrants between 1971 and 2016. These data show a gradual decrease in returning emigration in the 1970s and 1980s followed by stagnation in the 1990s. In the 2000s, returning emigration was once again similar to the levels observed in the early 1970s.
6.2 Citizenship rates of returning emigrants
Returning emigration estimates used in this study combine citizens and permanent residents. An adjustment is calculated using censuses to only consider returning emigration for Canadian citizens. This adjustment relies on information about citizenship for people who were living abroad five years ago and who were not recent immigrants or NPRs.
The following chart shows the progression of citizenship rates of returning emigrants according to the censuses

Data table for Chart 11
| Year | Citizens by birth | Citizens by naturalization | Permanent residents |
|---|---|---|---|
| percent | |||
| 1971 | 68.3 | 17.4 | 14.4 |
| 1972 | 68.3 | 17.4 | 14.4 |
| 1973 | 68.3 | 17.4 | 14.4 |
| 1974 | 68.3 | 17.4 | 14.4 |
| 1975 | 68.3 | 17.4 | 14.4 |
| 1976 | 68.3 | 17.4 | 14.4 |
| 1977 | 68.3 | 17.4 | 14.4 |
| 1978 | 68.3 | 17.4 | 14.4 |
| 1979 | 68.3 | 17.4 | 14.4 |
| 1980 | 68.3 | 17.4 | 14.4 |
| 1981 | 68.3 | 17.4 | 14.4 |
| 1982 | 68.3 | 17.4 | 14.4 |
| 1983 | 68.3 | 17.4 | 14.4 |
| 1984 | 68.3 | 17.4 | 14.4 |
| 1985 | 68.3 | 17.4 | 14.4 |
| 1986 | 66.6 | 20.0 | 13.4 |
| 1987 | 66.6 | 20.0 | 13.4 |
| 1988 | 66.6 | 20.0 | 13.4 |
| 1989 | 66.6 | 20.0 | 13.4 |
| 1990 | 66.6 | 20.0 | 13.4 |
| 1991 | 66.1 | 22.1 | 11.8 |
| 1992 | 66.1 | 22.1 | 11.8 |
| 1993 | 66.1 | 22.1 | 11.8 |
| 1994 | 66.1 | 22.1 | 11.8 |
| 1995 | 66.1 | 22.1 | 11.8 |
| 1996 | 68.0 | 21.9 | 10.2 |
| 1997 | 67.9 | 21.9 | 10.2 |
| 1998 | 67.9 | 21.9 | 10.2 |
| 1999 | 68.0 | 21.9 | 10.2 |
| 2000 | 68.0 | 21.9 | 10.2 |
| 2001 | 59.3 | 28.1 | 12.6 |
| 2002 | 59.3 | 28.1 | 12.6 |
| 2003 | 59.3 | 28.1 | 12.6 |
| 2004 | 59.3 | 28.1 | 12.6 |
| 2005 | 59.3 | 28.1 | 12.6 |
| 2006 | 63.3 | 27.7 | 9.0 |
| 2007 | 63.3 | 27.7 | 9.0 |
| 2008 | 63.3 | 27.7 | 9.0 |
| 2009 | 63.3 | 27.7 | 9.0 |
| 2010 | 63.3 | 27.7 | 9.0 |
| 2011 | 54.4 | 31.7 | 14.0 |
| 2012 | 54.4 | 31.7 | 14.0 |
| 2013 | 54.4 | 31.7 | 14.0 |
| 2014 | 54.4 | 31.7 | 14.0 |
| 2015 | 54.4 | 31.7 | 14.0 |
From 1971 to 2015, most returning emigrants were citizens by birth. However, this proportion decreased by about 15 percentage points over the examined period. Conversely, the proportion of naturalized citizens among returning emigrants increased from 1971 to 2015, from a bit less than 20% to more than 30%. Lastly, from 10% to 15% of returning emigrants were permanent residents.
7. Loss of Canadian citizenship
The loss of Canadian citizenship is another phenomenon that reduces the size of the diaspora. According to the Citizenship Act, Canadian citizens may lose their citizenship in two ways: by revocation or by renunciation. A person living abroad when citizenship is lost is no longer part of the Canadian diaspora.
7.1 Revocation of citizenship
The Citizenship Act allows for citizenship to be revoked if it was acquired fraudulently or if a citizen who has dual citizenship was convicted of high treason or served against Canada in an armed conflict.
Revocation of citizenship is a very rare phenomenon. In fact, only a few hundred citizens have had their citizenship revoked since the creation of Canadian citizenship.Note As a result, the effect of lost Canadian citizenship on the number of Canadian citizens who live abroad is assumed to be negligible.
7.2 Renunciation of citizenship
The act also allows Canadian citizens that have foreign nationality to renounce their citizenship. The act also provides procedures for resuming status as a Canadian citizen under certain conditions.
Like revocation, renunciation of citizenship is an infrequent phenomenon. On the eve of the 2010s, around 200 people had renounced their citizenship each year.Note It is therefore assumed that this phenomenon also had a negligible effect on the number of Canadian citizens who live abroad.
8. Results
The previous sections presented how the assumptions for each demographic event were modelled. This section presents the results using three scenarios to reflect the uncertainty inherent in this study.
The following table presents the estimates of the number of Canadian citizens who live abroad in the three scenarios based on how citizenship was acquired.
| Scenarios | Citizens by birth born in Canada | Citizens by naturalization | Citizens by descent | Total | ||||
|---|---|---|---|---|---|---|---|---|
| number | percent | number | percent | number | percent | number | percent | |
| Low numbers | 1,233,400 | 41.8 | 565,000 | 19.1 | 1,155,100 | 39.1 | 2,953,500 | 100.0 |
| Medium numbers | 1,346,400 | 33.3 | 621,200 | 15.4 | 2,071,100 | 51.3 | 4,038,700 | 100.0 |
| High numbers | 1,459,400 | 26.3 | 677,500 | 12.2 | 3,412,900 | 61.5 | 5,549,800 | 100.0 |
According to the “medium numbers” scenario, 4,038,700 Canadian citizens were living abroad in 2016. This number may be between 2,953,500 and 5,549,800 people according to the “low numbers” and “high numbers” scenarios. This means that the Canadian diaspora may represent 11.2% (8.2% to 15.4%) of the population living in Canada.Note These proportions become 12.6% (9.2% to 17.3%) by comparing the number of Canadian citizens who lived in Canada in 2016 according to the census.
The three scenarios suggest that citizens by descent may represent a significant portion of the Canadian diaspora. In fact, this group of citizens may represent half of the entire diaspora (51.3% [39.1%, 61.5%]). According to ACS data from 2014 to 2018, 2.7 million people in the United States reported being of Canadian, French Canadian or Acadian background, compared with 950,000 people who reported being born in Canada. Although the ethnic origin does not necessarily imply being a citizen or being entitled to citizenship, the results of the ACS suggest that it is completely plausible that citizens by descent make up an appreciable part of the diaspora.
The second largest group is that of citizens by birth, which may represent one-third of the diaspora (33.3% [26.3%, 41.8%]). Lastly, naturalized citizens make up 15.4% of the diaspora (12.2%, 19.1%). The larger range for citizens by descent recalls the higher degree of uncertainty for this subpopulation.
The following chart shows the age structure of the diaspora based on the three scenarios.
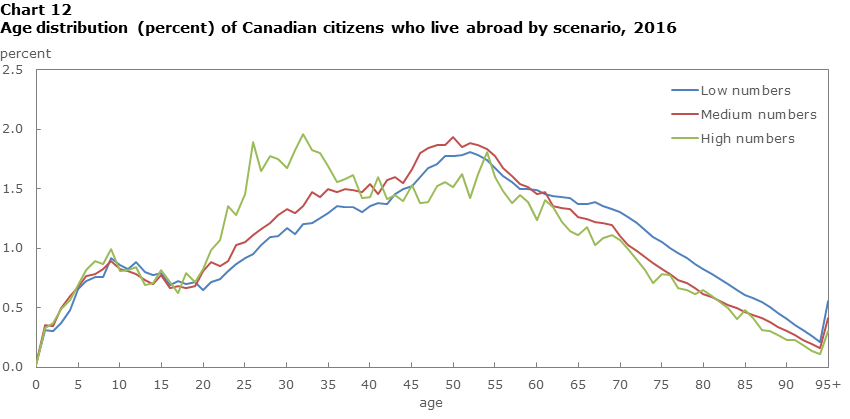
Data table for Chart 12
| Age | Low numbers | Medium numbers | High numbers |
|---|---|---|---|
| percent | |||
| 0 | 0.0 | 0.0 | 0.0 |
| 1 | 0.3 | 0.4 | 0.3 |
| 2 | 0.3 | 0.3 | 0.4 |
| 3 | 0.4 | 0.5 | 0.5 |
| 4 | 0.5 | 0.6 | 0.6 |
| 5 | 0.7 | 0.7 | 0.7 |
| 6 | 0.7 | 0.8 | 0.8 |
| 7 | 0.8 | 0.8 | 0.9 |
| 8 | 0.8 | 0.8 | 0.9 |
| 9 | 0.9 | 0.9 | 1.0 |
| 10 | 0.9 | 0.8 | 0.8 |
| 11 | 0.8 | 0.8 | 0.8 |
| 12 | 0.9 | 0.8 | 0.8 |
| 13 | 0.8 | 0.7 | 0.7 |
| 14 | 0.8 | 0.7 | 0.7 |
| 15 | 0.8 | 0.8 | 0.8 |
| 16 | 0.7 | 0.7 | 0.7 |
| 17 | 0.7 | 0.7 | 0.6 |
| 18 | 0.7 | 0.7 | 0.8 |
| 19 | 0.7 | 0.7 | 0.7 |
| 20 | 0.6 | 0.8 | 0.8 |
| 21 | 0.7 | 0.9 | 1.0 |
| 22 | 0.7 | 0.8 | 1.1 |
| 23 | 0.8 | 0.9 | 1.4 |
| 24 | 0.9 | 1.0 | 1.3 |
| 25 | 0.9 | 1.1 | 1.5 |
| 26 | 1.0 | 1.1 | 1.9 |
| 27 | 1.0 | 1.2 | 1.6 |
| 28 | 1.1 | 1.2 | 1.8 |
| 29 | 1.1 | 1.3 | 1.8 |
| 30 | 1.2 | 1.3 | 1.7 |
| 31 | 1.1 | 1.3 | 1.8 |
| 32 | 1.2 | 1.4 | 2.0 |
| 33 | 1.2 | 1.5 | 1.8 |
| 34 | 1.3 | 1.4 | 1.8 |
| 35 | 1.3 | 1.5 | 1.7 |
| 36 | 1.4 | 1.5 | 1.6 |
| 37 | 1.3 | 1.5 | 1.6 |
| 38 | 1.4 | 1.5 | 1.6 |
| 39 | 1.3 | 1.5 | 1.4 |
| 40 | 1.4 | 1.5 | 1.4 |
| 41 | 1.4 | 1.5 | 1.6 |
| 42 | 1.4 | 1.6 | 1.4 |
| 43 | 1.5 | 1.6 | 1.5 |
| 44 | 1.5 | 1.6 | 1.4 |
| 45 | 1.5 | 1.7 | 1.5 |
| 46 | 1.6 | 1.8 | 1.4 |
| 47 | 1.7 | 1.8 | 1.4 |
| 48 | 1.7 | 1.9 | 1.5 |
| 49 | 1.8 | 1.9 | 1.6 |
| 50 | 1.8 | 1.9 | 1.5 |
| 51 | 1.8 | 1.9 | 1.6 |
| 52 | 1.8 | 1.9 | 1.4 |
| 53 | 1.8 | 1.9 | 1.6 |
| 54 | 1.7 | 1.8 | 1.8 |
| 55 | 1.7 | 1.8 | 1.6 |
| 56 | 1.6 | 1.7 | 1.5 |
| 57 | 1.6 | 1.6 | 1.4 |
| 58 | 1.5 | 1.5 | 1.4 |
| 59 | 1.5 | 1.5 | 1.4 |
| 60 | 1.5 | 1.5 | 1.2 |
| 61 | 1.5 | 1.5 | 1.4 |
| 62 | 1.4 | 1.4 | 1.3 |
| 63 | 1.4 | 1.3 | 1.2 |
| 64 | 1.4 | 1.3 | 1.1 |
| 65 | 1.4 | 1.3 | 1.1 |
| 66 | 1.4 | 1.2 | 1.2 |
| 67 | 1.4 | 1.2 | 1.0 |
| 68 | 1.4 | 1.2 | 1.1 |
| 69 | 1.3 | 1.2 | 1.1 |
| 70 | 1.3 | 1.1 | 1.1 |
| 71 | 1.3 | 1.0 | 1.0 |
| 72 | 1.2 | 1.0 | 0.9 |
| 73 | 1.2 | 0.9 | 0.8 |
| 74 | 1.1 | 0.9 | 0.7 |
| 75 | 1.1 | 0.8 | 0.8 |
| 76 | 1.0 | 0.8 | 0.8 |
| 77 | 1.0 | 0.7 | 0.7 |
| 78 | 0.9 | 0.7 | 0.7 |
| 79 | 0.9 | 0.7 | 0.6 |
| 80 | 0.8 | 0.6 | 0.6 |
| 81 | 0.8 | 0.6 | 0.6 |
| 82 | 0.7 | 0.6 | 0.5 |
| 83 | 0.7 | 0.5 | 0.5 |
| 84 | 0.7 | 0.5 | 0.4 |
| 85 | 0.6 | 0.5 | 0.5 |
| 86 | 0.6 | 0.4 | 0.4 |
| 87 | 0.5 | 0.4 | 0.3 |
| 88 | 0.5 | 0.4 | 0.3 |
| 89 | 0.5 | 0.3 | 0.3 |
| 90 | 0.4 | 0.3 | 0.2 |
| 91 | 0.4 | 0.3 | 0.2 |
| 92 | 0.3 | 0.2 | 0.2 |
| 93 | 0.3 | 0.2 | 0.1 |
| 94 | 0.2 | 0.2 | 0.1 |
| 95+ | 0.6 | 0.4 | 0.3 |
According to the medium scenario, close to 70% of the diaspora appears to be between the ages of 15 and 64. People aged 45 to 54 appear to make up the largest group—almost 20% of the entire diaspora. It must be noted that the high scenario presents a slightly different age structure. In this scenario, population aged 25 to 34 represents almost 18% of the diaspora compared with 12.7% in the medium scenario. This discrepancy is mainly the result of the transmission of Canadian citizenship to children born abroad, which was modelled using the behaviour of Australians living in Canada in the high scenario.
The population that makes up the diaspora is older than the one living in Canada in the three scenarios. The average age of the three scenarios, estimated at 48.4 years, 46.2 years and 44.0 years for the low, medium and high scenario respectively, is higher than that of the Canadian population (40,8 years). Moreover, children aged 0 to 14 represent less than 10% of the diaspora according to the three scenarios, compared with 16.3% of the Canadian population in 2016.
Two of the factors that may explain this result are notable. First, the application of citizenship rates to births abroad results in the addition of only a portion of the births to the diaspora. Second, the diaspora grows every year through an inflow of emigrants who are often in their twenties and thirties when they emigrate.
According to the three scenarios, the diaspora would be made up of about the same number of men and women. In fact, the sex ratio of the diaspora is between 49.4% (medium scenario) and 52.0% (high scenario).Note This high consistency is the result of two factors related to the method developed in this study. First, in all three scenarios, the number of births was broken down by sex based on the sex ratio traditionally observed in demographics (105 boys for every 100 girls). Then, the estimates of the number of emigrants in the three scenarios were based on the same sex distribution (that of the DEP); only the number of emigrants varied from one scenario to another.
This distribution corresponds to that of the Canadian population in 2016.
9. Consistency and sensitivity analyses
This section presents the results of several consistency and sensitivity analyses. These analyses have two objectives. First, they compare the obtained results with those of other sources to assess their consistency. They then examine the sensitivity of the calculated estimates by changing some assumptions.
9.1 Consistency analyses
As previously mentioned, other sources provide estimates of the size of the Canadian diaspora. This section compares the results of this study’s model with data from the UN, the ACS and the APFC to assess their consistency.
It is important to recall that the figures from the UN and the United States only include people born in Canada who live abroad, while those of the APFC include both Canadian citizens and permanent residents.
9.1.1 Comparison with United Nations estimates
As previously mentioned, one recognized drawback of the UN method is that the international data used are limited by a certain level of undercoverage. To correct this flaw and improve the comparability of results, the UN estimates were inflated by 2% (adjusted series). This figure is obtained by using the average of the net census undercoverage estimates for the censuses of Australia, New Zealand, the United Kingdom and the United States from 1990 to 2016, drawn from Bérard-Chagnon and Parent (2021). According to the UN, these four countries cover more than three-quarters of the population born in Canada who live abroad.
Three special scenarios were developed for this comparison in order to be closer to the UN’s concepts. They are based on the three scenarios in this study, but with about two differences. First, rates of citizenship by birth were applied to emigrants and returning emigrants instead of the citizenship rate (including naturalized citizens). Then, the number of births of Canadian citizens abroad was set to zero. It must be noted that these special scenarios do not correspond precisely to that of the population born in Canada. However, the difference between the number of citizens by birth and the population born in Canada is deemed to be negligible for the purposes of this study.Note
The following table presents the results of this comparison.
| Scenario | Number | Relative difference (percent) with UN adjusted estimates |
|---|---|---|
| United Nations | ||
| Published | 1,359,585 | Note ...: not applicable |
| Adjusted | 1,386,777 | Note ...: not applicable |
| Canadian-born population | ||
| Low numbers | 1,233,400 | -11.1 |
| Medium numbers | 1,346,400 | -2.9 |
| High numbers | 1,459,400 | 5.2 |
|
... not applicable Note: The United Nations data refers to the population born in Canada who live abroad. Source: United Nations (2017). |
||
These results suggest a relatively high degree of consistency between the estimates calculated in this study and the UN statistics for the Canadian-born population who live abroad. According to the medium scenario, a bit over 1.3 million people born in Canada lived abroad in 2016. This estimate is lower than the adjusted UN figures by 2.9%. The low and high scenarios provide respective estimates that are -11.1% lower and 5.2% higher than the UN statistics. These differences are deemed to be reasonable, considering the degree of uncertainty in the study, and they show that the method developed in this study is credible.
9.1.2 Comparison with American Community Survey data
Contrasting with the ACS data enhances the comparison that was just made by adding the dimensions of age and sex. Since two-thirds of the Canadian-born population who live abroad live in the United States, the age and sex structure of Canadians who live in this country can be considered to be quite representative of the entire Canadian diaspora that was born in Canada. The ACS is presented in the section on fertility. The scenarios developed for comparison with the UN statistics are used here.
The following chart and table show the results of the comparisons with the ACS data on age and sex.

Data table for Chart 13
| Age | American Community Survey | Canadian-born population | ||
|---|---|---|---|---|
| Low numbers | Medium numbers | High numbers | ||
| percent | ||||
| 0 | 0.1 | 0.1 | 0.1 | 0.1 |
| 1 | 0.2 | 0.1 | 0.1 | 0.1 |
| 2 | 0.2 | 0.1 | 0.1 | 0.1 |
| 3 | 0.3 | 0.1 | 0.1 | 0.1 |
| 4 | 0.2 | 0.2 | 0.2 | 0.2 |
| 5 | 0.3 | 0.2 | 0.2 | 0.2 |
| 6 | 0.3 | 0.2 | 0.2 | 0.2 |
| 7 | 0.3 | 0.3 | 0.3 | 0.3 |
| 8 | 0.4 | 0.3 | 0.3 | 0.3 |
| 9 | 0.4 | 0.3 | 0.3 | 0.3 |
| 10 | 0.4 | 0.3 | 0.3 | 0.3 |
| 11 | 0.4 | 0.3 | 0.3 | 0.3 |
| 12 | 0.4 | 0.3 | 0.3 | 0.3 |
| 13 | 0.4 | 0.3 | 0.3 | 0.3 |
| 14 | 0.5 | 0.3 | 0.3 | 0.3 |
| 15 | 0.5 | 0.3 | 0.3 | 0.3 |
| 16 | 0.5 | 0.2 | 0.2 | 0.3 |
| 17 | 0.6 | 0.2 | 0.2 | 0.2 |
| 18 | 0.7 | 0.2 | 0.2 | 0.2 |
| 19 | 0.9 | 0.2 | 0.2 | 0.2 |
| 20 | 0.9 | 0.2 | 0.2 | 0.2 |
| 21 | 0.8 | 0.3 | 0.3 | 0.3 |
| 22 | 1.0 | 0.3 | 0.3 | 0.3 |
| 23 | 1.0 | 0.3 | 0.3 | 0.4 |
| 24 | 0.9 | 0.4 | 0.4 | 0.4 |
| 25 | 1.2 | 0.4 | 0.4 | 0.4 |
| 26 | 1.1 | 0.4 | 0.5 | 0.5 |
| 27 | 1.0 | 0.5 | 0.5 | 0.5 |
| 28 | 1.1 | 0.5 | 0.6 | 0.6 |
| 29 | 1.1 | 0.6 | 0.6 | 0.7 |
| 30 | 1.2 | 0.7 | 0.7 | 0.7 |
| 31 | 1.2 | 0.8 | 0.8 | 0.8 |
| 32 | 1.2 | 0.9 | 0.9 | 0.9 |
| 33 | 1.3 | 0.9 | 1.0 | 1.0 |
| 34 | 1.3 | 1.0 | 1.1 | 1.1 |
| 35 | 1.3 | 1.1 | 1.1 | 1.2 |
| 36 | 1.3 | 1.1 | 1.2 | 1.2 |
| 37 | 1.4 | 1.2 | 1.2 | 1.2 |
| 38 | 1.3 | 1.2 | 1.2 | 1.3 |
| 39 | 1.5 | 1.2 | 1.2 | 1.3 |
| 40 | 1.5 | 1.2 | 1.3 | 1.3 |
| 41 | 1.5 | 1.2 | 1.3 | 1.3 |
| 42 | 1.5 | 1.3 | 1.3 | 1.4 |
| 43 | 1.5 | 1.3 | 1.4 | 1.4 |
| 44 | 1.6 | 1.4 | 1.4 | 1.5 |
| 45 | 1.7 | 1.4 | 1.5 | 1.5 |
| 46 | 1.5 | 1.5 | 1.6 | 1.6 |
| 47 | 1.5 | 1.6 | 1.7 | 1.7 |
| 48 | 1.6 | 1.7 | 1.8 | 1.8 |
| 49 | 1.5 | 1.8 | 1.9 | 1.9 |
| 50 | 1.7 | 1.9 | 1.9 | 1.9 |
| 51 | 1.6 | 2.0 | 2.0 | 2.0 |
| 52 | 1.8 | 2.0 | 2.0 | 2.0 |
| 53 | 1.8 | 2.0 | 2.0 | 2.0 |
| 54 | 1.8 | 2.0 | 2.0 | 2.0 |
| 55 | 1.8 | 2.0 | 2.0 | 2.0 |
| 56 | 1.8 | 1.9 | 1.9 | 1.9 |
| 57 | 1.8 | 1.9 | 1.9 | 1.9 |
| 58 | 2.0 | 1.8 | 1.8 | 1.8 |
| 59 | 1.8 | 1.8 | 1.8 | 1.8 |
| 60 | 1.8 | 1.7 | 1.7 | 1.8 |
| 61 | 1.7 | 1.7 | 1.7 | 1.7 |
| 62 | 1.7 | 1.7 | 1.7 | 1.7 |
| 63 | 1.8 | 1.7 | 1.7 | 1.7 |
| 64 | 1.7 | 1.7 | 1.7 | 1.7 |
| 65 | 1.7 | 1.7 | 1.7 | 1.7 |
| 66 | 1.6 | 1.7 | 1.7 | 1.7 |
| 67 | 1.7 | 1.7 | 1.7 | 1.8 |
| 68 | 1.6 | 1.8 | 1.8 | 1.8 |
| 69 | 1.5 | 1.8 | 1.8 | 1.8 |
| 70 | 1.5 | 1.8 | 1.7 | 1.7 |
| 71 | 1.4 | 1.7 | 1.7 | 1.7 |
| 72 | 1.3 | 1.7 | 1.7 | 1.7 |
| 73 | 1.2 | 1.7 | 1.7 | 1.6 |
| 74 | 1.2 | 1.7 | 1.6 | 1.6 |
| 75 | 1.1 | 1.6 | 1.6 | 1.5 |
| 76 | 1.0 | 1.6 | 1.5 | 1.5 |
| 77 | 0.9 | 1.5 | 1.5 | 1.4 |
| 78 | 0.9 | 1.5 | 1.4 | 1.4 |
| 79 | 0.8 | 1.4 | 1.3 | 1.3 |
| 80 | 0.9 | 1.3 | 1.3 | 1.2 |
| 81 | 0.7 | 1.3 | 1.2 | 1.2 |
| 82 | 0.7 | 1.2 | 1.2 | 1.1 |
| 83 | 0.7 | 1.1 | 1.1 | 1.0 |
| 84 | 0.6 | 1.1 | 1.0 | 1.0 |
| 85 | 0.5 | 1.0 | 0.9 | 0.9 |
| 86 | 0.6 | 0.9 | 0.9 | 0.8 |
| 87 | 0.5 | 0.9 | 0.8 | 0.8 |
| 88 | 0.5 | 0.8 | 0.8 | 0.7 |
| 89 | 0.4 | 0.8 | 0.7 | 0.7 |
| 90 | 0.3 | 0.7 | 0.7 | 0.6 |
| 91 | 0.1 | 0.6 | 0.6 | 0.5 |
| 92 | 0.1 | 0.5 | 0.5 | 0.5 |
| 93 | 0.2 | 0.5 | 0.4 | 0.4 |
| 94 | 0.9 | 0.4 | 0.4 | 0.3 |
| 95+ | 0.0 | 1.1 | 1.0 | 0.9 |
Overall, the age structures in this study’s scenarios correspond relatively well to that of the ACS.Note In all cases, the highest numbers are in the age 50 to 64 range. However, there are some discrepancies for adults in their twenties and for the population aged 70 or over. The three scenarios calculated here give a lower proportion of people in their twenties combined with a higher proportion of people aged 70 or over compared with the ACS data.
While these differences may reflect the drawbacks of the methods used in this study, it is also possible that they are partly the result of emigration dynamics that are specific to the United States. For example, many young Canadians study at American universities, meaning that the age structure of Canadians who live in the United States may be a bit younger than that of all people born in Canada who live abroad.Note
| Scenario | Men | Women | Total |
|---|---|---|---|
| percent | |||
| American Community Survey | 46.5 | 53.5 | 100.0 |
| Canadian-born population |
|||
| Low numbers | 50.2 | 49.8 | 100.0 |
| Medium numbers | 50.2 | 49.8 | 100.0 |
| High numbers | 50.3 | 49.7 | 100.0 |
|
Note: The data from the American Community Survey refer to the population born in Canada who lives in the United States. Source: American Community Survey 2014-2018 5-Year Estimates. |
|||
The sex distributions in the scenarios presented here are consistent with that of the ACS. According to ACS data, men make up 46.5% of the Canadian-born population who live in the United States. The scenarios developed in this study suggest that men make up between 50.0% and 51.0% of citizens by birth who live abroad, which is a few percentage points higher than the ACS.
9.1.3 Comparison with the Asia Pacific Foundation of Canada estimates
The third source for comparisons is the APFC. Their work arrived at an estimate of 2,733,000 Canadians who lived abroad in 2001 (Zhang 2006). Three special scenarios were designed to increase their comparability with the APFC’s figures. These scenarios, called “emigration only”, are variations on the three scenarios of this study with three differences. First, they include all emigrants and returning emigrants regardless of their citizenship status. Then, the number of births to Canadian citizens who live abroad was set to zero. Lastly, the iterative calculation of the diaspora spans from 1941 to 2001 instead of 1921 to 2016.
The following table compares the results of these scenarios with those of the APFC.
| Scenario | Net emigration | Deaths | Canadian diaspora | |||
|---|---|---|---|---|---|---|
| Number | Difference with APFC (percent) | Number | Difference with APFC (percent) | Number | Difference with APFC (percent) | |
| APFC (Zhang 2006) | 3,390,000 | Note ...: not applicable | 658,000 | Note ...: not applicable | 2,732,000 | Note ...: not applicable |
| Emigration only | ||||||
| Low numbers | 2,846,300 | -16.0 | 537,600 | -18.3 | 2,308,700 | -15.5 |
| Medium numbers | 3,023,800 | -10.8 | 548,500 | -16.6 | 2,475,300 | -9.4 |
| High numbers | 3,201,300 | -5.6 | 559,500 | -15.0 | 2,641,900 | -3.3 |
|
... not applicable Notes: Net emigration is the difference between emigration and returning emigration. For these scenarios, the diaspora is obtained by subtracting deaths from net emigration. Source: Zhang (2006). |
||||||
The APFC’s estimates of the number of Canadian citizens who live abroad are higher than those of the three scenarios presented here. The discrepancy ranges from 3.3% (high numbers) to more than 15% (low numbers).
These differences are the result of both higher numbers for the APFC for net emigration and, to a lesser degree, for deaths. From 1941 to 2001, the net emigration estimated by the APFC surpassed those of every scenario by at least 5%, while the number of deaths was higher than those in the scenarios by 15% or more. These results suggest that the APFC’s estimates would be higher than what is expected to estimate the number of people who emigrated from Canada and who were still alive in 2001.
9.2 Sensitivity analyses
This section shows the results of sensitivity analyses that were carried out to show the effect of using different assumptions on the estimates.
9.2.1 Residual emigration
As mentioned in the section on the assumptions for emigration, the residual method allows the computation of emigration estimates from 1971 to 2016. A special scenario, named the “residual method”, was calculated to contrast the scenarios in this study. This scenario differs from those of this study by using the residual method to calculate emigration estimates and census data to compute returning emigration estimates from 1971 to 2016.
The following table compares the results of this study’s scenarios with those developed using the residual method.
| Scenario | Emigrants | Returning emigrants | Net emigration | Natural increase | Total |
|---|---|---|---|---|---|
| number | |||||
| Residual method | 4,881,200 | 1,598,600 | 3,282,600 | 576,500 | 3,859,100 |
| Low numbers | 4,274,100 | 1,080,500 | 3,193,600 | -240,200 | 2,953,500 |
| Medium numbers | 4,464,000 | 1,080,500 | 3,383,500 | 655,300 | 4,038,700 |
| High numbers | 4,653,900 | 1,080,500 | 3,573,400 | 1,976,300 | 5,549,800 |
| Notes: Net emigration is obtained by subtracting returning emigration from emigration. Emigration and returning emigration in this table’s four scenarios are the same for 1921 to 1970. Natural increase is the difference between the number of births and deaths. | |||||
The residual method gives estimates that are close to those of the other three scenarios. Using the residual method gives a total diaspora of 3.8 million people. This estimate is lower than that of the medium scenario by 4.4% and is within the interval set out by the low and high scenarios.
The results of the residual method for net emigration are close to those of the other three scenarios. It must be remembered that since the four scenarios are based on the same estimates of net emigration for 1921 to 1970, the discrepancies observed here are only because of differences for 1971 to 2016. Although the residual method’s estimates of the number of emigrants are higher than those of the three scenarios in this study, this situation is offset by returning emigration, which is also higher using the residual method. Since the residual method is independent of emigration assumptions starting in 1971, this sensitivity analysis suggests that the emigration assumptions are plausible.
It must be noted that using the residual method for comparisons with APFC estimates gives a diaspora of 2,191,500 people. This result is also lower than that of the APFC and suggests that the APFC’s method may overestimate the size of the diaspora.
9.2.2 Fertility and mortality behaviours of the United States
The scenarios in this study rely on the assumption that fertility and mortality behaviours in the diaspora’s population are similar to those of the Canadian population. A scenario was developed to test the sensitivity of this assumption. This scenario, named the “United States scenario”, is based on the medium scenario with the difference that it uses the fertility and mortality behaviours of the American population instead of the Canadian population. It must be remembered that the United States is the main country of destination for Canadian emigrants. In addition, fertility and mortality in the United States are higher than in Canada.
Fertility rates for the United States are obtained from the Human Fertility Database. These rates are available from 1933 to 2016. The 1933 rates were kept constant for the period from 1921 to 1932. The life tables for the United States come from the Human Mortality Database. Since they start in 1933, it is assumed that the mortality rates from 1921 to 1932 corresponds to that of 1933.
The following table compares the scenario based on American data with the medium scenario.
| Scenario | Emigrants | Returning emigrants | Natural increase | Total |
|---|---|---|---|---|
| number | ||||
| Medium numbers | 4,464,000 | 1,080,500 | 655,300 | 4,038,700 |
| United States | 4,464,000 | 1,080,500 | 148,100 | 3,531,600 |
Using American data for fertility and mortality in place of Canadian data results in lower numbers (3,531,600 people) than those of the medium scenario. This is a difference of around 500,000 people (-12.6%) compared with the medium scenario’s estimates. This result suggests that the impact of using American data is more important for mortality than fertility. Despite this discrepancy, the age structure of the two scenarios are very close. Although the differences are significant, these results suggest that using Canadian data for the fertility and mortality assumptions appear plausible.
9.2.3 Citizenship transmission rates
As mentioned in the section on fertility assumptions, many people born abroad to or adopted abroad by citizen parents and who are entitled to citizenship do not necessarily choose to take the steps to obtain it. Because of a lack of international sources that give proper information on Canadian citizens by descent, this study uses transmission rates calculated using the 2016 Census. This assumption has a higher degree of uncertainty. This is why three fertility assumptions were developed in this study, with each being based on a different transmission rate. It must be remembered that the TFRs and the adjustment for male fertility remain the same in all three assumptions. Two special scenarios were designed to assess the effect of the three fertility assumptions on the estimates of the number of Canadian citizens who live abroad. Both of these scenarios are based on the medium scenario, with the difference that they use the low and high fertility assumptions.
The following table shows the results of this comparison.
| Scenario | Emigrants | Returning emigrants | Natural increase | Total |
|---|---|---|---|---|
| number | ||||
| Medium numbers | 4,464,000 | 1,080,500 | 655,300 | 4,038,700 |
| Medium numbers (low fertility) | 4,464,000 | 1,080,500 | -247,900 | 3,135,600 |
| Medium numbers (high fertility) | 4,464,000 | 1,080,500 | 1,961,500 | 5,345,000 |
Using the different fertility assumptions has a significant effect on the estimates of the diaspora’s size. The medium scenario combined with the low fertility assumption gives a lower estimate than that of the medium scenario by 22.4%, while using the high fertility assumption gives a higher estimate by 32.3%. Thus, the uncertainty concerning citizenship transmission is greater. This result was expected, given the lack of sources to directly measure this phenomenon. It is certainly a significant limitation for estimating the Canadian diaspora.
9.2.4 Potential diaspora
Even if they are entitled to Canadian citizenship, some people never apply for it, meaning that not all births abroad to parents who are Canadian citizens then become part of the Canadian diaspora. A scenario was developed to propose an estimate of the diaspora’s size if everybody born abroad who are entitled to Canadian citizenship are citizens. In some ways, it represents the maximum potential size of the Canadian diaspora. This scenario is developed using the “high numbers” scenario, with the difference that all births abroad to Canadian citizens are included in the diaspora.
The following table shows the results of the comparison.
| Scenario | Emigrants | Returning emigrants | Natural increase | Total |
|---|---|---|---|---|
| number | ||||
| Medium numbers | 4,464,000 | 1,080,500 | 655,300 | 4,038,700 |
| Potential diaspora | 4,653,900 | 1,080,500 | 7,394,700 | 10,968,200 |
According to the “potential diaspora” scenario, the size of the diaspora may reach close to 11 million people if everyone who was born abroad to one or two Canadian citizen parents also had Canadian citizenship. This number surpasses that of the medium scenario by nearly 7 million people. This discrepancy is very much due to births abroad. Close to 9 million people in the “potential diaspora” scenario, representing 80% of the diaspora, would be citizens by descent and potential citizens by descent. These results suggest that there is a significant pool of potential citizens by descent abroad.
Conclusion
The fact that hundreds of thousands of Canadians live abroad raises various issues, namely concerning the services to provide them, potential returns to Canada and ties to communities or people abroad. However, the size and characteristics of this population remain largely unknown given a lack of data that would allow it to be studied directly.
The purpose of this study was to provide an estimate of the number of Canadian citizens who live abroad. To do this, elaborate demographic methods were used to estimate each demographic event that influences the size of the Canadian diaspora over 95 years. These techniques rely on several Canadian and international data sources. Afterwards, three scenarios were developed to provide a plausible range in the number of Canadian citizens who lived abroad in 2016. Lastly, several analyses were carried out to evaluate the model’s consistency with the results from other sources and its sensitivity to different assumptions.
According to the “medium numbers” scenario developed in this study, 4,038,700 Canadian citizens lived abroad in 2016. This falls between the 2,953,500 and 5,549,800 people in the “low numbers” and “high numbers” scenarios. The diaspora would represent a bit more than 10% of the number of Canadian citizens who lived in Canada in 2016.
According to the “potential diaspora” scenario, the size of the diaspora may reach a bit more than 10 million people if all people born abroad to one or two Canadian parents were automatically considered to be citizens. This result suggests that there is a significant pool of potential citizens by descent abroad.
Around half of the Canadian citizens who live abroad are citizens by descent, that is, they were born abroad to citizen parents from whom they obtained citizenship. Citizens by birth who were born in Canada make up about one-third of the diaspora, while naturalized citizens represent 15% of the diaspora.
The diaspora’s age structure appears to be a bit older than that of the Canadian population, mainly because of the partial transmission of citizenship to citizens by descent and the contribution of emigration to the diaspora. The diaspora appears to be made up of a rather similar number of men and women.
These results must be interpreted with some caution, since they include an appreciable amount of uncertainty. This is the first time that Statistics Canada has made estimates of the size of this population. These estimates rely on a high degree of modelling given the lack of data directly measuring this particular population. The extent of the range created by the low, medium and high scenarios also shows this degree of uncertainty.
Consistency analyses were carried out by comparing the results of this study with those of other sources.
The estimates calculated in this study generally show a high level of consistency with the estimates from other sources. The estimates are very consistent with UN statistics for the Canadian-born population who live abroad. This suggests that the method used in this study provides plausible results.
Furthermore, the age and sex structure of the diaspora estimates corresponds well to that of the ACS for the Canadian-born population who live in the United States.
However, the estimates in this study are lower than those of the APFC, even when using the residual method over the same period used by the APFC. Since the residual method was consistent with emigration assumptions, the APFC may have overestimated the number of people who emigrated from Canada and who were still alive in 2001.
Sensitivity analyses were also carried out to test the impact of some assumptions on the estimates. In this exercise, the two demographic events that showed the highest level of uncertainty were the emigration of Canadian citizens and births to citizens abroad (particularly the transmission of citizenship).
Emigration has always been challenging to measure with accuracy, both in Canada and elsewhere in the world. Nevertheless, the emigration assumptions fit relatively well with international statistics, like those of the UN and the ACS, as well as the residual method results for net emigration. As a result, the emigration assumptions used for this study seems plausible.
Births to Canadian citizens abroad were the main source of uncertainty in this study. The use of Canada’s fertility rates seemed to be a plausible assumption. The use of American data in place of Canadian data for the fertility and mortality assumptions resulted in lower estimates, even though the order of magnitude remained the same. The adjustment for male fertility is also relatively plausible, despite its significant effect on the number of births.
The main grey area in the fertility assumptions is the transmission of citizenship to children born abroad. Because of the lack of data on the transmission of citizenship in the main destination countries for Canadian emigrants, transmission rates noted in the 2016 Census were used for the nationals of certain countries. It was an indirect approach based on assumptions that involved a high level of uncertainty. Sensitivity analyses suggested that the impact of this approach on the number of citizens by descent was significant. A potential avenue for research to refine the accuracy of estimates of the number of citizens by descent would be to acquire data on citizenship by descent from IRCC. These data could replace the three fertility assumptions developed here.
This study does not provide any information on the country of residence for members of the Canadian diaspora. However, while relevant, this information is mostly available in international data sources, which excludes naturalized citizens and citizens by descent. Data on passports issued or from the Registration of Canadians Abroad service, for example, had some potential for calculating an estimate of the number of Canadian citizens who live abroad by country of residence. In that regard, the APFC (2011) tried to break down the Canadian diaspora by country of residence by incorporating several data sources, but this study has many limitations.
In conclusion, despite the limitations of the methods used in this document, this study shows how innovative demographic methods that incorporate several data sources can be used to estimate the size and basic demographic characteristics of a population of interest that is very difficult to measure.
Appendix tables
| Age group | Total | Citizens by birth born in Canada and citizens by naturalization |
Citizens by descent | ||||||
|---|---|---|---|---|---|---|---|---|---|
| Total | Male | Female | Total | Male | Female | Total | Male | Female | |
| number | |||||||||
| 0 to 4 years | 44,134 | 20,895 | 23,239 | 5,336 | 2,732 | 2,604 | 38,798 | 18,163 | 20,635 |
| 5 to 9 years | 112,837 | 59,899 | 52,938 | 30,253 | 16,822 | 13,431 | 82,584 | 43,077 | 39,507 |
| 10 to 14 years | 122,547 | 67,160 | 55,387 | 35,343 | 21,170 | 14,173 | 87,204 | 45,990 | 41,214 |
| 15 to 19 years | 106,817 | 53,636 | 53,181 | 20,870 | 10,846 | 10,024 | 85,947 | 42,790 | 43,157 |
| 20 to 24 years | 111,364 | 61,204 | 50,160 | 24,269 | 13,493 | 10,776 | 87,095 | 47,711 | 39,384 |
| 25 to 29 years | 150,342 | 81,845 | 68,497 | 46,697 | 24,996 | 21,701 | 103,645 | 56,849 | 46,796 |
| 30 to 34 years | 176,131 | 94,822 | 81,309 | 78,370 | 39,353 | 39,017 | 97,761 | 55,469 | 42,292 |
| 35 to 39 years | 196,436 | 103,279 | 93,157 | 109,324 | 54,746 | 54,578 | 87,112 | 48,533 | 38,579 |
| 40 to 44 years | 208,680 | 110,893 | 97,787 | 129,440 | 65,840 | 63,600 | 79,240 | 45,053 | 34,187 |
| 45 to 49 years | 244,497 | 128,249 | 116,248 | 161,799 | 83,013 | 78,786 | 82,698 | 45,236 | 37,462 |
| 50 to 54 years | 262,730 | 138,390 | 124,340 | 171,832 | 90,606 | 81,226 | 90,898 | 47,784 | 43,114 |
| 55 to 59 years | 231,322 | 121,748 | 109,574 | 160,937 | 85,054 | 75,883 | 70,385 | 36,694 | 33,691 |
| 60 to 64 years | 213,890 | 106,507 | 107,383 | 156,712 | 76,295 | 80,417 | 57,178 | 30,212 | 26,966 |
| 65 to 69 years | 201,659 | 96,571 | 105,088 | 165,852 | 77,786 | 88,066 | 35,807 | 18,785 | 17,022 |
| 70 to 74 years | 177,984 | 85,460 | 92,524 | 150,997 | 71,465 | 79,532 | 26,987 | 13,995 | 12,992 |
| 75 to 79 years | 141,570 | 67,533 | 74,037 | 125,123 | 58,840 | 66,283 | 16,447 | 8,693 | 7,754 |
| 80 to 84 years | 109,063 | 52,446 | 56,617 | 96,616 | 45,959 | 50,657 | 12,447 | 6,487 | 5,960 |
| 85 to 89 years | 79,518 | 38,422 | 41,096 | 70,287 | 33,626 | 36,661 | 9,231 | 4,796 | 4,435 |
| 90 to 94 years | 45,510 | 21,663 | 23,847 | 42,020 | 19,815 | 22,205 | 3,490 | 1,848 | 1,642 |
| 95 years and over | 16,469 | 7,513 | 8,956 | 16,323 | 7,448 | 8,875 | 146 | 65 | 81 |
| Age group | Total | Citizens by birth born in Canada and citizens by naturalization |
Citizens by descent | ||||||
|---|---|---|---|---|---|---|---|---|---|
| Total | Male | Female | Total | Male | Female | Total | Male | Female | |
| number | |||||||||
| 0 to 4 years | 73,402 | 35,008 | 38,394 | 5,869 | 3,002 | 2,867 | 67,533 | 32,006 | 35,527 |
| 5 to 9 years | 158,983 | 82,872 | 76,111 | 33,479 | 18,566 | 14,913 | 125,504 | 64,306 | 61,198 |
| 10 to 14 years | 155,652 | 82,021 | 73,631 | 39,975 | 23,841 | 16,134 | 115,677 | 58,180 | 57,497 |
| 15 to 19 years | 139,999 | 70,911 | 69,088 | 23,933 | 12,397 | 11,536 | 116,066 | 58,514 | 57,552 |
| 20 to 24 years | 179,896 | 92,001 | 87,895 | 27,639 | 15,231 | 12,408 | 152,257 | 76,770 | 75,487 |
| 25 to 29 years | 235,493 | 117,961 | 117,532 | 53,456 | 28,348 | 25,108 | 182,037 | 89,613 | 92,424 |
| 30 to 34 years | 278,023 | 136,562 | 141,461 | 89,125 | 44,564 | 44,561 | 188,898 | 91,998 | 96,900 |
| 35 to 39 years | 299,949 | 148,847 | 151,102 | 123,294 | 61,729 | 61,565 | 176,655 | 87,118 | 89,537 |
| 40 to 44 years | 311,753 | 156,103 | 155,650 | 145,393 | 73,914 | 71,479 | 166,360 | 82,189 | 84,171 |
| 45 to 49 years | 364,998 | 184,669 | 180,329 | 179,897 | 92,188 | 87,709 | 185,101 | 92,481 | 92,620 |
| 50 to 54 years | 378,775 | 192,134 | 186,641 | 188,522 | 99,225 | 89,297 | 190,253 | 92,909 | 97,344 |
| 55 to 59 years | 327,567 | 160,867 | 166,700 | 176,052 | 92,818 | 83,234 | 151,515 | 68,049 | 83,466 |
| 60 to 64 years | 280,570 | 131,365 | 149,205 | 172,495 | 83,840 | 88,655 | 108,075 | 47,525 | 60,550 |
| 65 to 69 years | 247,807 | 115,244 | 132,563 | 181,892 | 85,537 | 96,355 | 65,915 | 29,707 | 36,208 |
| 70 to 74 years | 198,277 | 93,937 | 104,340 | 162,523 | 77,501 | 85,022 | 35,754 | 16,436 | 19,318 |
| 75 to 79 years | 149,699 | 70,897 | 78,802 | 131,826 | 62,307 | 69,519 | 17,873 | 8,590 | 9,283 |
| 80 to 84 years | 112,362 | 53,910 | 58,452 | 100,367 | 47,912 | 52,455 | 11,995 | 5,998 | 5,997 |
| 85 to 89 years | 81,935 | 39,396 | 42,539 | 72,341 | 34,671 | 37,670 | 9,594 | 4,725 | 4,869 |
| 90 to 94 years | 46,916 | 22,243 | 24,673 | 42,954 | 20,251 | 22,703 | 3,962 | 1,992 | 1,970 |
| 95 years and over | 16,644 | 7,578 | 9,066 | 16,568 | 7,554 | 9,014 | 76 | 24 | 52 |
| Age group | Total | Citizens by birth born in Canada and citizens by naturalization |
Citizens by descent | ||||||
|---|---|---|---|---|---|---|---|---|---|
| Total | Male | Female | Total | Male | Female | Total | Male | Female | |
| number | |||||||||
| 0 to 4 years | 98,387 | 43,290 | 55,097 | 6,408 | 3,275 | 3,133 | 91,979 | 40,015 | 51,964 |
| 5 to 9 years | 236,324 | 121,295 | 115,029 | 36,713 | 20,314 | 16,399 | 199,611 | 100,981 | 98,630 |
| 10 to 14 years | 214,306 | 112,388 | 101,918 | 44,604 | 26,511 | 18,093 | 169,702 | 85,877 | 83,825 |
| 15 to 19 years | 203,182 | 108,549 | 94,633 | 26,996 | 13,951 | 13,045 | 176,186 | 94,598 | 81,588 |
| 20 to 24 years | 306,221 | 163,970 | 142,251 | 31,015 | 16,962 | 14,053 | 275,206 | 147,008 | 128,198 |
| 25 to 29 years | 472,681 | 259,395 | 213,286 | 60,203 | 31,686 | 28,517 | 412,478 | 227,709 | 184,769 |
| 30 to 34 years | 504,540 | 271,433 | 233,107 | 99,877 | 49,769 | 50,108 | 404,663 | 221,664 | 182,999 |
| 35 to 39 years | 436,710 | 237,115 | 199,595 | 137,291 | 68,725 | 68,566 | 299,419 | 168,390 | 131,029 |
| 40 to 44 years | 404,582 | 219,966 | 184,616 | 161,338 | 81,991 | 79,347 | 243,244 | 137,975 | 105,269 |
| 45 to 49 years | 409,496 | 218,724 | 190,772 | 197,988 | 101,363 | 96,625 | 211,508 | 117,361 | 94,147 |
| 50 to 54 years | 443,135 | 235,139 | 207,996 | 205,209 | 107,851 | 97,358 | 237,926 | 127,288 | 110,638 |
| 55 to 59 years | 404,738 | 217,491 | 187,247 | 191,193 | 100,592 | 90,601 | 213,545 | 116,899 | 96,646 |
| 60 to 64 years | 353,159 | 166,173 | 186,986 | 188,292 | 91,376 | 96,916 | 164,867 | 74,797 | 90,070 |
| 65 to 69 years | 305,715 | 143,389 | 162,326 | 197,924 | 93,264 | 104,660 | 107,791 | 50,125 | 57,666 |
| 70 to 74 years | 248,864 | 120,536 | 128,328 | 174,030 | 83,545 | 90,485 | 74,834 | 36,991 | 37,843 |
| 75 to 79 years | 193,345 | 91,377 | 101,968 | 138,568 | 65,793 | 72,775 | 54,777 | 25,584 | 29,193 |
| 80 to 84 years | 149,768 | 68,715 | 81,053 | 104,090 | 49,846 | 54,244 | 45,678 | 18,869 | 26,809 |
| 85 to 89 years | 98,659 | 49,001 | 49,658 | 74,417 | 35,730 | 38,687 | 24,242 | 13,271 | 10,971 |
| 90 to 94 years | 49,085 | 22,847 | 26,238 | 43,885 | 20,682 | 23,203 | 5,200 | 2,165 | 3,035 |
| 95 years and over | 16,903 | 7,704 | 9,199 | 16,859 | 7,681 | 9,178 | 44 | 23 | 21 |
References
Agunias, Dovelyn Rannveig and Kathleen Newland. 2012. Developing a Road Map for Engaging Diasporas in Development. A Handbook for Policymakers and Practitioners in Home and Host Countries. International Organization for Migration and Migration Policy Institute. 260 pages.
Asia Pacific Foundation of Canada. 2011. Canadians Abroad: Canada’s Global Asset. 66 pages.
Beaujot, Rodrigue and J. Peter Rappak. 1989. “The Link Between Immigration and Emigration in Canada, 1945-1986”. Canadian Studies in Population. Volume 16. Number 2. Pages 201 to 216.
Bélanger, Alain and Stéphane Gilbert. 2006. “The Fertility of Immigrant Women and their Canadian-Born Daughters”. Report on the Demographic Situation in Canada 2002. September 2006. Statistics Canada catalogue number 91-209. Pages 127 to 152.
Bérard-Chagnon, Julien. 2018. “Measuring Emigration in Canada: Review of Available Data Sources and Methods”. Demographic Documents. Number 14. Statistics Canada catalogue number 91F0015M. 39 pages.
Bérard-Chagnon, Julien, Stacey Hallman and Geneviève Caron. 2019. “Recent immigrants and non-permanent residents missed in the 2011 Census”. Ethnicity, Language and Immigration Thematic Series. May 22, 2019. Statistics Canada catalogue number 89-657-X. 34 pages.
Bérard-Chagnon, Julien and Marie-Noëlle Parent. 2021. “Coverage of the 2016 Census: Level and trends”. Demographic Documents. Number 17. Statistics Canada catalogue number 91F0015M. 22 pages.
Bilan, Iuliia. 2020. La fécondité de la diaspora canadienne résidant aux États-Unis : un ajustement pour tenir compte des enfants nés d’un père canadien et d’une mère non canadienne. Master paper presented to the Graduate and Postdoctoral Studies to obtain a Maîtrise ès Sciences (M.Sc.) in demography. Département de démographie. Université de Montréal. 43 pages.
Canon, Lorena. 2017. Analyse de la distribution des décès aux grands âges selon le niveau de scolarité à partir d’un suivi de la mortalité sur 20 ans au Canada. Master Thesis. Département de démographie. Université de Montréal. 65 pages.
Chant, John. 2006. “The Passport Package: Rethinking the Citizenship Benefits of Non-Resident Canadians”. C.D. Howe Institute Backgrounder. Number 99. December 2006. 16 pages.
Chen, Victor Z., Don Devoretz and Kenny Zhang. 2009. Out-Migration of Canadians Between 1996 and 2006: Evidence from Canadian Censuses. Asia Pacific Foundation of Canada. September 2009. 36 pages.
Devoretz, Don. 2009. Canada’s Secret Province: 2.8 Million Canadians Abroad. Asia Pacific Foundation of Canada. October 29, 2009. 20 pages.
Devoretz, Don and Michele Battisti. 2009. Profiling Canadians in the United States and Hong Kong. Asia Pacific Foundation of Canada. January 2009.
Dion, Patrice and Mireille Vézina. 2010. “Emigration from Canada to the United States from 2000 to 2006”. Canadian Social Trends. Winter 2010. Number 90. July 13, 2010. Statistics Canada catalogue number 11-008-X Canada. Pages 57 to 67.
Dumont, Jean-Christophe and Georges Lemaître. 2006. “Counting Immigrants and Expatriates in OECD Countries: A New Perspective”. OECD Economic Studies. Volume 2005. Number 1. 40 pages.
Finnie, Ross. 2006. “International Mobility: Patterns of Exit and Return of Canadians, 1982 to 2003”. Analytical Studies Branch Research Paper Series. Number 288. Statistics Canada catalogue number 11F0019. 61 pages.
Frank, Jeff and Éric Bélair. 1999. South of the Border. Graduates from the Class of ’95 Who Moved to the United States. Statistics Canada catalogue number 81-587-XPB. 55 pages.
George, M. V. 1976. “Population Growth in Canada”. Profile Studies 1971 Census of Canada. April 1976. Statistics Canada catalogue number 99-701. 76 pages.
Jensen, Eric B. 2013. “A Review of Methods for Estimating Emigration”. Working Paper No. 101. U.S. Census Bureau. September 2013. 35 pages.
Jensen, Eric, Renuka Bhaskar and Melissa Scopolliti. 2015. “Demographic Analysis 2010: Estimates of Coverage of the Foreign-Born Population in the American Community Survey”. U.S. Census Bureau Working Paper. Number 103. Population Division. June 2015. 34 pages.
Lavoie, Yolande. 1981. “L’émigration des Québécois aux États-Unis de 1840 à 1930”. Documentation du Conseil de la langue française.
Michalowski, Margaret. 1991. “Foreign-born Canadian Emigrants and Their Characteristics, (1981-1986)”. International Migration Review. Volume 25. Number 1. Spring 1991. Pages 28 to 59.
Ng, Edward. 2011. “The healthy immigrant effect and mortality rates”. Health Reports. Volume 22. Number 4. November 2011. Statistics Canada catalogue number 82-003-XPE. 6 pages.
OECD. 2015. Connecting with Emigrants: A Global Profile of Diasporas 2015. OECD Editions. November 3, 2015. 460 pages.
Provencher, Claudine, Anne Milan, Stacey Hallman and Carol D’Aoust. 2018. “Fertility: Overview, 2012 to 2016”. Report on the Demographic Situation in Canada. June 5, 2018. Statistics Canada catalogue number 91-209-X. 19 pages.
Robinson, Gregory J. 2010. Coverage of Population in Census 2000 Based on Demographic Analysis: The History Behind The Numbers. U.S. Census Bureau. Population Division. Working Paper. Number 91. 49 pages.
Sirag, Elham and Patrice Dion. 2020. “Chapter 6: Projection of Emigration”. Population Projections for Canada (2018 to 2068), Provinces and Territories (2018 to 2043): Technical Report on Methodology and Assumptions. July 10, 2020. Statistics Canada catalogue number 91-620-X. 89 pages.
Statistics Canada. 2003. Population and Family Estimation Methods at Statistics Canada. April 2003. Catalogue number 91-528. 168 pages.
Statistics Canada. 2016. Population and Family Estimation Methods at Statistics Canada. March 3, 2016. Catalogue number 91-528. 96 pages.
- Date modified: