
Annual Demographic Estimates: Canada, Provinces and Territories, 2021
Analysis: Total Population
Skip to text
Text begins
The estimates in this publication are based on 2016 Census counts, adjusted for census net undercoverage and incompletely enumerated Indian reserves, plus the estimated population growth for the period from May 10, 2016, to the date of the estimate. The analysis in this publication is based on preliminary data. These data will be revised over the coming years, and some trends described in this publication could change as a result of these revisions. Therefore, this publication should be interpreted with caution.
The analyses in this document focus on the period July 1, 2020 to June 30, 2021. The estimates for some demographic components were adjusted to take into account the effect of the global COVID-19 pandemic on the population of Canada.
For an explanation of how the population estimates have taken COVID-19 into account, please see: Technical Supplement: Production of Demographic Estimates for the Second Quarter of 2020 in the Context of COVID-19.This section presents the population estimates for Canada, the provinces and territories on July 1, 2021, along with a concise analysis of the various components of population growth between July 1, 2020 and July 1, 2021.
Canada’s population reaches 38.2 million
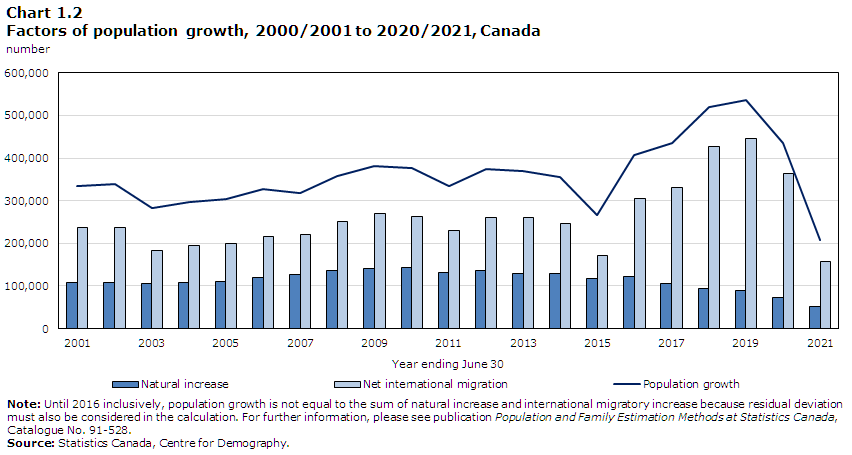
On July 1, 2021, Canada’s population was estimated at 38,246,108, up 208,904 from July 1, 2020 (+0.5%). This growth is lower than what had been seen in recent years with a growth rate of 1.4% in 2018/2019 and 1.2% in 2019/2020. The slower growth seen in 2020/2021 results mainly from the impact of the COVID-19 pandemic, both due to the increased number of deaths and the restrictions placed on international borders that led to a significant reduction in international migration.
Record-low peacetime population growth
Prior to this year, the third quarter of 2019 had the highest growth (+210,169, +0.6%) ever recorded for any quarter since the beginning of the period covered by the current demographic accounting system (July 1971). Conversely, the third quarter of 2020 had the lowest growth ever recorded for any quarter, showing a net loss of population for the first time since at least 1971 (-4,190, -0.0%).
Unlike 2019/2020 where only the last few months were affected by the mortality due to COVID-19 and the impact of the restrictions placed on international borders, the ongoing pandemic affected the whole of 2020/2021. With international migration reduced and additional deaths, Canada’s population grew by only 208,904 (+0.5%) people in 2020/2021. This corresponds to the smallest number of people gained since 1944/1945 and the lowest rate of growth since 1915/1916, both periods when Canada was at war. The second half of 2020 was particularly affected with population increasing by only 31,668 between July and December. The first and second quarters of 2021 showed some signs of recovery with population increasing by 177,236 between January and June 2021. This is an increase compared to the same period in 2020 (128,605) although it was still below the levels seen in 2019 over the same period (275,995) before the pandemic.

Data table for Chart 1.1
| Year ending June 30 | Percent |
|---|---|
| 2001 | 1.09 |
| 2002 | 1.09 |
| 2003 | 0.90 |
| 2004 | 0.93 |
| 2005 | 0.94 |
| 2006 | 1.01 |
| 2007 | 0.97 |
| 2008 | 1.08 |
| 2009 | 1.14 |
| 2010 | 1.11 |
| 2011 | 0.98 |
| 2012 | 1.09 |
| 2013 | 1.06 |
| 2014 | 1.01 |
| 2015 | 0.75 |
| 2016 | 1.13 |
| 2017 | 1.20 |
| 2018 | 1.41 |
| 2019 | 1.44 |
| 2020 | 1.15 |
| 2021 | 0.55 |
| Source: Statistics Canada, Centre for Demography. | |
Border restrictions upend trends in immigration
Following the implementation of international border restrictions in March 2020, international migrationNote levels dropped significantly. Most of these measures have remained in place over the 2020/2021 period, impacting both immigrants and non-permanent residents. In fact, population increase through international migration for 2020/2021 was at 156,503, a two thirds reduction compared to the all-time high of 446,169 recorded in 2018/2019, the last year unaffected by the pandemic.
Migration patterns changed over the year with the third quarter of 2020 seeing net losses to international migration of 27,841, the highest losses of any quarterNote . The situation improved in the following quarters with the fourth quarter of 2020 and first and second quarters of 2021 showing net gains of 33,143, 76,117 and 75,084, respectively. Although borders were subject to the same restrictions, this increase can be explained in part by the 2021 immigration plan and the Government of Canada’s intention to grant “permanent status to temporary workers and international graduates who are already in Canada and who possess the skills and experience we need to fight the pandemic and accelerate our economic recovery”. Nevertheless, this recovery remained only partial with the second quarter of 2021 showing gains around half the levels seen in the same quarter before the pandemic (second quarter of 2019).
Looking more closely at the components of international migration, we see that the number of new immigrants to Canada in 2020/2021 was 226,203, down from 284,157 the year prior. We have to go back to 2002/2003 to find a lower number of immigrants (199,170). The admission of non-permanent residents was also impacted with a net loss of 42,884 in 2020/2021, the highest losses since 1992/1993, and significantly less than the gains of 76,349 recorded the preceding year. In particular, the third quarter of 2020 saw net losses of 66,762 non-permanent residents, the biggest of any quarter. The number of non-permanent residents recovered partially over the rest of 2020/2021 to show gains of 14,760 and 12,559 during the first and second quarters of 2021, respectively. This recovery was mainly due to an increase in work permit holders.
The components of emigration were also lower in 2020/2021 than the prior year and years before the pandemic, again the result of COVID-19 imposed border restrictions. The number of Canadian citizens or immigrants who have left Canada on a permanent basis, emigrants, was 20% lower in 2020/2021 than in 2019/2020 at 29,677 (down from 36,899). The decrease was mainly due to lower levels of emigration seen in the third and fourth quarter of 2020, with the first and second quarters of 2021 having returned to pre-pandemic levels. The number of returning emigrants, Canadians returning home after living abroad, saw a more dramatic decrease from 54,524 in 2019/2020 to 8,256 in 2020/2021. However, it is important to note that the levels seen in 2019/2020 were the highest on record, with the first and second quarters of 2020 being particularly high after the government asked Canadians abroad to come home at the beginning of the pandemic in March of that year. However, the figure observed in 2020/2021 was still lower than for any year on record prior to the pandemic.
Reduced international migration remains the main driver of population growth
At the national level, population growth is the result of two factors: international migration and natural increase (births minus deaths). Between July 1, 2020 and July 1, 2021, 74.9% of Canada’s growth came from international migration, representing a net increase of 156,503 persons. The proportion is less than what was seen the year prior (83.2%) even though international migration was down over 50% (362,558 in 2019/2020). This is due to the other factor of growth, natural increase, also seeing a decrease due to 17,688Note deaths attributed to COVID-19 over the same period and 10,803 (-2.9%) fewer births compared to the previous year. Combined, Canada saw a natural increase in 2020/2021 of 52,401 persons, a 28.6% decrease from 2019/2020 (73,416), accelerating the downward trend seen over the last decade resulting from population aging.
In total, there were 307,132 deaths recorded in Canada in 2020/2021, a new high and a 3.4% increase compared to 2019/2020. The fourth quarter of 2020 (81,860) saw the highest number of deaths for any quarter since at least 1971, a significant increase from the fourth quarter of 2019 (74,251). Over 2020/2021, mortality due to COVID-19 (17,688 deaths) contributed 5.8% of total deaths. Canada saw 359,533 births over 2020/2021, a decrease from the year prior (370,336). The impact of the pandemic on this decrease remains unclear since the number of births had been trending downwards since 2016/2017 (379,906). While we observed fewer births between July and December 2020 than the year prior (179,043 compared to 190,475 for the same period in 2019), the January to June 2021 period is similar to the same period in 2020 (180,490 to 179,861, respectively). The January to June 2021 period is of particular interest since those births correspond to pregnancies occurring entirely during the pandemic and do not show a decrease as was seen in the prior 6-month period.Note
Data table for Chart 1.2
| Year ending June 30 | Natural increase | Net international migration | Population growth |
|---|---|---|---|
| number | |||
| 2001 | 107,993 | 236,700 | 335,172 |
| 2002 | 107,661 | 237,935 | 339,177 |
| 2003 | 106,618 | 183,749 | 283,949 |
| 2004 | 108,933 | 194,128 | 296,627 |
| 2005 | 109,364 | 200,154 | 303,098 |
| 2006 | 120,593 | 216,093 | 327,421 |
| 2007 | 127,091 | 219,749 | 317,851 |
| 2008 | 137,170 | 249,993 | 358,093 |
| 2009 | 141,582 | 269,184 | 381,777 |
| 2010 | 142,235 | 262,750 | 375,994 |
| 2011 | 131,456 | 230,981 | 334,439 |
| 2012 | 136,430 | 260,564 | 374,894 |
| 2013 | 129,951 | 260,820 | 368,732 |
| 2014 | 129,229 | 247,290 | 354,481 |
| 2015 | 117,154 | 170,354 | 265,473 |
| 2016 | 121,492 | 304,047 | 406,579 |
| 2017 | 105,643 | 330,106 | 435,749 |
| 2018 | 92,990 | 426,858 | 519,848 |
| 2019 | 89,977 | 446,169 | 536,146 |
| 2020 | 73,416 | 362,558 | 435,974 |
| 2021 | 52,401 | 156,503 | 208,904 |
|
Note: Until 2016 inclusively, population growth is not equal to the sum of natural increase and international migratory increase because residual deviation must also be considered in the calculation. For further information, please see publication Population and Family Estimation Methods at Statistics Canada, Catalogue No. 91-528-X. Source: Statistics Canada, Centre for Demography. |
|||
International migratory growth lower across Canada
Throughout Canada, every province and territory saw a smaller population increase from international migration in 2020/2021 than the previous year (except for Yukon). Among the most populous provinces, Quebec saw the largest decrease in international migration at 77.8% (52,493 fewer), followed by Alberta at 55.3% (20,065 fewer), Ontario at 54.3% (92,333 fewer) and British Columbia at 49.7% (21,323 fewer).
Border restrictions led to most provinces and territories welcoming fewer new immigrants and non-permanent residents. Among the provinces, Saskatchewan saw the most dramatic decrease in the number of immigrants (-45.2%), while Quebec was the only province to remain at similar levels as were seen in 2019/2020 (+1.1%). The latter is potentially due to Quebec already having experienced the most significant decrease in 2019/2020 (-25.8%).
At the provincial and territorial level, only Prince Edward Island (+914), New Brunswick (+1,395), Manitoba (+252) and Yukon (+126) saw net gains in non-permanent residents. With border restrictions making it difficult for those holding non-permanent resident permits to enter the country starting in March 2020, provinces that usually welcome the most non-permanent residents saw the largest losses. Ontario saw net losses of 18,168 non-permanent residents, compared to gains of 71,709 in 2018/2019 before the pandemic. Similarly, Quebec recorded losses of 14,917 non-permanent residents in 2020/2021, while British Columbia lost 7,031. Such losses had not been experienced by these provinces in almost three decades, and not since at least 1971/1972 for British Columbia.
While the annual international migration figures show the considerable impact that the pandemic had on population growth across the country, signs of recovery were visible in the first half of 2021. All provinces and territories welcomed more immigrants between January and June 2021 than they did between July and December 2020. Ontario, Quebec and British Columbia even welcomed similar number of immigrants in the first and second quarters of 2021 as they did in the same quarters of 2019 before the pandemic. While movement of non-permanent residents remained restricted, the first and second quarters of 2021 showed net gains in non-permanent residents (+14,760 and +12,559, respectively), following losses in all previous quarters since the beginning of the pandemic (second quarter of 2020). Among the provinces, only Quebec (-2,302) saw losses during the first quarter of 2021 while Alberta (-1,060) is the only one that saw losses in the second quarter.
Canada’s slowly changing geographical population distribution
On July 1, 2021, the four most populous provinces remained: Ontario (14,826,276), Quebec (8,604,495), British Columbia (5,214,805) and Alberta (4,442,879). Together, they were home to 86.5% of Canadians. Ontario alone is home to 38.8% of Canada’s population, a figure that has remained relatively stable for two decades. Provinces and territories west of Ontario accounted for 32.3% of total population, ahead of provinces East of Ontario that accounted for 28.9% of population. Migration flows have generally been favourable to provinces and territories west of Ontario, helping them grow their demographic weight for decades, surpassing the combined demographic weight of provinces east of Ontario in 2007.

Data table for Chart 1.3
| Provinces and territories | Proportion |
|---|---|
| Ont. | 38.8% |
| Que. | 22.5% |
| B.C. | 13.6% |
| Alta. | 11.6% |
| Man. | 3.6% |
| Sask. | 3.1% |
| N.S. | 2.6% |
| N.B. | 2.1% |
| N.L. | 1.4% |
| P.E.I. | 0.4% |
| N.W.T. | 0.1% |
| Y.T. | 0.1% |
| Nvt. | 0.1% |
| Source: Statistics Canada, Centre for Demography. | |
Population growth showing signs of recovery across the country in the first half of 2021
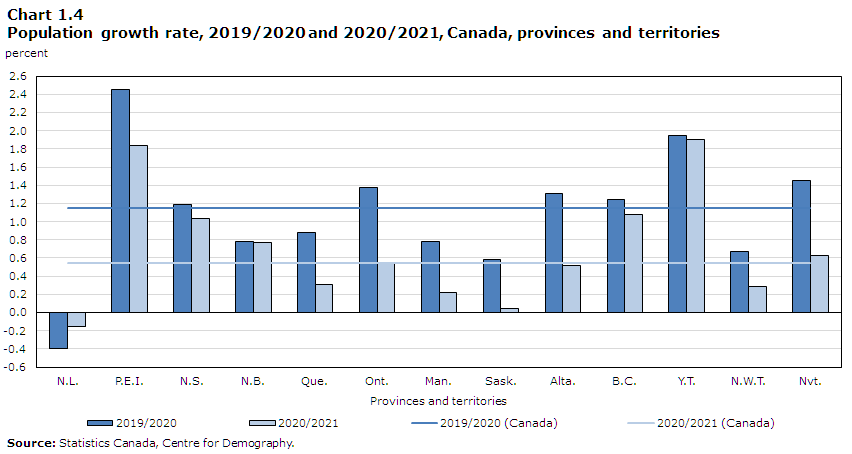
All but one of the provinces and territories experienced a slower growth in 2020/2021 than a year prior. The exception is Newfoundland and Labrador, which saw a small increase between 2019/2020 and 2020/2021 (-0.4% and -0.2%, respectively). Except for Nunavut (+0.6%), the Northwest Territories (+0.3%) and Newfoundland and Labrador (-0.2%), this was the second year in a row for all provinces and territories to experience reduced population growth.
Ontario, Quebec and Alberta are the provinces that saw the largest decrease in population growth. Ontario grew by 80,564 people (+0.5%), 120,447 fewer people than the year before and the smallest growth in four decades. Quebec gained 26,195 people (+0.3%), 48,622 fewer than in 2019/2020. Finally, Alberta grew by 22,850 people (+0.5%), 34,603 fewer than the year before and the smallest growth since 1987/1988. Combined, the lower growth in these three provinces amount to 203,672 fewer people than in 2019/2020 representing 89.7% of the reduction in growth for all of Canada.
While annual figures show broad decrease in growth across the country, the situation is quite different between the second half of 2020 (July to December) and the beginning of 2021 (January to June). As was seen at the national level, provinces gained few people in the second half of 2020 (July to December) with Quebec (1,070), Ontario (13,719) and British Columbia (5,191) seeing an 87.7% to 98.0% reduction in population growth for this period compared to the same in 2019. Things improved significantly in the first and second quarters of 2021 with all provinces and territories making gains. In the first 6 months of 2021, Quebec and Ontario added 25,125 and 66,845 people respectively, around half the gains seen for the same period in 2019 before the pandemic and more than the same period in 2020. British Columbia enjoyed favourable migration patterns leading to a gain of 50,886 people between January and June 2021, above levels seen in 2019 (46,652).
Data table for Chart 1.4
| Provinces and territories | 2019/2020 | 2020/2021 | 2019/2020 (Canada) | 2020/2021 (Canada) |
|---|---|---|---|---|
| percent | ||||
| N.L. | -0.4 | -0.2 | 1.2 | 0.5 |
| P.E.I. | 2.5 | 1.8 | 1.2 | 0.5 |
| N.S. | 1.2 | 1.0 | 1.2 | 0.5 |
| N.B. | 0.8 | 0.8 | 1.2 | 0.5 |
| Que. | 0.9 | 0.3 | 1.2 | 0.5 |
| Ont. | 1.4 | 0.5 | 1.2 | 0.5 |
| Man. | 0.8 | 0.2 | 1.2 | 0.5 |
| Sask. | 0.6 | 0.0 | 1.2 | 0.5 |
| Alta. | 1.3 | 0.5 | 1.2 | 0.5 |
| B.C. | 1.2 | 1.1 | 1.2 | 0.5 |
| Y.T. | 1.9 | 1.9 | 1.2 | 0.5 |
| N.W.T. | 0.7 | 0.3 | 1.2 | 0.5 |
| Nvt. | 1.4 | 0.6 | 1.2 | 0.5 |
| Source: Statistics Canada, Centre for Demography. | ||||
International migration remains an important driver of population growth in the provinces
For each of Ontario, Quebec, Saskatchewan, Manitoba and Prince Edward Island, international migration was the main driver behind their positive population growthNote in 2020/2021. Without it, both Manitoba and Saskatchewan would have seen their population shrink. Although not the main source of gains in other provinces in 2020/2021, international migration remains an important factor of population growth.
All four Atlantic provincesNote had negative natural increase for a fourth year in a row, meaning that they saw more deaths in 2020/2021 than births. These same four provinces gained population through interprovincial migration, as did British Columbia. Although Newfoundland and Labrador saw gains from interprovincial migration (+785) for the first time since 2015/2016 as well as gains from international migration (+337), they were not enough to compensate for the losses to natural increase (-1,933), resulting in a population decrease for the fifth year in a row.
Natural increase was an important contributor to growth in the Northwest Territories (+278) and Nunavut (+668) where it compensated for losses to other provinces (-260 and -437, respectively). Yukon saw gains in all factors of population growth with 134 from natural increase, 408 from international migration and 270 from migratory exchanges with other provinces and territories. British Columbia is the only other jurisdiction to see gains in all categories in 2020/2021 with a growth of 193 people from natural increase, 21,607 from international migration and 34,277 from interprovincial migration. Similarly to the national level, most gains at the provincial level occurred in the first half of 2021.

Data table for Chart 1.5
| Natural increase | International migratory increase | Interprovincial migratory increase | Population growth | ||
|---|---|---|---|---|---|
| rate (%) | |||||
| Canada | 0.1 | 0.4 | 0.0 | 0.5 | |
| N.L. | -0.4 | 0.1 | 0.2 | -0.2 | |
| P.E.I. | 0.0 | 1.3 | 0.6 | 1.8 | |
| N.S. | -0.2 | 0.3 | 1.0 | 1.0 | |
| N.B. | -0.2 | 0.5 | 0.5 | 0.8 | |
| Que. | 0.1 | 0.2 | 0.0 | 0.3 | |
| Ont. | 0.1 | 0.5 | -0.1 | 0.5 | |
| Man. | 0.2 | 0.7 | -0.7 | 0.2 | |
| Sask. | 0.3 | 0.6 | -0.8 | 0.0 | |
| Alta. | 0.4 | 0.4 | -0.3 | 0.5 | |
| B.C. | 0.0 | 0.4 | 0.7 | 1.1 | |
| Y.T. | 0.3 | 1.0 | 0.6 | 1.9 | |
| N.W.T. | 0.6 | 0.3 | -0.6 | 0.3 | |
| Nvt. | 1.7 | 0.0 | -1.1 | 0.6 | |
| Source: Statistics Canada, Centre for Demography. | |||||
Ontario attracts the most immigrants, but also loses the most non-permanent residents
In 2020/2021, 47.7% of all immigrants to Canada settled in Ontario, an increase from the previous year (44.7%) and the highest proportion since 2006/2007. This proportion exceed the demographic weight of the province (38.8%), as it has most year since 1971/1972 (except for the 2013/2014 to 2016/2017 period). The PrairiesNote welcomed 18.3% of immigrants to Canada, a significant decrease from 2019/2020 (22.4%) and the lowest proportion since 2008/2009. All three provinces saw a decrease in the number of immigrants, particularly in the third and fourth quarters of 2020. While British Columbia saw a similar proportion of immigrants as the prior year (15.2% from 15.8% in 2019/2020), Quebec saw an increase to 14.9%, up from 11.7% in 2019/2020 and similar to pre-pandemic levels (14.3% in 2018/2019). Canada’s new 2021 immigration plan is in part responsible for the increase in the number of immigrants seen in the first half of 2021.
Start of text boxThe estimated number of immigrants by province and territory is based on their intended province or territory of residence, as collected by Immigration, Refugees and Citizenship Canada (IRCC). This also applies to the calculation of international migratory growth and provincial and territorial population growth.
End of text box
Most provinces and territories saw considerable losses of non-permanent residents, except for Prince Edward Island (+914), New Brunswick (+1,395), Manitoba (+252) and Yukon (+126) which saw gains greater than in 2019/2020. Ontario experienced the highest losses (-18,168), followed by Quebec (-14,917), British Colombia (-7,031) and Alberta (-4,180). These represented the highest losses in almost three decades for Ontario and Quebec, and the highest on record for British Columbia (since 1971/1972).

Data table for Chart 1.6
| Year ending June 30 | Atlantic provinces | Quebec | Ontario | Manitoba | Saskatchewan | Alberta | British Columbia | Territories |
|---|---|---|---|---|---|---|---|---|
| percent | ||||||||
| 2001 | 1.3 | 14.5 | 59.4 | 1.9 | 0.7 | 6.4 | 15.7 | 0.1 |
| 2006 | 1.7 | 16.5 | 52.3 | 3.5 | 0.8 | 7.8 | 17.2 | 0.1 |
| 2011 | 2.9 | 20.6 | 40.5 | 6.1 | 2.9 | 11.8 | 15.0 | 0.1 |
| 2016 | 4.1 | 17.1 | 37.2 | 5.4 | 4.7 | 17.9 | 13.4 | 0.2 |
| 2021 | 3.7 | 14.9 | 47.7 | 4.5 | 3.2 | 10.6 | 15.2 | 0.2 |
| Source: Statistics Canada, Centre for Demography. | ||||||||
Strong gains in interprovincial migration for the Atlantic Provinces and British Columbia
At the provincial and territorial level, population growth is the result of not only natural increase and international migration, but also migratory exchanges between provinces and territories. In 2020/2021, interprovincial migration trends from recent years appear to have accelerated in most regions. The Atlantic provinces saw a substantial increase in the net migratory exchanges with other provinces and territories driven by both lower number of people leaving, as well as more people moving to these provinces. Specifically, Nova Scotia recorded a net gain of 9,949 people from interprovincial migration in 2020/2021, the highest since at least 1971/1972. The previous record was established just a year prior in 2019/2020 with gains of 5,567 following an upward trend that started in 2013/2014. Similarly, New Brunswick gained 3,887 people from other provinces, the most in over four decades. For both provinces, the gains mainly came from exchanges with Ontario and Alberta.
On the other coast, British Columbia also saw a decrease in out-migrants and an increase in in-migrants. For the 2020/2021 period the province gained 34,277 people from migratory exchanges with the rest of Canada, the highest number since 1993/1994 (37,871). Most of the gains seen in British Columbia came from exchanges with Alberta and Ontario. Conversely, Ontario experienced the highest net losses to interprovincial migration in 2020/2021 (-17,085) since 2006/2007 (-20,047) while significant losses were also observed in Alberta (-11,831), Manitoba (-9,685) and Saskatchewan (-9,410). While Alberta regularly sees large year-over-year variations and figures for Manitoba and Saskatchewan are in line with recent trends, the annual change in net interprovincial migration observed in Ontario between 2019/2020 and 2020/2021 (-19,879) was the most drastic since the change from 1987/1988 to 1988/1989 (-25,476).
As with other components of migration, the period of July to December 2020 tells a different story than that of January to June 2021. Across the country, the third and fourth quarter of 2020 saw less interprovincial movement with a decrease in both in-migrants and out-migrants leading to decreased gains and losses from what had been observed in the second quarter of 2020 when the pandemic began. On the other hand, the first and second quarter of 2021 saw increased interprovincial movement leading Ontario, Manitoba and Saskatchewan to see net losses in the second quarter of 2021 that had not been seen in any quarter for decades. Simultaneously, the Atlantic Provinces, Quebec and British Columbia recorded quarterly gains also not seen in decades.
Population and economic growth are often interrelated. For example, Canada’s interprovincial migration flows can be either a source or a result of economic conditions, which can affect both employment and unemployment. Notably, Alberta experienced unemployment rates at 7.0% or higher between November 2015 and December 2017, mostly the result of a drop in oil prices which began in the fall of 2014. At the same time, the province registered net interprovincial migration losses over 15,000 during both annual periods 2015/2016 and 2016/2017. Conditions were much improved in Alberta in 2018, as employment rose and the unemployment rate dropped. It follows that, while Alberta still lost population to interprovincial migration in 2017/2018 and 2018/2019, losses had dropped to -3,247 in 2017/2018 and -2,032 in 2018/2019. As the pandemic hit, Alberta saw increased unemployment rates reaching 15.9% in May 2020 and net losses starting in the second quarter of 2020 (-4,051). With unemployment rate remaining above pre-pandemic levels in Alberta for the entire 2020/2021 period, the province saw net losses of 11,831 people to other provinces that year.
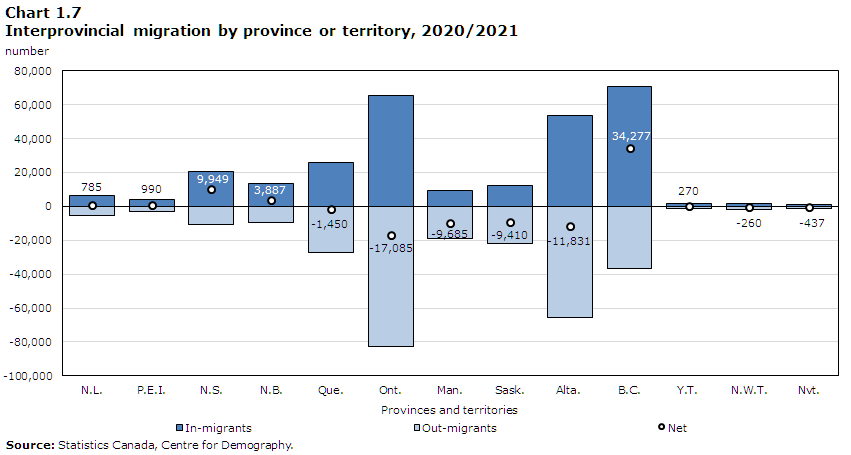
Data table for Chart 1.7
| Provinces and territories | In-migrants | Out-migrants | Net |
|---|---|---|---|
| number | |||
| N.L. | 6,169 | -5,384 | 785 |
| P.E.I. | 4,186 | -3,196 | 990 |
| N.S. | 20,484 | -10,535 | 9,949 |
| N.B. | 13,481 | -9,594 | 3,887 |
| Que. | 25,783 | -27,233 | -1,450 |
| Ont. | 65,497 | -82,582 | -17,085 |
| Man. | 9,580 | -19,265 | -9,685 |
| Sask. | 12,575 | -21,985 | -9,410 |
| Alta. | 53,509 | -65,340 | -11,831 |
| B.C. | 70,856 | -36,579 | 34,277 |
| Y.T. | 1,403 | -1,133 | 270 |
| N.W.T. | 1,644 | -1,904 | -260 |
| Nvt. | 1,003 | -1,440 | -437 |
| Source: Statistics Canada, Centre for Demography. | |||
The largest migration flows involved exchanges between Ontario, Alberta, British Columbia and Quebec
The 30 largest migration flows are shown in Chart 1.8, in which each province or territory is assigned a colour. Migration origins and destinations are represented by the circle’s segments. Flows are the same colour as their origin, the width indicates their size and the arrow their direction.

Data table for Chart 1.8
Origins and destinations are represented by the circle’s segments. Each province or territory is assigned a colour. Flows have the same colour as their origin, the width indicates their size and the arrow their direction. Indicates the absolute number (thousands) of interprovincial in-migrants and out-migrants. The 30 most important flows are shown.
| Origin | Destination | ||||||||||||
|---|---|---|---|---|---|---|---|---|---|---|---|---|---|
| N.L. | P.E.I. | N.S. | N.B. | Que. | Ont. | Man. | Sask. | Alta. | B.C. | Y.T. | N.W.T. | Nvt. | |
| N.L. | Note ...: not applicable | 64 | 853 | 348 | 263 | 1,549 | 81 | 86 | 1,439 | 590 | 4 | 59 | 48 |
| P.E.I. | 89 | Note ...: not applicable | 484 | 533 | 120 | 1,240 | 80 | 6 | 273 | 283 | 61 | 0 | 27 |
| N.S. | 572 | 478 | Note ...: not applicable | 1,615 | 656 | 3,616 | 239 | 282 | 1,540 | 1,338 | 72 | 90 | 37 |
| N.B. | 278 | 284 | 1,979 | Note ...: not applicable | 1,917 | 2,724 | 125 | 108 | 1,366 | 754 | 9 | 29 | 21 |
| Que. | 273 | 194 | 856 | 1,538 | Note ...: not applicable | 16,370 | 528 | 328 | 2,433 | 4,485 | 61 | 44 | 123 |
| Ont. | 2,549 | 2,348 | 9,970 | 6,112 | 16,469 | Note ...: not applicable | 3,262 | 3,040 | 16,849 | 20,728 | 347 | 471 | 437 |
| Man. | 36 | 51 | 479 | 335 | 858 | 5,559 | Note ...: not applicable | 1,541 | 5,051 | 5,208 | 32 | 59 | 56 |
| Sask. | 161 | 63 | 394 | 185 | 456 | 5,659 | 1,310 | Note ...: not applicable | 8,235 | 5,395 | 65 | 26 | 36 |
| Alta. | 1,550 | 469 | 3,139 | 1,890 | 2,733 | 16,315 | 2,148 | 4,946 | Note ...: not applicable | 31,232 | 276 | 480 | 162 |
| B.C. | 477 | 204 | 1,982 | 762 | 2,110 | 11,497 | 1,585 | 2,063 | 15,376 | Note ...: not applicable | 283 | 198 | 42 |
| Y.T. | 0 | 3 | 36 | 11 | 15 | 248 | 50 | 66 | 164 | 493 | Note ...: not applicable | 44 | 3 |
| N.W.T. | 78 | 10 | 155 | 107 | 97 | 258 | 35 | 78 | 631 | 286 | 158 | Note ...: not applicable | 11 |
| Nvt. | 106 | 18 | 157 | 45 | 89 | 462 | 137 | 31 | 152 | 64 | 35 | 144 | Note ...: not applicable |
|
... not applicable Source: Statistics Canada, Centre for Demography. |
|||||||||||||
Over the past year, the largest interprovincial migration flow was from Alberta to British Columbia (31,232). The second largest interprovincial migration flow in Canada was from Ontario to British Columbia (20,728). On the opposite side, 15,376 people moved from British Columbia to Alberta, and 11,497 did the same to Ontario. Combined, British Columbia showed a net gain of 9,231 people from its exchanges with Ontario and gains of 15,856 from Alberta. These figures represent substantial increases from a year prior where British Columbia gained 4,602 and 7,257 people from Ontario and Alberta, respectively.
Alberta’s net losses from interprovincial migration (-11,831) resulted in part from an increase in the number of people moving from Alberta to British Columbia (31,232 in 2020/2021 compared to 24,862 in 2019/2020). Compared to 2019/2020, more people moved from Ontario to every other province in 2020/2021 (except Manitoba) while fewer people moved to Ontario from every province (except for Saskatchewan and Alberta). Together, these changes led to Ontario losing 17,085 people to other provinces and territories in 2020/2021 where it had gained 2,794 in 2019/2020.
In relative terms (expressed as ratesNote ), the largest interprovincial migration flows among the provinces and territories were from the Northwest Territories to Alberta (1.4%), Nunavut to Ontario (1.2%), Yukon to British Columbia (1.2%), Prince Edward Island to Ontario (0.8%) and Alberta to British Columbia (0.7%).
Notes
- Date modified: