Common menu bar links
2007, Revised
Archived Content
Information identified as archived is provided for reference, research or recordkeeping purposes. It is not subject to the Government of Canada Web Standards and has not been altered or updated since it was archived. Please "contact us" to request a format other than those available.
Analysis
During the period from July 1, 2006 to June 30, 2007, Canada’s population increased by 326,500 persons. By July 1, 2007, the Canadian population had reached 32,976,000.
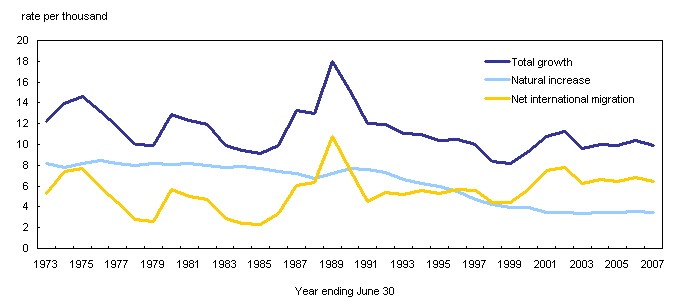
With a demographic growth rate of 10.0 per 1,000 in 2006/2007, Canada’s population grew slightly more slowly than in the previous year (10.4 per 1,000). This decrease was mainly due to declining immigration.
During this period, Canada welcomed 238,100 immigrants, 16,200 fewer than the previous year. This level of immigration was nevertheless higher than the average for the previous five years (235,100).
Despite this decrease in immigration, net international migration remained the main factor in Canada’s demographic growth. In 2006/2007, it accounted for about two thirds of the growth in Canada’s population.
Places of residence chosen by arriving immigrants are becoming more diverse. For the first time since 1985/1986, Ontario welcomed fewer than half of newcomers (48.5%). By comparison, this province welcomed 59.6% of immigrants in 2001/2002. Ontario’s proportion has been constantly declining since this peak.
For the sixth consecutive year, the number of births in Canada increased. In 2006/2007, there were 352,800 births, the highest number since 1996/1997 (357,300). The greatest increase in the number of births took place in Quebec and Alberta. There had not been that many births in Alberta since 1983/1984.
However, Canada’s natural increase remains stable. The increase in the number of deaths, which is normal in an aging population, offsets the increase in the number of births.

The number of non-permanent residents is on the rise for a 9th consecutive year. Last year, this number increased by 17,900 to reach 439,100, a level not registered since 1990 (447,900).
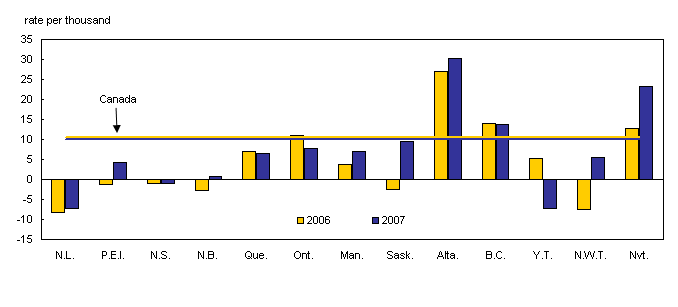
Alberta’s population continues to grow rapidly. In 2006/2007, the province witnessed an increase in its population of 103,400 people, setting another record. With a rate of 30.2 per 1,000, Alberta’s population is increasing more than three times faster than Canada’s. Alberta’s population increased more quickly than in the previous year (27.0 per 1,000) and the province experienced its strongest growth since 1981/1982 (31.8 per 1,000).
When compared to the American states, Alberta ranked third in population growth in 2005/2006 (the last year for which American data are available), behind Arizona (35.2 per 1,000), Nevada (33.9 per 1,000) and ahead of Idaho (25.6 per 1,000) and Georgia (25.0 per 1,000). A population that grows at a rate of 30 per 1,000 doubles in slightly over 23 years.
Interprovincial migration remains an important factor of the Alberta’s growth, as it accounted for half the province’s population increase. During the year ending June 30, 2007, Alberta gained 51,200 persons in population exchanges with other Canadian jurisdictions, 5,400 more than the previous year.
It is interesting to note that the distribution of the jurisdiction of origin of people moving to Alberta changed in the last few years. Before the beginning of its “demographic boom” (3rd quarter of 2004), most of the persons coming to Alberta were from its neighbouring provinces, Saskatchewan and British Columbia. In the first months of the “boom”, the importance of these two provinces, somewhat still important, diminished for the benefit notably of the Atlantic provinces. As for Quebec and Ontario, we have to wait up until 2006/2007 to witness a significant increase of their importance.
| Atlantic region | Quebec | Ontario | Manitoba | Saskatchewan | British Columbia | Territories | |
|---|---|---|---|---|---|---|---|
| percent | |||||||
| 2003/2004 | 13.1 | 3.7 | 20.6 | 7.8 | 17.7 | 34.7 | 2.5 |
| 2004/2005 | 15.0 | 4.1 | 22.4 | 8.4 | 17.6 | 30.1 | 2.4 |
| 2005/2006 | 17.7 | 5.8 | 25.7 | 7.8 | 14.4 | 26.5 | 2.1 |
| 2006/2007 | 16.4 | 8.3 | 34.3 | 7.1 | 9.8 | 22.2 | 1.8 |
In fact, migrants from Saskatchewan and British Columbia, which accounted for 52.4% of all Alberta in-migrants in 2003/2004, only represented 32.0% of them in 2006/2007. Conversely, people from Quebec and Ontario accounted for 42.6% of the total number of persons who settled in Alberta in 2006/2007 while they only represented 24.3% of them three years before.
It seems that people from Quebec and Ontario reacted more belatedly to the Alberta’s attraction than the rest of the country. While the proportion of out-migrants choosing Alberta increased very little, or even decreased, for most of the jurisdictions in 2006/2007, it continued to grow strongly for the two provinces.
| Atlantic region | Quebec | Ontario | Manitoba | Saskatchewan | British Columbia | Territories | |
|---|---|---|---|---|---|---|---|
| percent | |||||||
| 2003/2004 | 19.8 | 9.2 | 19.5 | 29.9 | 56.3 | 49.6 | 31.2 |
| 2004/2005 | 27.2 | 12.3 | 26.1 | 35.7 | 63.1 | 53.9 | 36.8 |
| 2005/2006 | 34.2 | 18.2 | 32.2 | 37.1 | 63.6 | 55.0 | 36.2 |
| 2006/2007 | 37.5 | 26.2 | 41.9 | 40.3 | 59.1 | 51.5 | 37.6 |
To this phenomenon, one has to add the effect of the increase of the number of people leaving Alberta and which can often be linked to returns to the jurisdictions of origin. These returns are of course more frequent for jurisdictions for which departures to Alberta had been more numerous in the past.
Therefore, it is not surprising to see that, for most of the country’s jurisdictions, demographic losses through exchanges with Alberta in 2006/2007 lessened or were even transformed into gains when compared to previous years. This was especially true of Saskatchewan and British Columbia, which received more people from Alberta than they lost in the last year. Only Quebec and Ontario escaped this trend. In the case of these provinces, net losses to Alberta continued to increase in 2006/2007.
| Atlantic region | Quebec | Ontario | Manitoba | Saskatchewan | British Columbia | Territories | |
|---|---|---|---|---|---|---|---|
| number | |||||||
| 2003/2004 | -2,760 | -566 | -2,605 | -1,553 | -3,465 | 686 | -343 |
| 2004/2005 | -7,606 | -1,783 | -9,026 | -4,234 | -8,150 | -2,670 | -954 |
| 2005/2006 | -11,339 | -3,967 | -14,946 | -4,551 | -6,752 | -3,241 | -999 |
| 2006/2007 | -11,308 | -8,034 | -30,640 | -3,900 | 1,410 | 1,976 | -673 |
Canadian demographics: a different profile
Increased immigration to several provinces and changes in the jurisdictions of origin and destination of people moving to or from Alberta had an impact on Canada’s demographic profile in 2006/2007.
Thus, most of the Canadian jurisdictions posted a better demographic balance sheet in 2006/2007. Ontario, Quebec and the Yukon were the only exceptions. Three jurisdictions (Newfoundland and Labrador, Nova Scotia and the Yukon Territory) recorded population losses. British Columbia (13.8 per 1,000) and Nunavut (23.2 per 1,000) were the only jurisdictions, apart from Alberta, to experience faster population growth than the national average.

Whereas in 2005/2006, the Atlantic provinces all lost population, Prince Edward Island and New Brunswick experienced population increases again this year. This can mainly be explained by two factors: lower interprovincial migration losses and a larger number of immigrants.
Newfoundland and Labrador and Nova Scotia again lost part of their population, but these losses proved lower than the previous year. It should be noted that Nova Scotia was the second province, after Newfoundland and Labrador, to record more deaths than births in the same year.
Quebec’s population grew in the year 2006/2007, but more slowly than the previous year, despite an increased number of births and immigrants. The number of births passed the 80,000 mark for the first time since 1996/1997 (82,900). The province also welcomed 45,100 immigrants, the largest number since 1992/1993 (48,400). On the other hand, Quebec lost 15,600 people to other Canadian jurisdictions, its greatest loss since 1997/1998 (17,400).
With a growth of 7.7 per 1,000, Ontario’s population grew much more slowly than the previous year (11.1 per 1,000) and it was at its lowest level since 1980/1981 (7.5 per 1,000). This slower growth in Ontario is mainly due to decreased immigration and increased interprovincial migration losses. In 2006/2007, the province posted a net lost of 36,200 persons to other Canadian jurisdictions and received 17,600 fewer immigrants than the previous year.
Manitoba’s population increased at a rate of 6.9 per 1,000, a pace that had only been exceeded once (7.4 per 1,000 in 2003/2004) in the previous twenty years. This was due to lower interprovincial migration losses and also increased immigration. In 2006/2007, the province received 10,800 immigrants, thus beating its record for the previous year (8,900). For the first time, Manitoba posted the strongest immigration rate in Canada. It was the first time that a province other than Ontario, British Columbia or Alberta had achieved this feat on an annual basis.
After losing population for two consecutive years, Saskatchewan experienced a year of strong growth, mainly due to net interprovincial migration (+ 4,000) that was positive for the first time since 1983/1984 and at its highest level since 1975/1976 (+ 5,300). With a rate of 9.4 per 1,000, the province posted its strongest growth rate since 1984/1985 (9.8 per 1,000) and it ranked third nationwide, behind Alberta and British Columbia.
In 2006/2007, British Columbia’s population grew at a rate (13.8 per 1,000) similar to the previous year. Since 2002/2003, the province has consistently grown faster than the national average. British Columbia posted its strongest net interprovincial migration (+ 10,600) since 1995/1996 (+ 22,000). These gains offset the decrease in the number of immigrants which dropped by 6,000 compared to 2005/2006 and reached 37,800.
In Canada’s northern regions, the populations of Nunavut and the Northwest Territories increased, whereas the Yukon Territory recorded losses. Thanks to its high birth rate and the highest gains in interprovincial migration in its history, Nunavut’s population is continuing to grow rapidly. With its demographic growth rate of 23.2 per 1,000, it is increasing more than twice as fast as the national level.
After two consecutive years of losses, population growth in the Northwest Territories resumed in 2006/2007, mainly thanks to lower population exchange losses with other Canadian jurisdictions.
For the first time since 2000/2001, the Yukon Territory’s population decreased. The increase in its interprovincial migration losses, especially to Alberta and British Columbia, accounted for most of these losses.


