
Report on the Demographic Situation in Canada
Internal migration: Overview, 2016/2017 to 2018/2019
by Karl Chastko
Skip to text
Text begins
Start of text boxHighlights
- From 2016/2017 to 2018/2019, British Columbia and Ontario were the principal beneficiaries of net interprovincial migration among the provinces in Canada.
- Each of the Atlantic provinces experienced gains through interprovincial migration, with the exception of Newfoundland and Labrador.
- Two of the three territories posted losses through interprovincial migration, the Yukon being the lone exception.
- Saskatchewan and Manitoba had the largest net interprovincial migratory losses in absolute terms in 2018/2019. The corresponding rates ranked the second and third lowest in Canada respectively, after the Northwest Territories.
- The largest migratory flows in Canada were the two flows between Alberta and British Columbia followed by the flow from Quebec to Ontario.
- The majority of Canada’s census divisions (CD) recorded losses of people 18 to 24 years old to more urban CDs .
- Canadians 25 to 44 years old are primarily leaving urban CDs for neighboring suburban and exurban CDs.
Key statistics
Number of interprovincial migrants in Canada:
- 2016/2017: 260,393 migrants
- 2017/2018: 260,751 migrants
- 2018/2019: 254,143 migrants
Interprovincial migration rates in Canada:
- 2016/2017: 7.2 per thousand
- 2017/2018: 7.1 per thousand
- 2018/2019: 6.8 per thousand
Provinces or territories with the highest net interprovincial migration rates (2018/2019):
- Yukon (+8.3 per thousand)
- Prince Edward Island (+4.3 per thousand)
- Nova Scotia (+3.8 per thousand)
Provinces or territories with the lowest net interprovincial migration rates (2018/2019):
- Northwest Territories (-10.4 per thousand)
- Saskatchewan (-8.1 per thousand)
- Manitoba (-5.4 per thousand)
Introduction
This article presents the most recent internal migration trends in Canada for 2016/2017, 2017/2018 and 2018/2019 (July 1 to June 30). Internal migration represents all movements of people within Canada’s geographical boundaries, involving a change in usual place of residence. It denotes movements of people from one province or territory to another (interprovincial migration) or from one region to another within the same province or territory (intraprovincial migration).
The analysis will cover a variety of migration indicators for the 2016/2017, 2017/2018 and 2018/2019 annual periods, divided into five sections: interprovincial migration, net interprovincial migration, interprovincial flows of in-migrants and out-migrants, age structures of interprovincial migrants, and internal migration between census divisions, for the 18 to 24 and 25 to 44 age groups. A short section also gives an overview of preliminary data for 2019/2020.
Start of text boxThe interprovincial migration estimates used for this article are from Statistics Canada’s Demographic Estimates Program (DEP). Since no mechanism exists to record interprovincial migratory movement in Canada, Statistics Canada produces these estimates using a model based on the T1 Family file (T1FF), an administrative data file composed of the individual T1 and T4 tax files, and the Canada child benefit file (CCB) received from the Canada Revenue Agency. These data are used to estimate migrants by comparing the addresses over two consecutive tax years. Additional information on the methodology is available in the publication Population and Family Estimation Methods at Statistics Canada, Statistics Canada Catalogue no. 91-528-X.
Interprovincial migration
Interprovincial migration represents the movement of people from one province or territory to another. In 2018/2019, the number of interprovincial migrants in Canada was 254,143, this was a decrease from 260,751 in 2017/2018. The national interprovincial migration rate declined slightly from 7.1 per thousand in 2017/2018 to 6.8 per thousand in 2018/2019 (Chart 1).

Data table for Chart 1
| Period | Number | Rate (per 1,000 population) |
|---|---|---|
| 1971/1972 | 395,432 | 17.9 |
| 1972/1973 | 396,138 | 17.7 |
| 1973/1974 | 437,549 | 19.3 |
| 1974/1975 | 411,709 | 17.9 |
| 1975/1976 | 375,351 | 16.1 |
| 1976/1977 | 357,389 | 15.2 |
| 1977/1978 | 364,421 | 15.3 |
| 1978/1979 | 358,805 | 14.9 |
| 1979/1980 | 371,388 | 15.2 |
| 1980/1981 | 382,932 | 15.5 |
| 1981/1982 | 357,919 | 14.3 |
| 1982/1983 | 305,486 | 12.1 |
| 1983/1984 | 279,372 | 11.0 |
| 1984/1985 | 270,565 | 10.5 |
| 1985/1986 | 287,260 | 11.1 |
| 1986/1987 | 302,602 | 11.5 |
| 1987/1988 | 322,375 | 12.1 |
| 1988/1989 | 327,700 | 12.1 |
| 1989/1990 | 356,807 | 13.0 |
| 1990/1991 | 316,567 | 11.4 |
| 1991/1992 | 316,659 | 11.2 |
| 1992/1993 | 303,294 | 10.6 |
| 1993/1994 | 289,391 | 10.0 |
| 1994/1995 | 285,464 | 9.8 |
| 1995/1996 | 291,764 | 9.9 |
| 1996/1997 | 292,873 | 9.8 |
| 1997/1998 | 309,234 | 10.3 |
| 1998/1999 | 276,930 | 9.1 |
| 1999/2000 | 285,817 | 9.4 |
| 2000/2001 | 269,220 | 8.7 |
| 2001/2002 | 290,490 | 9.3 |
| 2002/2003 | 274,899 | 8.7 |
| 2003/2004 | 261,380 | 8.2 |
| 2004/2005 | 285,544 | 8.9 |
| 2005/2006 | 285,868 | 8.8 |
| 2006/2007 | 305,062 | 9.3 |
| 2007/2008 | 301,237 | 9.1 |
| 2008/2009 | 277,846 | 8.3 |
| 2009/2010 | 259,234 | 7.7 |
| 2010/2011 | 257,085 | 7.5 |
| 2011/2012 | 280,347 | 8.1 |
| 2012/2013 | 261,295 | 7.5 |
| 2013/2014 | 275,059 | 7.8 |
| 2014/2015 | 283,809 | 8.0 |
| 2015/2016 | 277,029 | 7.7 |
| 2016/2017 | 260,393 | 7.2 |
| 2017/2018 | 260,751 | 7.1 |
| 2018/2019 | 254,143 | 6.8 |
| Source: Statistics Canada, Centre for Demography, Demographic Estimates Program. | ||
The number of annual interprovincial migrants has remained relatively stable since 1999/2000, ranging from 254,000 to 305,000. While Canada’s population increased between 1999 and 2019 significantly (+7.2 million), the rate of interprovincial migration declined during this period from 9.4 per thousand in 1999/2000 to 6.8 per thousand in 2018/2019. This indicates that in recent years interprovincial migration growth was proportionally lower than Canada’s population growth.
Net interprovincial migration
Net interprovincial migration represents the difference between in-migrants and out-migrants for a given province or territory. Net interprovincial migration is represented as a number or a rate, and can be positive or negative indicating gains and losses respectively. In 2018/2019, net interprovincial migration was negative for five provinces and two territories but it was positive in five provinces and one terrirory (Table 1 and Chart 2).
| Period | Newfoundland and Labrador | Prince Edward Island | Nova Scotia | New Brunswick | Quebec | Ontario | Manitoba | Saskatchewan | Alberta | British Columbia | Yukon | Northwest Territories | Nunavut | Total number of migrants |
|---|---|---|---|---|---|---|---|---|---|---|---|---|---|---|
| number | ||||||||||||||
| 2008/2009 | 1,877 | -536 | -751 | -237 | -7,419 | -15,601 | -3,111 | 2,983 | 13,184 | 9,995 | 228 | -577 | -35 | 277,846 |
| 2009/2010 | 1,558 | 60 | 612 | 571 | -3,258 | -4,662 | -2,412 | 2,153 | -3,271 | 8,728 | 325 | -351 | -53 | 259,234 |
| 2010/2011 | 30 | -210 | -41 | -158 | -4,763 | -4,007 | -3,517 | 545 | 8,443 | 3,421 | 363 | -179 | 73 | 257,085 |
| 2011/2012 | 545 | -618 | -2,866 | -1,806 | -6,915 | -10,611 | -4,212 | 1,878 | 27,652 | -2,711 | 313 | -496 | -153 | 280,347 |
| 2012/2013 | 495 | -901 | -3,517 | -3,290 | -10,431 | -13,901 | -5,006 | 392 | 38,598 | -1,868 | -94 | -482 | 5 | 261,295 |
| 2013/2014 | 234 | -941 | -2,571 | -3,517 | -14,312 | -14,564 | -6,851 | -1,839 | 35,382 | 9,475 | 51 | -488 | -59 | 275,059 |
| 2014/2015 | 161 | -682 | -2,311 | -2,790 | -16,142 | -8,695 | -6,678 | -4,528 | 21,594 | 20,379 | 87 | -223 | -172 | 283,809 |
| 2015/2016 | 232 | 30 | 754 | -1,113 | -11,118 | 9,077 | -4,881 | -4,272 | -15,108 | 26,573 | 276 | -250 | -200 | 277,029 |
| 2016/2017 | -1,430 | 444 | 2,839 | 434 | -8,127 | 13,382 | -5,124 | -5,760 | -15,559 | 18,834 | 577 | -375 | -135 | 260,393 |
| 2017/2018 | -2,733 | 177 | 3,048 | 481 | -5,693 | 9,944 | -7,148 | -8,475 | -3,247 | 13,989 | 234 | -429 | -148 | 260,751 |
| 2018/2019 | -2,597 | 662 | 3,632 | 1,669 | -4,128 | 6,629 | -7,351 | -9,441 | -2,032 | 13,325 | 342 | -469 | -241 | 254,143 |
| Net since 2008/2009 | -1,628 | -2,515 | -1,172 | -9,756 | -92,306 | -33,009 | -56,291 | -26,364 | 105,636 | 120,140 | 2,702 | -4,319 | -1,118 | 2,946,991 |
| Source: Statistics Canada, Centre for Demography, Demographic Estimates Program, table 17-10-0015-01. | ||||||||||||||

Data table for Chart 2
| Period | Newfoundland and Labrador | Prince Edward Island | Nova Scotia | New Brunswick | Quebec | Ontario | Manitoba | Saskatchewan | Alberta | British Columbia | Yukon | Northwest Territories | Nunavut |
|---|---|---|---|---|---|---|---|---|---|---|---|---|---|
| per 1,000 population | |||||||||||||
| 2016/2017 | -2.7 | 3.0 | 3.0 | 0.6 | -1.0 | 1.0 | -3.8 | -5.0 | -3.7 | 3.8 | 14.8 | -8.4 | -3.6 |
| 2017/2018 | -5.2 | 1.2 | 3.2 | 0.6 | -0.7 | 0.7 | -5.3 | -7.3 | -0.8 | 2.8 | 5.8 | -9.5 | -3.9 |
| 2018/2019 | -5.0 | 4.3 | 3.8 | 2.2 | -0.5 | 0.5 | -5.4 | -8.1 | -0.5 | 2.6 | 8.3 | -10.4 | -6.3 |
|
Note: The net rate of a province corresponds to its net interprovincial migration divided by its average population during the reference period. Source: Statistics Canada, Centre for Demography, Demographic Estimates Program. |
|||||||||||||
Of the five provinces and two territories which experienced negative net interprovincial migration in 2018/2019, the majority of these net losses occured in the Prairie provinces. Saskatchewan (-9,441) experienced the greatest loss of all provinces followed by Manitoba (-7,351). These losses coincided with low rates of net interprovincial migration. Saskatchewan posted a negative net interprovincal migration rate of -8.1 per thousand which was the lowest rate observed in the province since 2004/2005. Manitoba posted a negative net migration rate of -5.4 per thousand which was consistent with the negative net interprovincial migration rates posted there since 1984/1985.
Alberta experienced a smaller loss (-2,032) than its Prairie counterparts, and it was also considerably smaller than 2016/2017 in which Alberta experienced a net loss of 15,559 residents. Although a negative interprovincial migration rate was observed in Alberta in 2018/2019 (-0.5 per thousand), this was the highest rate since the decline of oil prices which affected Alberta’s labour market beginning at the end of 2014 (Bourbeau and Fields 2017).
Quebec, Newfoundland and Labrador, Nunavut and the Northwest Territories also experienced negative interprovincial migration. Although interprovincial migratory losses in Quebec were third largest over all (-4,128), this loss corresponded with an interprovincial migration rate of only -0.5 per thousand due to the large population of Quebec. Given the small population of the Northwest Territories, the relatively small interprovincial migration loss (-469), corresponded to an interprovincial migration rate of -10.4 per thousand, which was the highest rate of interprovincial migration loss in the country. Nunavut, like the Northwest Territories, also experienced negative interprovincial migration although the number and rate of loss was not as large as the Northwest Territories and was consistent with previous years (Table 1). Newfoundland and Labrador has experienced negative interprovincial migration for the last three years. The net rates recorded in 2017/2018 and 2018/2019 (-5.2 and -5.0 per thousand respectively) were the lowest since 2006/2007.
Provinces and territories which experienced positive interprovincial migration in 2018/2019 were Prince Edward Island, Nova Scotia, New Brunswick, Ontario, British Columbia and Yukon. British Columbia and Ontario posted the largest number of net interprovincial migrants, their combined total representing 76% of all migratory net gains. Although these provinces received a large number of interprovincial migrants, these gains represented relatively low migration rates due to the large population size of these provinces. For example, despite having the second largest number of net migrants (+6,629), Ontario had the second lowest positive net rate. The Yukon experienced the largest migration rate (+8.3 per thousand) in all of Canada however, this rate is significantly lower than 2016/2017 in which the Yukon had an interprovincial migration rate of 14.8 per thousand.
Interprovincial migration flows
Interprovincial migratory flows refer to the movement of individuals from one province or territory to another. The largest migratory flows (the largest 20%) are shown in the circular chart (Chart 3), in which a different colour is assigned to each province and territory. Origins and destinations are represented by the circle’s segments. Flows have the same colour as their origin, the width indicates their size and the arrow their direction.

Data table for Chart 3
| Origin | Destination | ||||||||||||
|---|---|---|---|---|---|---|---|---|---|---|---|---|---|
| Newfoundland and Labrador | Prince Edward Island | Nova Scotia | New Brunswick | Quebec | Ontario | Manitoba | Saskatchewan | Alberta | British Columbia | Yukon | Northwest Territories | Nunavut | |
| number | |||||||||||||
| Newfoundland and Labrador | Note ...: not applicable | 150 | 1,131 | 457 | 223 | 2,200 | 137 | 111 | 2,341 | 608 | 18 | 69 | 66 |
| Prince Edward Island | 66 | Note ...: not applicable | 503 | 336 | 138 | 1,174 | 32 | 17 | 332 | 287 | 6 | 6 | 3 |
| Nova Scotia | 547 | 436 | Note ...: not applicable | 1,640 | 756 | 4,666 | 224 | 178 | 2,210 | 1,241 | 41 | 108 | 78 |
| New Brunswick | 263 | 253 | 1,957 | Note ...: not applicable | 1,388 | 2,921 | 158 | 125 | 1,398 | 609 | 21 | 36 | 23 |
| Quebec | 143 | 120 | 754 | 1,353 | Note ...: not applicable | 16,729 | 391 | 230 | 2,341 | 3,260 | 94 | 99 | 79 |
| Ontario | 1,918 | 1,691 | 6,061 | 3,912 | 12,423 | Note ...: not applicable | 3,055 | 1,984 | 12,903 | 15,583 | 274 | 309 | 238 |
| Manitoba | 115 | 56 | 400 | 208 | 610 | 5,795 | Note ...: not applicable | 1,407 | 4,199 | 3,798 | 60 | 68 | 62 |
| Saskatchewan | 83 | 49 | 304 | 209 | 426 | 4,815 | 1,409 | Note ...: not applicable | 8,941 | 4,139 | 40 | 95 | 31 |
| Alberta | 1,374 | 485 | 2,566 | 1,693 | 2,636 | 15,012 | 2,204 | 4,976 | Note ...: not applicable | 22,964 | 350 | 474 | 94 |
| British Columbia | 272 | 284 | 1,808 | 902 | 2,628 | 12,798 | 1,708 | 1,932 | 17,037 | Note ...: not applicable | 468 | 209 | 63 |
| Yukon | 16 | 9 | 41 | 33 | 52 | 170 | 16 | 32 | 266 | 501 | Note ...: not applicable | 34 | 9 |
| Northwest Territories | 60 | 13 | 117 | 37 | 67 | 346 | 57 | 76 | 743 | 370 | 119 | Note ...: not applicable | 42 |
| Nunavut | 57 | 16 | 115 | 41 | 118 | 354 | 36 | 32 | 85 | 74 | 30 | 71 | Note ...: not applicable |
|
... not applicable Source: Statistics Canada, Centre for Demography, Demographic Estimates Program, table 17-10-0022-01. |
|||||||||||||
In 2018/2019, the two largest interprovincial migratory flows were observed between Alberta and British Columbia. British Columbia received 22,964 migrants from Alberta while 17,037 migrants left British Columbia for Alberta. Increased in-migration from British Columbia paired with decreased losses to Ontario helped raise Alberta’s net interprovincial migration rate to -0.5 per thousand from -3.7 per thousand in 2016/2017.
The next three largest exchanges all involved the largest province in terms of population, Ontario. These flows of migrants were from Quebec to Ontario (16,729), Ontario to British Columbia (15,583) and Alberta to Ontario (15,012).
Chart 4 presents the net interprovincial migration rates of each province by the reference province allowing for the analysis of relationships among provinces while considering the impact of these flows in relation to the size of the province or territory. For example, in 2018/2019, 4,059 residents migrated from Manitoba to Alberta. This migration corresponded with a migration rate of -1.5 per thousand in Manitoba. However, this same migration flow represented a net migration rate of only +0.5 per thousand in Alberta due to differences in the population size of the two provinces.

Data table for Chart 4
| Region of reference | Region of origin or destination | Net rate | |||||||
|---|---|---|---|---|---|---|---|---|---|
| Atlantic provinces | Quebec | Ontario | Manitoba | Saskatchewan | Alberta | British Columbia | Territories | ||
| per 1,000 population | |||||||||
| Newfoundland and Labrador | -1.6 | -0.2 | -0.5 | 0.0 | -0.1 | -1.8 | -0.6 | 0.0 | -5.0 |
| Prince Edward Island | -0.4 | -0.1 | 3.3 | 0.2 | 0.2 | 1.0 | 0.0 | 0.1 | 4.3 |
| Nova Scotia | 1.0 | 0.0 | 1.4 | 0.2 | 0.1 | 0.4 | 0.6 | 0.0 | 3.8 |
| New Brunswick | -0.1 | 0.0 | 1.3 | 0.1 | 0.1 | 0.4 | 0.4 | 0.0 | 2.2 |
| Quebec | 0.0 | 0.0 | -0.5 | 0.0 | 0.0 | 0.0 | -0.1 | 0.0 | -0.5 |
| Ontario | -0.2 | 0.3 | 0.0 | 0.2 | 0.2 | 0.1 | -0.2 | 0.0 | 0.5 |
| Manitoba | -0.2 | -0.2 | -2.0 | 0.0 | 0.0 | -1.5 | -1.5 | -0.1 | -5.4 |
| Saskatchewan | -0.2 | -0.2 | -2.4 | 0.0 | 0.0 | -3.4 | -1.9 | 0.0 | -8.1 |
| Alberta | 0.0 | -0.1 | -0.5 | 0.5 | 0.9 | 0.0 | -1.4 | 0.0 | -0.5 |
| British Columbia | -0.1 | 0.1 | 0.6 | 0.4 | 0.4 | 1.2 | 0.0 | 0.0 | 2.6 |
|
Notes: To have a scale that provides information on interprovincial variations, the territories are not displayed as regions of reference. Also, to facilitate analysis, the four Atlantic provinces were combined as regions of origin or destination, as were the three territories. Source: Statistics Canada, Centre for Demography, Demographic Estimates Program. |
|||||||||
Saskatchewan recorded low net interprovincial migration rates to Alberta and British Columbia as well: -3.4 per thousand to Alberta and -1.9 per thousand to British Columbia. The inflow of these migrants had smaller relative impacts on the net interprovincial migration rates of Alberta and British Columbia, due to the larger populations in these provinces.
On the other hand, Nova Scotia was the only province to experience no significant losses from every region of Canada. Primary contributors to Nova Scotia’s migration rate came from other Atlantic provinces (+1.0 per thousand) and Ontario (+1.4 per thousand).
Interprovincial migration relationships observed in 2018/2019 are consistent with interprovincial migration patterns observed since 2015/2016. These recent interprovincial migration patterns are characterized by large inflows and outflows of migrants between Ontario and Quebec mostly favoring Ontario, migration flows amongst Western provinces primarily benefiting British Columbia and to a lesser extent Alberta. In addition to these trends, the Atlantic provinces, with the exception of Newfoundland and Labrador have experienced positive migration rates in recent years following the decline of Alberta’s petroleum industry in 2014 (Bourbeau et Fields 2017). Prior to 2014, the Atlantic provinces generally experienced interprovincial migratory losses to Alberta.
Age structure of interprovincial migrants
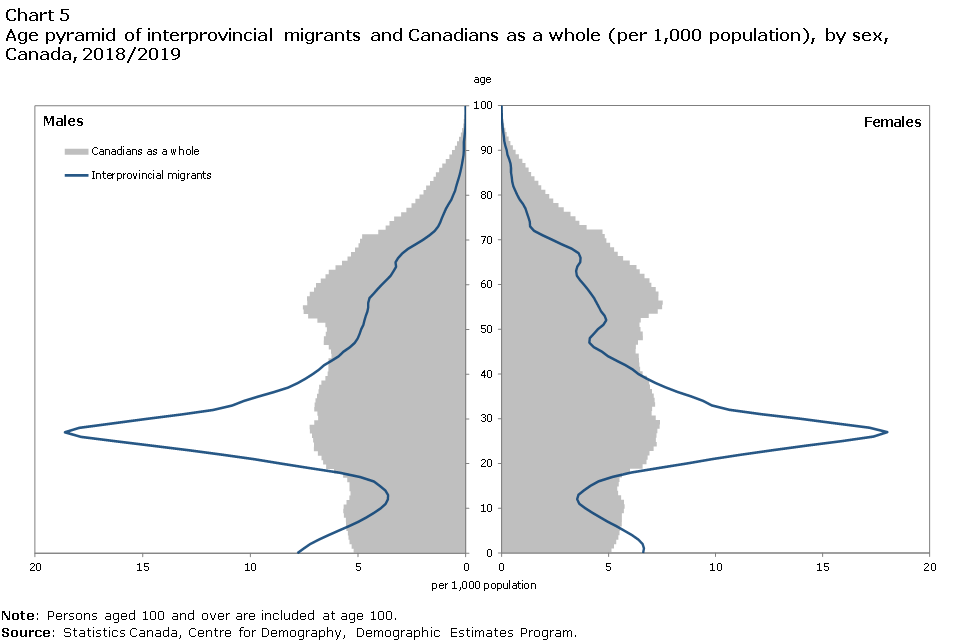
The age structure of interprovincial migrants is distinctly different from the age structure of the total Canadian population. These differences can be clearly seen when comparing the population pyramids of Canadians and interprovincial migrants in Chart 5 where population is displayed in relative values. This Chart indicates that interprovincial migration rates are greatest for adults 19 to 40 years old and children under 5 years of age. These groups comprise smaller proportions of the Canadian population but represent the majority of interprovincial migrants. Other trends present in this data include low rates of migration by teens and a steady decline in interprovincial migration rates past the age of 50.
Data table for Chart 5
| Age | Canadians as a whole | Interprovincial migrants | ||
|---|---|---|---|---|
| Male | Female | Male | Female | |
| per 1,000 population | ||||
| 0 | 5.2 | 5.1 | 7.8 | 6.6 |
| 1 | 5.3 | 5.3 | 7.5 | 6.7 |
| 2 | 5.4 | 5.4 | 7.2 | 6.6 |
| 3 | 5.4 | 5.5 | 6.8 | 6.4 |
| 4 | 5.5 | 5.5 | 6.4 | 6.1 |
| 5 | 5.5 | 5.5 | 5.9 | 5.7 |
| 6 | 5.6 | 5.6 | 5.4 | 5.4 |
| 7 | 5.6 | 5.6 | 5.0 | 5.0 |
| 8 | 5.7 | 5.6 | 4.6 | 4.6 |
| 9 | 5.7 | 5.7 | 4.3 | 4.2 |
| 10 | 5.7 | 5.7 | 4.0 | 3.9 |
| 11 | 5.5 | 5.7 | 3.7 | 3.6 |
| 12 | 5.4 | 5.6 | 3.6 | 3.5 |
| 13 | 5.3 | 5.5 | 3.6 | 3.6 |
| 14 | 5.4 | 5.4 | 3.7 | 3.8 |
| 15 | 5.4 | 5.5 | 4.0 | 4.2 |
| 16 | 5.5 | 5.5 | 4.3 | 4.5 |
| 17 | 5.7 | 5.6 | 4.9 | 5.2 |
| 18 | 6.1 | 6.0 | 5.9 | 6.1 |
| 19 | 6.5 | 6.6 | 7.2 | 7.4 |
| 20 | 6.6 | 6.8 | 8.6 | 8.7 |
| 21 | 6.7 | 6.8 | 9.8 | 9.9 |
| 22 | 6.9 | 6.9 | 11.3 | 11.2 |
| 23 | 7.0 | 7.1 | 12.9 | 12.7 |
| 24 | 7.0 | 7.3 | 14.6 | 14.3 |
| 25 | 7.1 | 7.2 | 16.2 | 15.9 |
| 26 | 7.1 | 7.2 | 17.9 | 17.4 |
| 27 | 7.2 | 7.3 | 18.6 | 18.0 |
| 28 | 7.2 | 7.4 | 18.0 | 17.2 |
| 29 | 7.0 | 7.4 | 16.4 | 15.6 |
| 30 | 6.9 | 7.2 | 14.9 | 13.9 |
| 31 | 6.9 | 7.0 | 13.2 | 12.2 |
| 32 | 7.0 | 7.0 | 11.7 | 10.6 |
| 33 | 7.0 | 7.2 | 10.8 | 9.8 |
| 34 | 7.0 | 7.2 | 10.3 | 9.4 |
| 35 | 6.9 | 7.1 | 9.6 | 8.8 |
| 36 | 6.8 | 7.0 | 8.9 | 8.2 |
| 37 | 6.8 | 6.9 | 8.3 | 7.7 |
| 38 | 6.7 | 6.9 | 7.8 | 7.2 |
| 39 | 6.5 | 6.8 | 7.4 | 6.8 |
| 40 | 6.4 | 6.6 | 7.1 | 6.4 |
| 41 | 6.4 | 6.5 | 6.8 | 6.1 |
| 42 | 6.4 | 6.4 | 6.6 | 5.8 |
| 43 | 6.4 | 6.4 | 6.2 | 5.4 |
| 44 | 6.2 | 6.4 | 5.9 | 5.0 |
| 45 | 6.2 | 6.3 | 5.7 | 4.7 |
| 46 | 6.4 | 6.3 | 5.4 | 4.3 |
| 47 | 6.6 | 6.4 | 5.2 | 4.1 |
| 48 | 6.6 | 6.6 | 5.0 | 4.1 |
| 49 | 6.5 | 6.6 | 4.9 | 4.3 |
| 50 | 6.4 | 6.5 | 4.9 | 4.5 |
| 51 | 6.5 | 6.4 | 4.8 | 4.8 |
| 52 | 6.9 | 6.5 | 4.7 | 4.9 |
| 53 | 7.3 | 6.9 | 4.6 | 4.8 |
| 54 | 7.5 | 7.3 | 4.6 | 4.7 |
| 55 | 7.6 | 7.5 | 4.5 | 4.5 |
| 56 | 7.4 | 7.5 | 4.5 | 4.4 |
| 57 | 7.4 | 7.3 | 4.5 | 4.3 |
| 58 | 7.2 | 7.3 | 4.3 | 4.2 |
| 59 | 7.0 | 7.2 | 4.1 | 4.0 |
| 60 | 6.9 | 7.0 | 3.9 | 3.8 |
| 61 | 6.7 | 6.9 | 3.7 | 3.7 |
| 62 | 6.5 | 6.7 | 3.5 | 3.5 |
| 63 | 6.4 | 6.5 | 3.4 | 3.5 |
| 64 | 6.0 | 6.3 | 3.2 | 3.5 |
| 65 | 5.7 | 6.0 | 3.3 | 3.7 |
| 66 | 5.5 | 5.7 | 3.1 | 3.7 |
| 67 | 5.3 | 5.4 | 3.0 | 3.6 |
| 68 | 5.1 | 5.3 | 2.7 | 3.3 |
| 69 | 5.0 | 5.1 | 2.3 | 2.8 |
| 70 | 4.9 | 4.9 | 2.0 | 2.4 |
| 71 | 4.8 | 4.8 | 1.7 | 1.9 |
| 72 | 4.1 | 4.7 | 1.4 | 1.5 |
| 73 | 3.7 | 4.0 | 1.3 | 1.3 |
| 74 | 3.5 | 3.6 | 1.2 | 1.3 |
| 75 | 3.3 | 3.4 | 1.1 | 1.3 |
| 76 | 3.0 | 3.2 | 1.0 | 1.2 |
| 77 | 2.8 | 2.9 | 0.9 | 1.1 |
| 78 | 2.5 | 2.7 | 0.8 | 1.0 |
| 79 | 2.3 | 2.4 | 0.7 | 0.8 |
| 80 | 2.1 | 2.2 | 0.6 | 0.7 |
| 81 | 2.0 | 2.0 | 0.5 | 0.6 |
| 82 | 1.8 | 1.9 | 0.4 | 0.5 |
| 83 | 1.7 | 1.7 | 0.4 | 0.5 |
| 84 | 1.5 | 1.5 | 0.3 | 0.5 |
| 85 | 1.4 | 1.4 | 0.3 | 0.4 |
| 86 | 1.2 | 1.3 | 0.2 | 0.4 |
| 87 | 1.1 | 1.1 | 0.2 | 0.4 |
| 88 | 0.9 | 1.0 | 0.1 | 0.4 |
| 89 | 0.8 | 0.8 | 0.1 | 0.3 |
| 90 | 0.6 | 0.7 | 0.1 | 0.2 |
| 91 | 0.5 | 0.5 | 0.1 | 0.2 |
| 92 | 0.4 | 0.4 | 0.1 | 0.1 |
| 93 | 0.3 | 0.3 | 0.1 | 0.1 |
| 94 | 0.2 | 0.2 | 0.0 | 0.1 |
| 95 | 0.2 | 0.2 | 0.0 | 0.1 |
| 96 | 0.1 | 0.1 | 0.0 | 0.0 |
| 97 | 0.1 | 0.1 | 0.0 | 0.0 |
| 98 | 0.1 | 0.1 | 0.0 | 0.0 |
| 99 | 0.0 | 0.0 | 0.0 | 0.0 |
| 100 | 0.0 | 0.0 | 0.0 | 0.0 |
|
Note: Persons aged 100 and over are included at age 100. Source: Statistics Canada, Centre for Demography, Demographic Estimates Program. |
||||
Internal migration by Canadians aged 18 to 24 and 25 to 44
Start of text boxFor the analysis of this section, a rate higher than -1 per thousand and lower than 1 per thousand is considered to be nil or low. Rates are based on the ratio of the number of events during the period (t, t+x) to the average of the populations for each age group at the beginning and end of the period.
In this section, internal migration patterns of Canadians aged 18 to 24 and 25 to 44 were analysed at the census division (CD)Note level, which is the smallest geographical unit for which internal migration estimates are disseminated. Canada has 293 CDs, which are groups of neighbouring municipalities joined together for the purpose of regional planning and managing common services.Note Internal migration can be broken down into two components: interprovincial migration which is composed of movements of people from CDs from one province or territory to CDs of another province or territory and intraprovincial migration which is the movement of people from one CD to another within the same province or territory.
In 2018/2019, the internal migration rates of Canadians aged 18 to 24 and 25 to 44 at the CD level were 47.1 and 45.3 migrants per thousand respectively. Although these groups exhibit similar rates of migration, the migration patterns of these groups are very different. These differences can be attributed to the different life stages traditionally associated with these age groups. For example, people aged 18 to 24 often move to seek education, and employment opportunities, while people aged 25 to 44 more often relocate for family, employment, and home ownership opportunities (Molloy 2011).
Consequently, the largest urban CDs, Montréal and Toronto, recorded the highest net internal migration in Canada in 2018/2019 for 18 to 24 years olds (Chart 6). High nets were also recorded in some smaller urban CDs with strong University vocation, like Québec and Capital (Victoria). Conversely the largest net losses of 18 to 24 year olds were observed in many suburban CDs neighboring Toronto (Peel and York) and Montreal (Laval and Roussillon).
Unlike 18 to 24 year olds, people aged 25 to 44 primarily moved away from Canada’s largest urban CDs (Toronto, Montreal and Vancouver) in favor of neighboring suburban CDs. As indicated in Chart 6, CDs neighboring Toronto posted the largest gains of 25 to 44 year olds (Durham, Simcoe, Halton). Additionally, many CDs containing medium sized cities such as Hamilton, Waterloo and Central Okanogan (Kelowna) also attracted many 25 to 44 year olds. Ottawa was the only large urban CD to attract 25 to 44 year olds in 2018/2019, with most large urban CDs experiencing losses (Chart 6).

Data table for Chart 6
| Census division | Net |
|---|---|
| 18 to 24 years | |
| Bottom 10 | |
| Peel (Ont.) | -3,203 |
| York (Ont.) | -603 |
| Essex (Ont.) | -495 |
| Laval (Que.) | -453 |
| L'Assomption (Que.) | -370 |
| Division No. 11 (Man.) | -344 |
| Roussillon (Que.) | -294 |
| Thérèse-De Blainville (Que.) | -272 |
| Division No. 13 (Alta.) | -244 |
| Cape Breton (N.S.) | -216 |
| Top 10 | |
| Central Okanagan (B.C.) | 542 |
| Québec (Que.) | 899 |
| Capital (B.C.) | 963 |
| Halifax (N.S.) | 1,029 |
| Division No. 6 (Alta.) | 1,059 |
| Greater Vancouver (B.C.) | 1,365 |
| Ottawa (Ont.) | 1,431 |
| Division No. 11 (Alta.) | 1,688 |
| Montréal (Que.) | 2,192 |
| Toronto (Ont.) | 2,305 |
| 25 to 44 years | |
| Bottom 10 | |
| Montréal (Que.) | -14,492 |
| Toronto (Ont.) | -11,867 |
| Peel (Ont.) | -7,782 |
| Division No. 11 (Man.) | -3,426 |
| Greater Vancouver (B.C.) | -2,243 |
| Division No. 6 (Sask.) | -1,445 |
| Division No. 11 (Sask.) | -1,126 |
| Division No. 1 (N.L.) | -713 |
| Québec (Que.) | -594 |
| Division No. 2 (Alta.) | -385 |
| Top 10 | |
| Waterloo (Ont.) | 1,083 |
| Central Okanagan (B.C.) | 1,157 |
| Roussillon (Que.) | 1,388 |
| Division No. 6 (Alta.) | 1,475 |
| Hamilton (Ont.) | 1,693 |
| Capital (B.C.) | 1,789 |
| Ottawa (Ont.) | 2,761 |
| Halton (Ont.) | 3,034 |
| Simcoe (Ont.) | 3,095 |
| Durham (Ont.) | 3,858 |
| Source: Statistics Canada, Centre for Demography, Demographic Estimates Program. | |
Net internal migration rates are displayed for Canadians aged 18 to 24 and 25 to 44 in Maps 1a and 1b respectively. Map 1a shows that the majority of Canada’s CDs experienced losses of 18 to 24 year olds with 209 of the 293 CDs posting negative migration rates. In general, CDs which experienced positive migration rates for 18 to 24 year olds were those with postsecondary education (Sherbrooke), active resource sectors (Wood Buffalo), and to a lesser extent tourist destinations with thriving hospitality sectors (Banff, Jasper, Lake Louise). These migration patterns primarily resulted in the concentration of 18 to 24 year olds in Canada’s urban CDs.
Canadians aged 25 to 44 displayed the opposite pattern with the majority moving out of Canada’s main urban CDs to neighboring more suburban and exurban CDs. Map 1b shows that across Canada the migration pattern of 25 to 44 year olds was more even with only 113 CDs experiencing losses, 14 CDs remained stable and 166 CDs experienced positive migration. Losses were primarily observed in rural and remote areas of the Prairie provinces, Newfoundland and Labrador as well as Nunavut and the Northwest Territories. Other areas which experienced losses included the CDs of Montréal and Toronto. Montréal and Toronto posted the largest net losses of internal migrants in the 25 to 44 year old age group with losses of -14,492 and -11,867 respectively. CDs which experienced positive migration were primarily located in southern British Columbia, southern Ontario and the Quebec-Montréal corridor.

Description for Map 1A
Net internal migration rates (per thousand) for people 18 to 24 years old by census division in 2018/2019. Census divisions are colour-coded by their respective migration rates ranging from dark brown for the lowest migration rates to dark green for the highest migration rates. Three circular inset maps highlight interprovincial migration rates in Toronto, Montreal and Vancouver.

Description for Map 1B
Net internal migration rates (per thousand) for people 25 to 44 years old by census division in 2018/2019. Census divisions are colour-coded by their respective migration rates ranging from dark brown for the lowest migration rates to dark green for the highest migration rates. Three circular inset maps highlight interprovincial migration rates in Toronto, Montreal and Vancouver.
Overview of the 2019/2020 period
Start of text boxThe analysis in this section is based on preliminary data. These data will be revised over the coming years, and it is possible that some trends described in this section will change as a result of these revisions. Therefore, this section should be interpreted with caution.
Preliminary estimates for the 2019/2020 period, released in September 2020, indicated that interprovincial migration in Canada increased by 24,173 from the previous year, for a total of 278,316 migrants. The corresponding interprovincial migration rate of 7.4 per thousand represents a significant increase from 6.8 per thousand observed in 2018/2019.
The preliminary net interprovincial migration data for 2019/2020 shows that British Columbia was once again the province with the highest net number of interprovincial migrants (+15,708). Meanwhile, Alberta experienced positive migration (+2,183) for the first time since 2014/2015. Nova Scotia and New Brunswick continued to show positive net migration.
Ontario, which had the second highest net migration in Canada in 2018/2019, recorded a net migration of +363 in 2019/2020, the lowest since 2014/2015. Negative net interprovincial migration was observed in Saskatchewan (-11,247) and Manitoba (-8,689). Quebec's net migration, although negative (-1,238), was the highest since 2003/2004.
Summary
Interprovincial migration trends observed in 2018/2019 were consistent with patterns displayed in recent years. Quebec experienced net negative interprovincial migration primarily benefiting Ontario; Saskatchewan and Manitoba lost a significant amount of interprovincial migrants to British Columbia and Alberta; and the Atlantic provinces with the exception of Newfoundland and Labrador experienced low, but positive, interprovincial migration. These trends also appeared to persist in preliminary population estimates for 2019/2020. Additionally the average age of interprovincial migrants remained low, with Canadians aged 18 to 24 and 25 to44 representing the most mobile age groups. Although these age groups had similar net rates of migration, the migration patterns exhibited by these two groups were quite different. Internal migrants 18 to 24 years old primarily moved to Canada’s urban centers while 25 to 44 year old migrants generally moved away from primary urban centers to neighboring suburban and exurban regions.
References
Bourbeau, E. and A. Fields. 2017. Annual review of the labor market, 2016. Labour Statistics Research Paper Series. Statistics Canada catalogue no. 75-004-M. Ottawa. https://www150.statcan.gc.ca/pub/75-004-m/75-004-m2017001-eng.pdf
Molloy, R.S.C. 2011. Internal migration in the United States. Institute for the Study of Labor.
- Date modified: