
Quarterly Demographic Estimates
April to June 2019

Archived Content
Information identified as archived is provided for reference, research or recordkeeping purposes. It is not subject to the Government of Canada Web Standards and has not been altered or updated since it was archived. Please "contact us" to request a format other than those available.
Highlights
- On July 1, 2019, Canada’s population was 37,589,262.
- Between April 1 and July 1, 2019, Canada’s population grew by 181,057 (+0.5%). This is one of the largest quarterly gains to date.
- Between April 1 and July 1, 2019, Canada welcomed 94,281 new immigrants, a record number for any quarter.
Analysis
Canada’s population grows steadily
This analysis is based on preliminary data. Since these data will be revised in the coming year, some trends described in this analysis may change as a result of these revisions. Therefore, this analysis should be interpreted with caution.
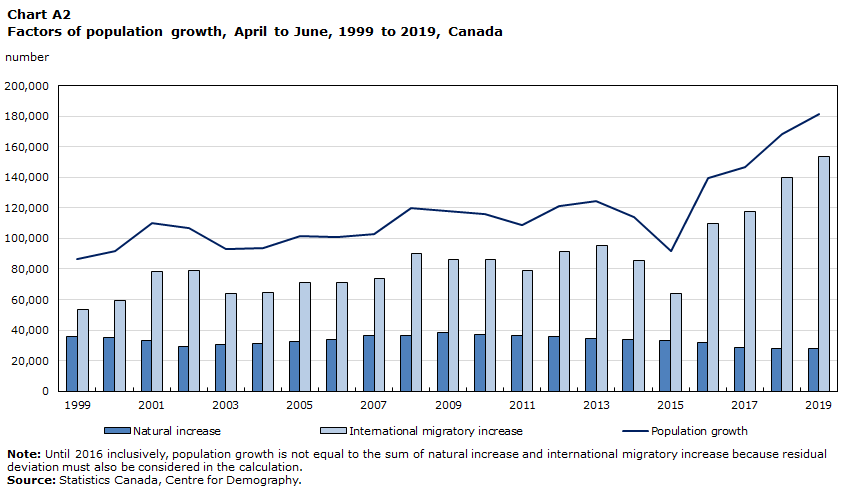
Population growth is generally strongest during the summer months, followed closely by the second quarter. However, all quarters considered, Canada’s population growth between April 1 and July 1, 2019, is one of the highest seen to date, at 0.5%. Canada’s population was estimated at 37,589,262 on July 1, 2019, up 181,057 compared with April 1. This is the second-highest quarterly increase, in absolute numbers, during the study period from July 1971 to July 2019.Note 1

Data table for Chart A1
| Year | Percent |
|---|---|
| 1999 | 0.29 |
| 2000 | 0.30 |
| 2001 | 0.35 |
| 2002 | 0.34 |
| 2003 | 0.30 |
| 2004 | 0.29 |
| 2005 | 0.32 |
| 2006 | 0.31 |
| 2007 | 0.31 |
| 2008 | 0.36 |
| 2009 | 0.35 |
| 2010 | 0.34 |
| 2011 | 0.32 |
| 2012 | 0.35 |
| 2013 | 0.36 |
| 2014 | 0.32 |
| 2015 | 0.26 |
| 2016 | 0.39 |
| 2017 | 0.40 |
| 2018 | 0.45 |
| 2019 | 0.48 |
| Source: Statistics Canada, Centre for Demography. | |
International migratory increaseNote 2 was estimated at 153,262 people between April 1 and July 1, 2019. This was led by the arrival of a record number of new immigrants (94,281 individuals) during this three-month period. Moreover, Canada experienced the largest second-quarter increase in the number of non-permanent residents (+66,111), which was also one of the highest for any quarter.
International migration remained the main driver of Canada’s population growth, accounting for 85% of the quarterly growth, compared with 58% 30 years earlier (the second quarter of 1989).
According to preliminary estimates, natural increase in the second quarter of 2019 was the lowest estimated level for a second quarter, at 27,795 people—the difference between 97,640 births and 69,845 deaths. The number of deaths has never been so high for a second quarter. Also, the number of births was the lowest for a second quarter since 1995. In the coming years, natural increase is expected to continue to decrease, mainly because of population aging, which results in an increase in the number of deaths recorded each year.
Data table for Chart A2
| Year | Natural increase | International migratory increase | Population growth |
|---|---|---|---|
| number | |||
| 1999 | 35,885 | 53,191 | 86,590 |
| 2000 | 34,892 | 59,296 | 91,700 |
| 2001 | 33,316 | 78,621 | 109,906 |
| 2002 | 29,589 | 78,709 | 106,697 |
| 2003 | 30,645 | 64,216 | 93,260 |
| 2004 | 30,923 | 64,662 | 93,986 |
| 2005 | 32,255 | 71,155 | 101,810 |
| 2006 | 34,143 | 71,177 | 100,871 |
| 2007 | 36,491 | 73,750 | 103,011 |
| 2008 | 36,669 | 90,156 | 119,598 |
| 2009 | 38,482 | 86,365 | 117,620 |
| 2010 | 36,864 | 86,017 | 115,653 |
| 2011 | 36,144 | 79,041 | 108,950 |
| 2012 | 35,580 | 91,357 | 121,443 |
| 2013 | 34,657 | 95,577 | 124,738 |
| 2014 | 34,081 | 85,318 | 113,902 |
| 2015 | 32,973 | 64,157 | 91,637 |
| 2016 | 31,890 | 109,648 | 139,184 |
| 2017 | 28,620 | 117,916 | 146,536 |
| 2018 | 28,216 | 140,006 | 168,222 |
| 2019 | 27,795 | 153,262 | 181,057 |
|
Note: Until 2016 inclusively, population growth is not equal to the sum of natural increase and international migratory increase because residual deviation must also be considered in the calculation. Source: Statistics Canada, Centre for Demography. |
|||
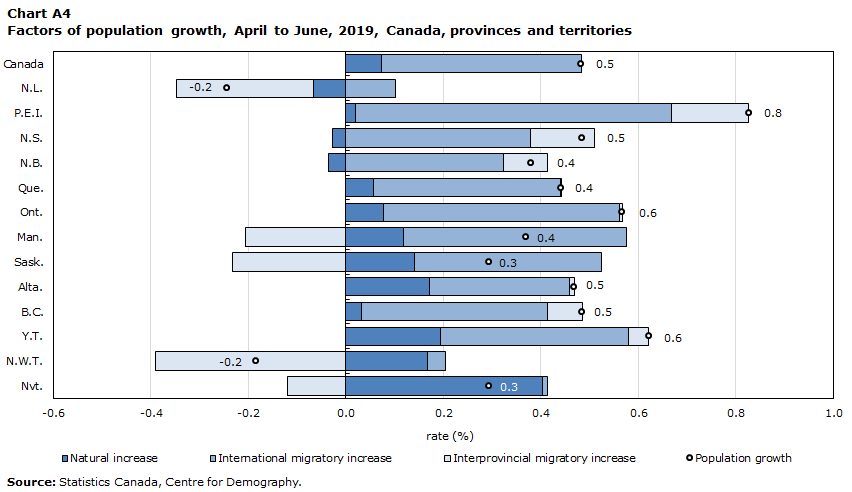
Population growth is highest in Prince Edward Island and lowest in Newfoundland and Labrador and in the Northwest Territories
Prince Edward Island (+0.8%) posted the most rapid population growth in Canada during the second quarter. Population growth in Ontario (+0.6%), the second highest in the country with that of Yukon, reached a level rarely seen in a second quarter since the end of the 1980s. Growth in Nova Scotia, Alberta and British Columbia was the same as the Canadian average (+0.5%).
In contrast, the population decreased in Newfoundland and Labrador and in the Northwest Territories (-0.2% each) in the second quarter. The population decline in Newfoundland and Labrador has been ongoing since the fourth quarter of 2016. In the other provinces and territories, population growth was positive and ranged from 0.3% to 0.4%.

Data table for Chart A3
| Provinces and territories | 2018 | 2019 | 2018 (Canada) | 2019 (Canada) |
|---|---|---|---|---|
| percent | ||||
| N.L. | -0.17 | -0.24 | 0.45 | 0.48 |
| P.E.I. | 0.90 | 0.83 | 0.45 | 0.48 |
| N.S. | 0.43 | 0.48 | 0.45 | 0.48 |
| N.B. | 0.25 | 0.38 | 0.45 | 0.48 |
| Que. | 0.37 | 0.44 | 0.45 | 0.48 |
| Ont. | 0.54 | 0.57 | 0.45 | 0.48 |
| Man. | 0.44 | 0.37 | 0.45 | 0.48 |
| Sask. | 0.30 | 0.29 | 0.45 | 0.48 |
| Alta. | 0.39 | 0.47 | 0.45 | 0.48 |
| B.C. | 0.53 | 0.49 | 0.45 | 0.48 |
| Y.T. | 1.02 | 0.62 | 0.45 | 0.48 |
| N.W.T. | -0.77 | -0.18 | 0.45 | 0.48 |
| Nvt. | 0.87 | 0.29 | 0.45 | 0.48 |
| Source: Statistics Canada, Centre for Demography. | ||||
International migration is the main factor in the provinces’ growth
Net international migration was positive in all provinces and in Yukon in the second quarter of 2019. It was the main growth driver, reaching levels rarely, if ever, seen during a second quarter. This situation is mainly due to the high number of new immigrants, with the exception of Quebec, which recorded the lowest level in a second quarter since the early 2000s. Conversely, the increase in the number of non-permanent residents in Quebec is by far the highest (+23,890) for any quarter. Along with natural increase, international migration offset interprovincial migratory losses in Manitoba and Saskatchewan. Ontario again welcomed the most immigrants: almost one out of two immigrants to Canada, or 46.2%, during the period.
Moreover, the territories continued to post the highest rates of natural increase, at 0.4% (Nunavut) and 0.2% (Yukon and the Northwest Territories). Fertility levels in the territories are among the highest in Canada.Note 3 Among the provinces, only Alberta (+0.2%) recorded a natural increase above the national average (+0.1%).
Based on preliminary estimates, three Atlantic provinces recorded more deaths than births: Newfoundland and Labrador (-342), Nova Scotia (-257) and New Brunswick (-273). In Newfoundland and Labrador, interprovincial migration was also down (-1,472), and contributed to the population decrease, in spite of the increases from international migration.
Data table for Chart A4
| Provinces and territories | Natural increase | International migratory increase | Interprovincial migratory increase | Population growth |
|---|---|---|---|---|
| rate (%) | ||||
| Canada | 0.07 | 0.41 | 0.00 | 0.48 |
| N.L. | -0.07 | 0.10 | -0.28 | -0.24 |
| P.E.I. | 0.02 | 0.65 | 0.16 | 0.83 |
| N.S. | -0.03 | 0.38 | 0.13 | 0.48 |
| N.B. | -0.04 | 0.32 | 0.09 | 0.38 |
| Que. | 0.06 | 0.38 | 0.00 | 0.44 |
| Ont. | 0.08 | 0.48 | 0.01 | 0.57 |
| Man. | 0.12 | 0.46 | -0.20 | 0.37 |
| Sask. | 0.14 | 0.38 | -0.23 | 0.29 |
| Alta. | 0.17 | 0.29 | 0.01 | 0.47 |
| B.C. | 0.03 | 0.38 | 0.07 | 0.49 |
| Y.T. | 0.19 | 0.39 | 0.04 | 0.62 |
| N.W.T. | 0.17 | 0.04 | -0.39 | -0.18 |
| Nvt. | 0.40 | 0.01 | -0.12 | 0.29 |
| Source: Statistics Canada, Centre for Demography. | ||||
Manitoba and Saskatchewan had more interprovincial out-migrants than in-migrants in the second quarter, with net migration of -2,802 and -2,719 people, respectively. Furthermore, these interprovincial migratory losses were the highest among all jurisdictions for a seventh consecutive quarter. However, these deficits were offset by other population growth factors, meaning that the population of these two Prairie provinces continued to grow.
After posting uninterrupted net interprovincial outflows since the first quarter of 2010, with average losses of 2,300 per quarter, Quebec gained a few more interprovincial migrants (+72) than it lost between April 1 and July 1, 2019.
Five provinces—Prince Edward Island, Quebec, Ontario, Alberta and British Columbia—and Yukon saw gains from natural increase, international migration and interprovincial migration, but at varying levels. International migratory increase was the main contributor to total growth in Prince Edward Island (78.4%), Quebec (87.1%), Ontario (85.5%) and British Columbia (78.2%). International migration also played a leading role in population growth in Alberta (61.1%) and Yukon (62.1%), in conjunction with natural increase (36.8% and 31.2%, respectively).

Data table for Chart A5
| Provinces and territories | In-migrants | Out-migrants | Net |
|---|---|---|---|
| number | |||
| N.L. | 2,109 | -3,581 | -1,472 |
| P.E.I. | 1,635 | -1,388 | 247 |
| N.S. | 6,704 | -5,423 | 1,281 |
| N.B. | 4,411 | -3,705 | 706 |
| Que. | 9,820 | -9,748 | 72 |
| Ont. | 27,735 | -26,933 | 802 |
| Man. | 3,933 | -6,735 | -2,802 |
| Sask. | 6,073 | -8,792 | -2,719 |
| Alta. | 24,019 | -23,602 | 417 |
| B.C. | 22,211 | -18,539 | 3,672 |
| Y.T. | 688 | -671 | 17 |
| N.W.T. | 652 | -827 | -175 |
| Nvt. | 674 | -720 | -46 |
| Source: Statistics Canada, Centre for Demography. | |||
| Population | Population growth for the second quarter | ||||
|---|---|---|---|---|---|
| 2018 | 2019 | ||||
| number | rate (%) | number | rate (%) | ||
| Canada | 37,589,262 | 168,222 | 0.45 | 181,057 | 0.48 |
| N.L. | 521,542 | -889 | -0.17 | -1,276 | -0.24 |
| P.E.I. | 156,947 | 1,376 | 0.90 | 1,291 | 0.83 |
| N.S. | 971,395 | 4,124 | 0.43 | 4,686 | 0.48 |
| N.B. | 776,827 | 1,909 | 0.25 | 2,940 | 0.38 |
| Que. | 8,484,965 | 31,382 | 0.37 | 37,356 | 0.44 |
| Ont. | 14,566,547 | 77,166 | 0.54 | 82,305 | 0.57 |
| Man. | 1,369,465 | 5,937 | 0.44 | 5,065 | 0.37 |
| Sask. | 1,174,462 | 3,496 | 0.30 | 3,435 | 0.29 |
| Alta. | 4,371,316 | 16,848 | 0.39 | 20,415 | 0.47 |
| B.C. | 5,071,336 | 26,478 | 0.53 | 24,556 | 0.49 |
| Y.T. | 40,854 | 412 | 1.02 | 253 | 0.62 |
| N.W.T. | 44,826 | -346 | -0.77 | -83 | -0.18 |
| Nvt. | 38,780 | 329 | 0.87 | 114 | 0.29 |
| Source: Statistics Canada, Centre for Demography. | |||||
Notes
- Date modified: