
Quarterly Demographic Estimates
January to March 2019

Archived Content
Information identified as archived is provided for reference, research or recordkeeping purposes. It is not subject to the Government of Canada Web Standards and has not been altered or updated since it was archived. Please "contact us" to request a format other than those available.
Highlights
- On April 1, 2019, Canada’s population was 37,412,852.
- Between January 1 and April 1, 2019, Canada’s population grew by 98,410 (+0.3%).
- Compared with the first quarter of 2018, the number of new immigrants fell from 79,957 to 65,959.
Analysis
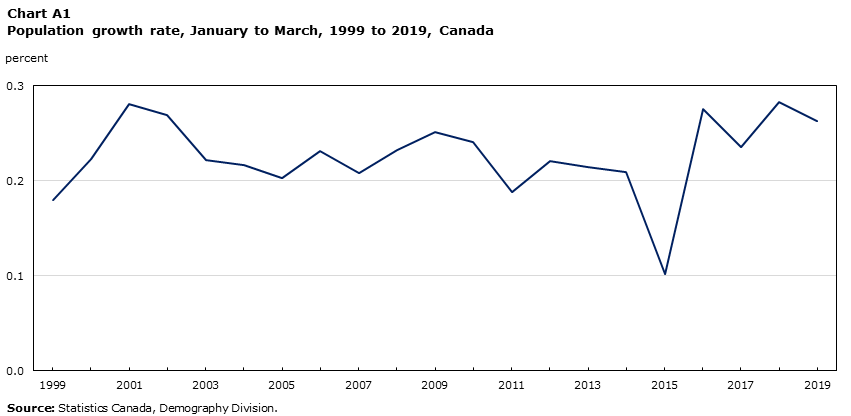
Canada’s population grows steadily
This analysis is based on preliminary data. Since these data will be revised in the coming year, some trends described in this analysis may change as a result of these revisions. Therefore, this analysis should be interpreted with caution.
In the past 10 years, the average population growth rate in the first quarter has been 0.2%. In this context, the population growth of 98,410 (+0.3%) recorded in the first quarter of 2019 was slightly higher. It also came on the heels of the strong growth of 104,148 (+0.3%) recorded in the first quarter of 2018. On April 1, 2019, Canada’s population was 37,412,852.
Data table for Chart A1
| Year | Percent |
|---|---|
| 1999 | 0.18 |
| 2000 | 0.22 |
| 2001 | 0.28 |
| 2002 | 0.27 |
| 2003 | 0.22 |
| 2004 | 0.22 |
| 2005 | 0.20 |
| 2006 | 0.23 |
| 2007 | 0.21 |
| 2008 | 0.23 |
| 2009 | 0.25 |
| 2010 | 0.24 |
| 2011 | 0.19 |
| 2012 | 0.22 |
| 2013 | 0.22 |
| 2014 | 0.21 |
| 2015 | 0.10 |
| 2016 | 0.28 |
| 2017 | 0.24 |
| 2018 | 0.28 |
| 2019 | 0.26 |
| Source: Statistics Canada, Demography Division. | |
Since 2001, the first quarter is when Canada’s natural increaseNote 1 has been the lowest, because of seasonal patterns associated with births and deaths. In the first quarter of 2019, the 91,723 births combined with the 74,770 deaths resulted in a natural increase of 16,953 people. This was the lowest natural increase in a first quarter since the start of the study period,Note 2 with the exception of the one recorded in 2018 (+16,823).
International migratory increase,Note 3 estimated at 81,457 people between January 1 and April 1 2019, remained the main driver of Canada’s population growth. This was led by the arrival of 65,959 new immigrants. However, this figure was down 17.5% when compared with the first quarter of 2018, when Canada welcomed 79,957 immigrants. This lessened contribution from immigration was compensated by the highest increase in net non-permanent residents (+31,547) during a first quarter since 1989. Finally, international migratory increase was offset by the departure of 15,682 emigrants and 6,542 temporary emigrants.

Data table for Chart A2
| Year | Natural increase | International migratory increase | Population growth |
|---|---|---|---|
| number | |||
| 1999 | 20,658 | 36,381 | 54,579 |
| 2000 | 23,615 | 47,030 | 68,158 |
| 2001 | 23,364 | 65,652 | 86,555 |
| 2002 | 20,546 | 65,026 | 83,989 |
| 2003 | 20,909 | 50,768 | 70,096 |
| 2004 | 20,531 | 50,034 | 68,965 |
| 2005 | 18,075 | 48,731 | 65,223 |
| 2006 | 24,736 | 51,839 | 74,994 |
| 2007 | 22,941 | 52,520 | 68,313 |
| 2008 | 27,286 | 56,850 | 76,907 |
| 2009 | 27,786 | 63,587 | 84,225 |
| 2010 | 29,194 | 59,662 | 81,707 |
| 2011 | 24,232 | 47,197 | 64,279 |
| 2012 | 27,101 | 54,819 | 76,427 |
| 2013 | 22,702 | 57,829 | 75,097 |
| 2014 | 24,522 | 54,806 | 73,894 |
| 2015 | 17,505 | 24,011 | 36,084 |
| 2016 | 22,021 | 82,640 | 99,167 |
| 2017 | 18,404 | 67,252 | 85,656 |
| 2018 | 16,823 | 87,325 | 104,148 |
| 2019 | 16,953 | 81,457 | 98,410 |
|
Note: Until 2016 inclusively, population growth is not equal to the sum of natural increase and international migratory increase because residual deviation must also be considered in the calculation. Source: Statistics Canada, Demography Division. |
|||
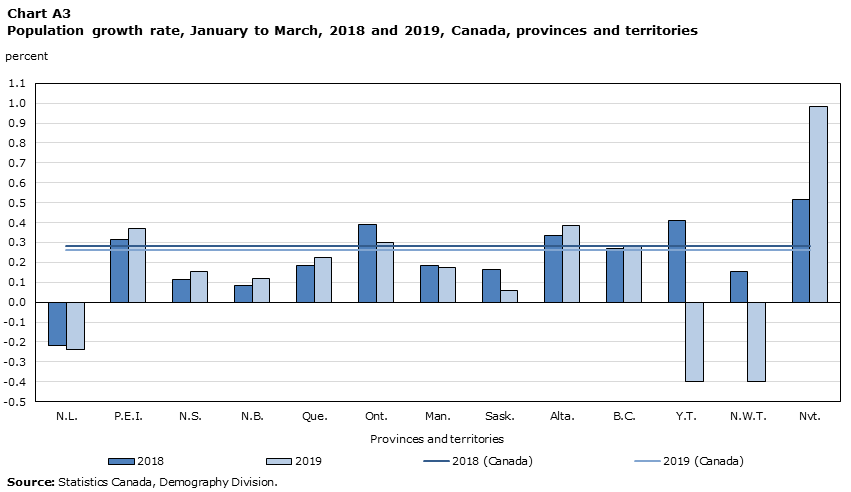
Population growth was highest in Nunavut and lowest in Yukon and in the Northwest Territories
Nunavut (+1.0%) posted the biggest population growth in Canada during the first quarter. Among the provinces, Prince Edward Island and Alberta had the highest gains (+0.4%). In Ontario, the population grew steadily (+0.3%) for a first quarter, continuing a trend begun in 2016. British Columbia’s growth was the same as the Canadian average (+0.3%).
In contrast, the population decreased in Yukon and in the Northwest Territories (-0.4%) in the first quarter. Meanwhile, the population of Newfoundland and Labrador decreased by -1,253 people (-0.2%). This population decline was in line with the decrease posted during the first quarter of 2018 (-1,147). In the other provinces and territories, population growth was positive and ranged from 0.1% to 0.3%.
Data table for Chart A3
| Provinces and territories | 2018 | 2019 | 2018 (Canada) | 2019 (Canada) |
|---|---|---|---|---|
| percent | percent | |||
| N.L. | -0.22 | -0.24 | 0.28 | 0.26 |
| P.E.I. | 0.31 | 0.37 | 0.28 | 0.26 |
| N.S. | 0.11 | 0.15 | 0.28 | 0.26 |
| N.B. | 0.08 | 0.12 | 0.28 | 0.26 |
| Que. | 0.18 | 0.22 | 0.28 | 0.26 |
| Ont. | 0.39 | 0.30 | 0.28 | 0.26 |
| Man. | 0.18 | 0.18 | 0.28 | 0.26 |
| Sask. | 0.16 | 0.06 | 0.28 | 0.26 |
| Alta. | 0.33 | 0.39 | 0.28 | 0.26 |
| B.C. | 0.27 | 0.28 | 0.28 | 0.26 |
| Y.T. | 0.41 | -0.40 | 0.28 | 0.26 |
| N.W.T. | 0.15 | -0.40 | 0.28 | 0.26 |
| Nvt. | 0.52 | 0.98 | 0.28 | 0.26 |
| Source: Statistics Canada, Demography Division. | ||||
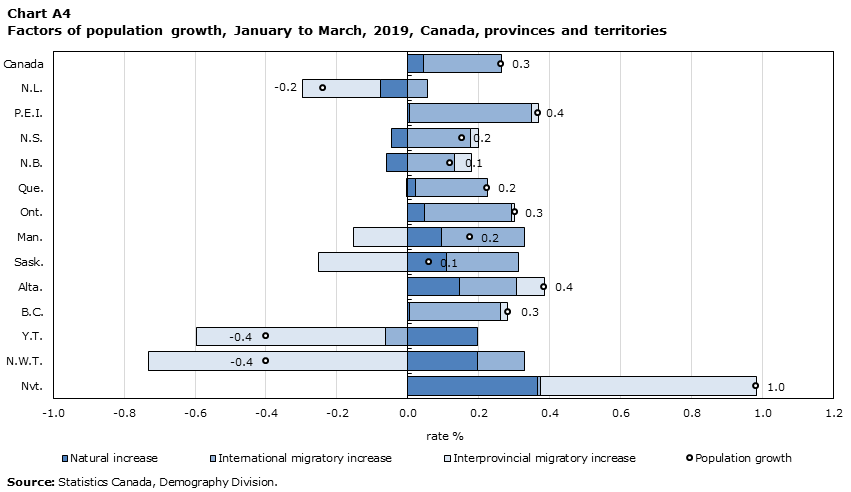
International migration was the main driver of growth in the provinces
Net international migration was positive in all provinces in the first quarter of 2019 and was the main driver of growth. Nevertheless, aside from Prince Edward Island, all the provinces saw a decline in the number of immigrants compared with the first quarter of 2018. Ontario again welcomed the most immigrants (47.2% of all immigrants in Canada during the period).
Even though their populations declined in the first quarter, Yukon and the Northwest Territories (+0.2%) had among the highest natural increase rates in the country, since only Nunavut had a higher natural increase (+0.4%). Among the provinces, natural increase in Manitoba, Saskatchewan and Alberta (+0.1%) was above the national average (0.0%).
Three Atlantic provinces recorded more deaths than births: Newfoundland and Labrador (-406), Nova Scotia (-439) and New Brunswick (-462). In Newfoundland and Labrador, interprovincial migration was also down (-1,143) and contributed to the population decrease.
Data table for Chart A4
| Provinces and territories | Natural increase | International migratory increase | Interprovincial migratory increase | Population growth |
|---|---|---|---|---|
| rate (%) | ||||
| Canada | 0.05 | 0.22 | 0.00 | 0.26 |
| N.L. | -0.08 | 0.06 | -0.22 | -0.24 |
| P.E.I. | 0.01 | 0.34 | 0.02 | 0.37 |
| N.S. | -0.05 | 0.18 | 0.02 | 0.15 |
| N.B. | -0.06 | 0.13 | 0.05 | 0.12 |
| Que. | 0.02 | 0.20 | 0.00 | 0.22 |
| Ont. | 0.05 | 0.24 | 0.01 | 0.30 |
| Man. | 0.09 | 0.24 | -0.15 | 0.18 |
| Sask. | 0.11 | 0.20 | -0.25 | 0.06 |
| Alta. | 0.14 | 0.16 | 0.08 | 0.39 |
| B.C. | 0.01 | 0.26 | 0.02 | 0.28 |
| Y.T. | 0.20 | -0.06 | -0.53 | -0.40 |
| N.W.T. | 0.20 | 0.13 | -0.73 | -0.40 |
| Nvt. | 0.37 | 0.01 | 0.61 | 0.98 |
| Source: Statistics Canada, Demography Division. | ||||
Manitoba and Saskatchewan had more interprovincial out-migrants than in-migrants in the first quarter, with net migration of -2,102 and -2,940 people, respectively. This was the sixth consecutive quarter in which these two provinces posted the highest losses to other provinces and territories. However, these deficits were offset by other population growth factors.
Four provinces—Prince Edward Island, Ontario, Alberta and British Columbia—as well as Nunavut, saw gains from natural increase, international migration and interprovincial migration. While international migratory increase was the main contributor to total growth in Prince Edward Island (93.0%), Ontario (80.7%) and British Columbia (90.9%), Alberta’s growth was mainly led by international migration (42.0%) and natural increase (37.5%). In Nunavut, interprovincial migration accounted for 61.9% of the total growth. Its net interprovincial migration of 237 was a record in a first quarter since 1991.Note 4

Data table for Chart A5
| Provinces and territories | In-migrants | Out-migrants | Net |
|---|---|---|---|
| number | |||
| N.L. | 1,475 | -2,618 | -1,143 |
| P.E.I. | 895 | -864 | 31 |
| N.S. | 4,170 | -3,949 | 221 |
| N.B. | 3,050 | -2,675 | 375 |
| Que. | 5,273 | -5,318 | -45 |
| Ont. | 16,732 | -15,262 | 1,470 |
| Man. | 2,802 | -4,904 | -2,102 |
| Sask. | 3,695 | -6,635 | -2,940 |
| Alta. | 17,577 | -14,149 | 3,428 |
| B.C. | 12,887 | -11,879 | 1,008 |
| Y.T. | 325 | -540 | -215 |
| N.W.T. | 388 | -713 | -325 |
| Nvt. | 611 | -374 | 237 |
| Source: Statistics Canada, Demography Division. | |||
| Population | Population growth for the first quarter | ||||
|---|---|---|---|---|---|
| 2018 | 2019 | ||||
| number | rate (%) | number | rate (%) | ||
| Canada | 37,412,852 | 104,148 | 0.28 | 98,410 | 0.26 |
| N.L. | 522,537 | -1,147 | -0.22 | -1,253 | -0.24 |
| P.E.I. | 155,318 | 474 | 0.31 | 570 | 0.37 |
| N.S. | 966,858 | 1,097 | 0.11 | 1,476 | 0.15 |
| N.B. | 773,020 | 636 | 0.08 | 926 | 0.12 |
| Que. | 8,452,209 | 15,224 | 0.18 | 18,908 | 0.22 |
| Ont. | 14,490,207 | 55,355 | 0.39 | 43,692 | 0.30 |
| Man. | 1,362,789 | 2,466 | 0.18 | 2,393 | 0.18 |
| Sask. | 1,169,131 | 1,872 | 0.16 | 708 | 0.06 |
| Alta. | 4,362,503 | 14,273 | 0.33 | 16,766 | 0.39 |
| B.C. | 5,034,482 | 13,469 | 0.27 | 14,180 | 0.28 |
| Y.T. | 40,208 | 165 | 0.41 | -161 | -0.40 |
| N.W.T. | 44,420 | 69 | 0.15 | -178 | -0.40 |
| Nvt. | 39,170 | 195 | 0.52 | 383 | 0.98 |
| Source: Statistics Canada, Demography Division. | |||||
Notes
- Date modified: