Quarterly Demographic Estimates
July to September 2018
Archived Content
Information identified as archived is provided for reference, research or recordkeeping purposes. It is not subject to the Government of Canada Web Standards and has not been altered or updated since it was archived. Please "contact us" to request a format other than those available.
Highlights
- On October 1, 2018, Canada’s population was estimated at 37,242,571.
- Between July 1 and October 1, 2018, Canada’s population grew by 183,715 (+0.5%), the largest increase in absolute numbers for a single quarter during the study period from 1971 to 2018.Note
- In the third quarter of 2018, Canada’s population growth was mostly due to international migratory increase (+146,531), the highest level for any quarter.
- Population growth in Prince Edward Island (+1.0%), Nunavut (+0.7%) and Ontario (+0.6%) was higher than Canada’s.
- The population of British Colombia passed the five-million mark in the third quarter of 2018, estimated at 5,016,322 on October 1, 2018.
- Preliminary estimates for the last quarter show that Alberta recorded interprovincial migration gains (+3,222) for a third consecutive quarter, following 10 continuous quarters of interprovincial migration losses.
- Interprovincial migration in Ontario was positive in the third quarter (+7,637), marking 13 consecutive quarters of gains in its exchanges with the other provinces.
- British Columbia recorded interprovincial losses (-1,217) in the third quarter of 2018, following 21 consecutive quarters of gains.
Analysis
Canada’s population is growing fast
The analysis in this publication is based on preliminary data. Since these data will be revised in the coming year, some trends described in this publication may change as a result of these revisions. Therefore, this publication should be interpreted with caution.
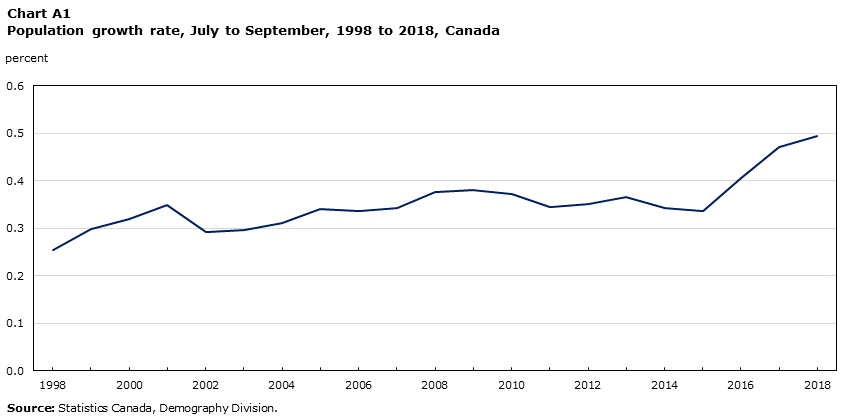
According to preliminary estimates, Canada’s population was 37,242,571 on October 1, 2018.
Between July 1 and October 1, 2018, the Canadian population increased by 183,715. This quarterly increase is the highest ever in absolute numbers in the study period from July 1971 to October 2018.Note The estimated growth between July 1 and October 1, 2018, topped the previous high recorded in the third quarter of 2017. In both cases, the significant growth was driven by strong international migration, and particularly an unprecedented increase in the number of non-permanent residents.Note
Moreover, Canada posted a population growth rate of 0.5% between July 1 and October 1, 2018, a level rarely seen in a quarter.

Data table for Chart A1
| Year | Percent |
|---|---|
| 1998 | 0.25 |
| 1999 | 0.30 |
| 2000 | 0.32 |
| 2001 | 0.35 |
| 2002 | 0.29 |
| 2003 | 0.30 |
| 2004 | 0.31 |
| 2005 | 0.34 |
| 2006 | 0.34 |
| 2007 | 0.34 |
| 2008 | 0.38 |
| 2009 | 0.38 |
| 2010 | 0.37 |
| 2011 | 0.34 |
| 2012 | 0.35 |
| 2013 | 0.37 |
| 2014 | 0.34 |
| 2015 | 0.34 |
| 2016 | 0.41 |
| 2017 | 0.47 |
| 2018 | 0.49 |
| Source: Statistics Canada, Demography Division. | |
International migration continues to account for most of the population growth
Nationally, population growth is based on two factors: natural increaseNote and international migratory increase.Note Provincial and territorial population estimates also factor in interprovincial migratory increase.
International migratory increase remained the main driver of Canada’s population growth, with an estimated increase of 146,531 between July 1 and October 1, 2018. This was the highest level seen for any quarter during the study period from July 1971 to October 2018. This increase is due to a rise in both the number of immigrants and the number of non-permanent residents. International migration, particularly non-permanent residents, follows a seasonal pattern because the data generally show a greater number of international migrants between April and September.
In the third quarter of 2018, the number of new immigrants was 82,316. This was the fifth-largest contingent of new immigrants recorded for a single quarter during the study period.
Moreover, Canada posted an increase in the number of non-permanent residents (+79,417) in the third quarter of 2018. Canada has never seen such a large increase in the number of non-permanent residents in a single quarter. This increase was mostly on account of an increase in the number of work permit and study permit holders and, to a lesser extent, the number of refugee claimants. The components of net emigration (emigration, return emigration and net temporary emigration) remained stable (-15,202).
According to preliminary estimates, natural increase in the third quarter of 2018 was 37,184. This is the lowest estimated level for a third quarter since 2005. Natural increase has been on a downward trend since 2012. It is the difference between 103,199 births and 66,015 deaths. The last time the number of births for a third quarter was higher was in 1991. However, the number of deaths has never been as high in a third quarter. In the coming years, natural increase is expected to continue decreasing, mainly as a result of population aging, which may lead to an increase in the number of deaths observed each year.

Data table for Chart A2
| Year | Natural increase | International migratory increase | Population growth |
|---|---|---|---|
| number | |||
| 1998 | 38,934 | 40,047 | 76,466 |
| 1999 | 37,567 | 55,769 | 90,820 |
| 2000 | 31,981 | 68,775 | 98,239 |
| 2001 | 33,964 | 75,870 | 108,217 |
| 2002 | 33,177 | 60,125 | 91,685 |
| 2003 | 35,445 | 60,012 | 93,841 |
| 2004 | 35,211 | 65,711 | 99,304 |
| 2005 | 36,917 | 74,917 | 110,215 |
| 2006 | 40,042 | 76,801 | 109,538 |
| 2007 | 42,397 | 78,023 | 113,113 |
| 2008 | 44,795 | 87,811 | 125,300 |
| 2009 | 45,301 | 90,190 | 128,182 |
| 2010 | 41,035 | 93,066 | 126,794 |
| 2011 | 43,470 | 80,755 | 118,670 |
| 2012 | 42,836 | 84,505 | 121,786 |
| 2013 | 41,836 | 92,630 | 128,912 |
| 2014 | 41,597 | 85,569 | 121,612 |
| 2015 | 40,786 | 84,757 | 119,986 |
| 2016 | 39,655 | 106,965 | 146,620 |
| 2017 | 37,993 | 134,397 | 172,390 |
| 2018 | 37,184 | 146,531 | 183,715 |
|
Note: Until 2015 inclusively, population growth is not equal to the sum of natural increase and international migratory increase because residual deviation must also be considered in the calculation. Source: Statistics Canada, Demography Division. |
|||
The population grows everywhere, except in Newfoundland and Labrador, Yukon and the Northwest Territories
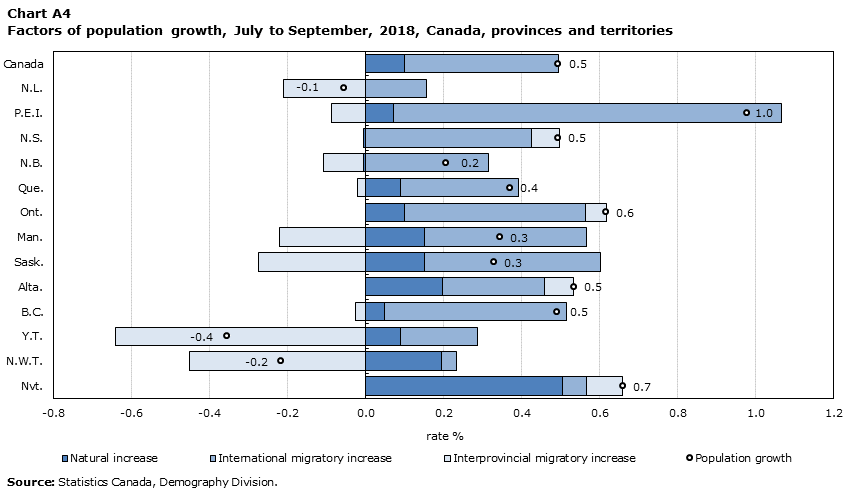
The population grewNote in all provinces and territories in the third quarter of 2018, except in Newfoundland and Labrador (-0.1%), Yukon (-0.4%) and the Northwest Territories (-0.2%). Prince Edward Island (+1.0%), Nunavut (+0.7%) and Ontario (+0.6%) had higher population growth rates than Canada’s (+0.5%).
The population of British Colombia passed the five-million mark in the third quarter of 2018, estimated at 5,016,322 on October 1, 2018.
Compared with the same period last year, an increase in the population growth rate was observed in Prince Edward Island, Nova Scotia, Alberta and Nunavut. The data also show a shift in the growth rate from positive to negative in Yukon and the Northern Territories, and from not significant to negative in Newfoundland and Labrador.

Data table for Chart A3
| Provinces and territories | 2017 | 2018 | 2017 (Canada) | 2018 (Canada) |
|---|---|---|---|---|
| percent | ||||
| N.L. | -0.02 | -0.05 | 0.47 | 0.49 |
| P.E.I. | 0.60 | 0.98 | 0.47 | 0.49 |
| N.S. | 0.39 | 0.49 | 0.47 | 0.49 |
| N.B. | 0.18 | 0.21 | 0.47 | 0.49 |
| Que. | 0.38 | 0.37 | 0.47 | 0.49 |
| Ont. | 0.58 | 0.62 | 0.47 | 0.49 |
| Man. | 0.40 | 0.35 | 0.47 | 0.49 |
| Sask. | 0.37 | 0.33 | 0.47 | 0.49 |
| Alta. | 0.44 | 0.53 | 0.47 | 0.49 |
| B.C. | 0.47 | 0.49 | 0.47 | 0.49 |
| Y.T. | 0.39 | -0.35 | 0.47 | 0.49 |
| N.W.T. | 0.36 | -0.22 | 0.47 | 0.49 |
| Nvt. | 0.59 | 0.66 | 0.47 | 0.49 |
| Source: Statistics Canada, Demography Division. | ||||
International migration is still the main source of population growth in the provinces
In the third quarter of 2018, international migratory increase was the main driver of population growth in all provinces that posted a population gain and in Yukon. More specifically, international migratory increase in the third quarter peaked or was rarely this high everywhere except in the territories.
International migration, along with natural increase, offset interprovincial migratory losses in Prince Edward Island, Quebec, Manitoba, Saskatchewan and British Columbia. In Alberta, population growth was both explained by international migratory increase and natural increase, and to a lesser extent by positive interprovincial migration. International migration also mitigated the effect of a negative natural increase (more deaths than births) in Nova Scotia and New Brunswick.
In this respect, preliminary estimates for the third quarter of 2018 show an albeit small natural decrease for Nova Scotia (-40) and New Brunswick (-28), meaning that there were more deaths than births during the quarter. Natural increase was already negative in the other quarters, but only recently did these two provinces post natural decrease in the third quarter as well. In general, natural increase is highest in the summer because births are often at their highest then and deaths are at their lowest.
In Quebec, Ontario and British Columbia—the three most populous provinces—an increase in the number of non-permanent residents accounted for part of the international migratory increase in the third quarter of 2018. Quebec posted a gain of 12,488 non-permanent residents, the third highest level for any quarter, while Ontario posted a never-before-seen increase (+40,495) for any quarter. This was also the case in British Columbia, with a gain of 15,478 non-permanent residents. The Atlantic provinces (excluding Newfoundland and Labrador) also posted a peak in the number of non-permanent residents.
Nunavut and the Northwest Territories continued to post the highest quarterly rates of natural increase, with 0.5% and 0.2% respectively. Fertility levels in these two territories are among the highest in Canada.Note

Data table for Chart A4
| Provinces and territories | Natural increase | International migratory increase | Interprovincial migratory increase | Population growth |
|---|---|---|---|---|
| rate (%) | ||||
| Canada | 0.10 | 0.39 | 0.00 | 0.49 |
| N.L. | 0.00 | 0.15 | -0.21 | -0.05 |
| P.E.I. | 0.07 | 0.99 | -0.09 | 0.98 |
| N.S. | 0.00 | 0.43 | 0.07 | 0.49 |
| N.B. | 0.00 | 0.32 | -0.10 | 0.21 |
| Que. | 0.09 | 0.30 | -0.02 | 0.37 |
| Ont. | 0.10 | 0.46 | 0.05 | 0.62 |
| Man. | 0.15 | 0.41 | -0.22 | 0.35 |
| Sask. | 0.15 | 0.45 | -0.27 | 0.33 |
| Alta. | 0.20 | 0.26 | 0.07 | 0.53 |
| B.C. | 0.05 | 0.47 | -0.02 | 0.49 |
| Y.T. | 0.09 | 0.20 | -0.64 | -0.35 |
| N.W.T. | 0.20 | 0.04 | -0.45 | -0.22 |
| Nvt. | 0.51 | 0.06 | 0.09 | 0.66 |
| Source: Statistics Canada, Demography Division. | ||||
| Population | Population growth for the third quarter | ||||
|---|---|---|---|---|---|
| 2017 | 2018 | ||||
| number | rate (%) | number | rate (%) | ||
| Canada | 37,242,571 | 172,390 | 0.47 | 183,715 | 0.49 |
| N.L. | 525,073 | -104 | -0.02 | -282 | -0.05 |
| P.E.I. | 154,750 | 911 | 0.60 | 1,506 | 0.98 |
| N.S. | 964,693 | 3,694 | 0.39 | 4,751 | 0.49 |
| N.B. | 772,238 | 1,360 | 0.18 | 1,605 | 0.21 |
| Que. | 8,421,698 | 31,947 | 0.38 | 31,199 | 0.37 |
| Ont. | 14,411,424 | 82,361 | 0.58 | 88,667 | 0.62 |
| Man. | 1,356,836 | 5,380 | 0.40 | 4,682 | 0.35 |
| Sask. | 1,165,903 | 4,252 | 0.37 | 3,841 | 0.33 |
| Alta. | 4,330,206 | 18,647 | 0.44 | 23,096 | 0.53 |
| B.C. | 5,016,322 | 23,407 | 0.47 | 24,635 | 0.49 |
| Y.T. | 40,333 | 153 | 0.39 | -143 | -0.35 |
| N.W.T. | 44,445 | 161 | 0.36 | -96 | -0.22 |
| Nvt. | 38,650 | 221 | 0.59 | 254 | 0.66 |
| Source: Statistics Canada, Demography Division. | |||||
Nova Scotia, Ontario and Alberta gain in their migratory exchanges with the other provinces and territories
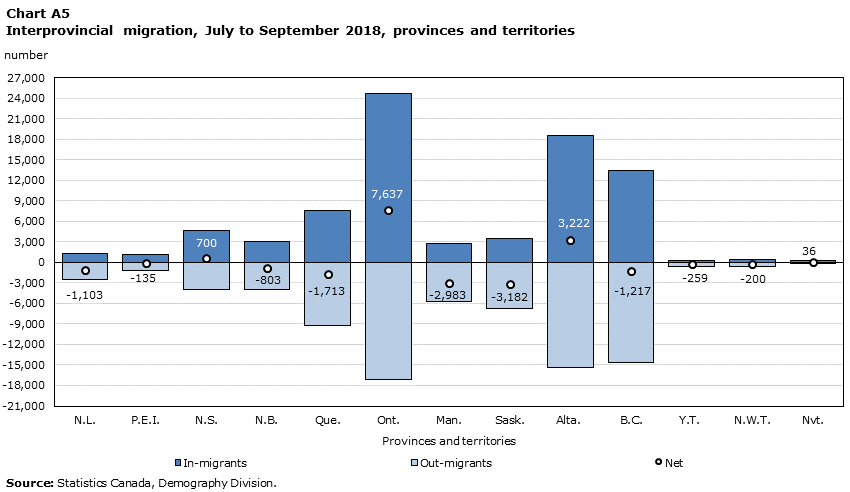
Ontario posted the highest interprovincial migratory increase in absolute numbers among all provinces and territories. Net interprovincial migration in the province was positive (+7,637) for a thirteenth successive quarter, a first since the early 2000s. The province gained in its exchanges with most provinces and territories, in particular Quebec, Manitoba, Saskatchewan and British Columbia.
According to preliminary estimates, Alberta had positive net interprovincial migration (+3,222) for a third consecutive quarter, following 10 consecutive quarters of interprovincial migratory losses. In its exchanges with other provinces and territories, Alberta’s migratory gains came primarily from Saskatchewan, Manitoba and Newfoundland and Labrador. Alberta also benefitted in its migratory exchanges with British Columbia, following 17 consecutive quarters of losses with that province.
In Nova Scotia, net interprovincial migration remained positive (+700) for a twelfth consecutive quarter. The province has never had such a long period of interprovincial gains. Nova Scotia was on the receiving end in its exchanges with several provinces, particularly British Columbia, Ontario, Newfoundland and Labrador and New Brunswick.
British Columbia recorded interprovincial losses (-1,217) in the third quarter of 2018, following 21 consecutive quarters of interprovincial migratory gains. The losses in its exchanges with the other provinces and territories came mainly from Alberta and Ontario.
In Quebec, interprovincial migratory increase remained negative (-1,713). The last time net interprovincial migration was positive in Quebec (+15) was in the fourth quarter of 2009.
The third quarter of 2018 marked ten consecutive quarters of interprovincial migratory losses for Newfoundland and Labrador (-1,103). The last time the province had such a long period of interprovincial migratory deficits was from 1991 to 2007. Migratory losses were especially considerable with Alberta, Ontario and Nova Scotia.
Manitoba (-2,983) posted interprovincial migratory losses, continuing a period of ongoing deficits since the second quarter of 2004. Saskatchewan (-3,182) also recorded interprovincial migratory losses, a downward trend since the third quarter of 2013. Both provinces had more significant outflows to Ontario, Alberta and British Columbia.

Data table for Chart A5
| Provinces and territories | In-migrants | Out-migrants | Net |
|---|---|---|---|
| number | |||
| N.L. | 1,350 | -2,453 | -1,103 |
| P.E.I. | 1,097 | -1,232 | -135 |
| N.S. | 4,644 | -3,944 | 700 |
| N.B. | 3,101 | -3,904 | -803 |
| Que. | 7,521 | -9,234 | -1,713 |
| Ont. | 24,702 | -17,065 | 7,637 |
| Man. | 2,727 | -5,710 | -2,983 |
| Sask. | 3,498 | -6,680 | -3,182 |
| Alta. | 18,581 | -15,359 | 3,222 |
| B.C. | 13,479 | -14,696 | -1,217 |
| Y.T. | 311 | -570 | -259 |
| N.W.T. | 454 | -654 | -200 |
| Nvt. | 260 | -224 | 36 |
| Source: Statistics Canada, Demography Division. | |||
Notes
- Date modified:

