
Quarterly Demographic Estimates
January to March 2018

Archived Content
Information identified as archived is provided for reference, research or recordkeeping purposes. It is not subject to the Government of Canada Web Standards and has not been altered or updated since it was archived. Please "contact us" to request a format other than those available.
Highlights
- Canada's population passed the 37-million people mark in the first quarter of 2018, when its total population was estimated at 37,067,011 on April 1, 2018. It took two years and two months to grow from 36 to 37 million people—the shortest length of time ever observed in the country for an increase of this magnitude since 1972.
- Between January 1 and April 1, 2018, Canada's population grew by 103,157 (+0.3%), the second largest increase in number for a first quarter since 1990.
- In the first quarter of 2018, Canada's population growth was primarily attributable to international migration (+88,120), a level never before seen in a first quarter.
- Population growth was higher in Nunavut (+0.7%), in Ontario and in Alberta (+0.4% each) than in Canada.
- Preliminary population estimates for the last quarter show that Alberta recorded interprovincial migration gains (+1,862) for a third consecutive quarter, following two consecutive years of interprovincial migratory losses.
- Interprovincial migration was positive for the eleventh consecutive quarter in Ontario (+4,024).
Analysis
Canada's population passes the 37-million mark
According to preliminary population estimates, Canada's population was 37,067,011 on April 1, 2018. The population of Canada grew from 36 to 37 million people in only two years and two months. This was the shortest length of time ever seen in Canada for an increase of this magnitude. By comparison, since 1971, Canada's population grew on average by 1 million once every three years and one month.Note 1
The Canadian population increased by 103,157 between January 1 and April 1, 2018. This quarterly increase is the second highest in number (after 2016) for a first quarter since 1990. Moreover, Canada's population growth rate between January 1 and April 1, 2018 was 0.3%.

Data table for Chart A1
| Year | Percent |
|---|---|
| 1998 | 0.17 |
| 1999 | 0.18 |
| 2000 | 0.22 |
| 2001 | 0.28 |
| 2002 | 0.27 |
| 2003 | 0.22 |
| 2004 | 0.22 |
| 2005 | 0.21 |
| 2006 | 0.23 |
| 2007 | 0.21 |
| 2008 | 0.23 |
| 2009 | 0.25 |
| 2010 | 0.24 |
| 2011 | 0.19 |
| 2012 | 0.24 |
| 2013 | 0.24 |
| 2014 | 0.23 |
| 2015 | 0.13 |
| 2016 | 0.29 |
| 2017 | 0.23 |
| 2018 | 0.28 |
| Source: Statistics Canada, Demography Division. | |
International migration continues to account for most of the population growth
Nationally, population growth is based on two factors: natural increaseNote 2 and international migratory increase.Note 3 Provincial and territorial population estimates also factor in interprovincial migratory increase.
International migratory increase has remained the main driver of Canada's population growth, with an estimated increase of 88,120 between January 1 and April 1, 2018, the highest level since 1972.Note 4 In Canada, the growth in the last quarter was mostly stimulated by an increase in the number of immigrants (+79,951). This is the second highest gain for a first quarter, after the first quarter of 2016 (+86,245).Note 5
The country also posted a net increase in the number of non-permanent residents (+22,283) in the first quarter of 2018, also up compared with the average in the past few years. In any first quarter, the increase in the number of non-permanent residents was higher on just two occasions: in 2009 (+23,601) and in 1989 (+36,398). This overall increase was explained by the combined effect of an increase in the number of work permit holders, and to a lesser extent an increase in the number of refugee claimants.Note 6 The components of net emigration (emigration, return emigration and the net temporary emigration) remained stable (-14,114).
According to preliminary estimates, natural increase in the first quarter of 2018 was 15,037, the lowest estimated level for all quarters combined.Note 7 Natural increase is the difference between 93,944 births and 78,907 deaths. The number of births is often higher between July and September (the summer months) in Canada because of seasonal movement. A similar phenomenon is observed for deaths, except that there are more deaths in the first quarter from January to March (during the winter season). In the coming years, the natural increase is expected to decrease, primarily as a result of population aging, which results in a growth of the number of deaths recorded each year.

Data table for Chart A2
| Year | Natural increase | International migratory increase | Population growth |
|---|---|---|---|
| number | |||
| 1998 | 21,687 | 32,449 | 51,674 |
| 1999 | 20,658 | 36,381 | 54,579 |
| 2000 | 23,615 | 47,030 | 68,158 |
| 2001 | 23,364 | 65,652 | 86,555 |
| 2002 | 20,546 | 64,733 | 83,104 |
| 2003 | 20,909 | 51,107 | 69,841 |
| 2004 | 20,531 | 51,112 | 69,445 |
| 2005 | 18,075 | 50,030 | 65,934 |
| 2006 | 24,736 | 53,349 | 75,912 |
| 2007 | 22,941 | 54,104 | 68,582 |
| 2008 | 27,286 | 58,364 | 77,094 |
| 2009 | 27,786 | 65,141 | 84,465 |
| 2010 | 29,194 | 61,556 | 82,289 |
| 2011 | 24,418 | 48,786 | 64,741 |
| 2012 | 27,101 | 57,564 | 84,665 |
| 2013 | 22,702 | 60,303 | 83,005 |
| 2014 | 22,799 | 56,889 | 79,688 |
| 2015 | 19,203 | 25,939 | 45,142 |
| 2016 | 20,363 | 84,147 | 104,510 |
| 2017 | 16,781 | 69,027 | 85,808 |
| 2018 | 15,037 | 88,120 | 103,157 |
|
Note: Before 2012, population growth is not equal to the sum of natural increase and international migratory increase because residual deviation must also be considered in the calculation. Source: Statistics Canada, Demography Division. |
|||
The population is growing everywhere except in Newfoundland and Labrador
The population grewNote 8 in all provinces and territories in the first quarter of 2018, except in Newfoundland and Labrador (-0.3%). Nunavut (+0.7%), Ontario and Alberta (+0.4% each) had higher population growth rates than Canada's (+0.3%).
Compared with the same period last year, an increase in the population growth rate was observed in Ontario, Alberta, Yukon and Nunavut (Chart A3). The data also show a shift in the growth rate in New Brunswick from zero to positive.
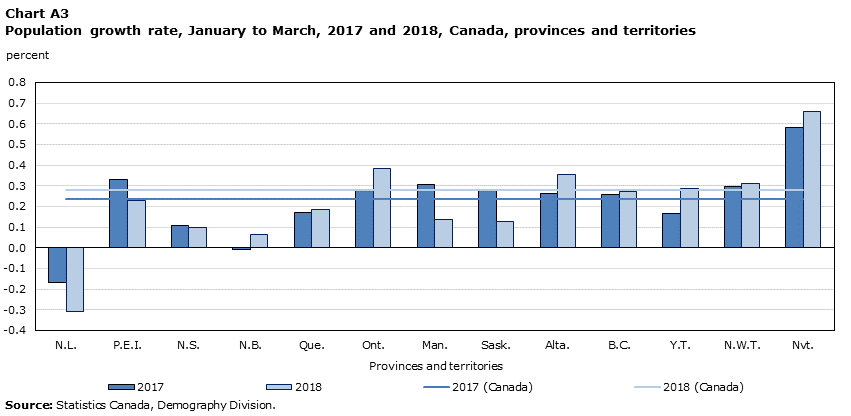
Data table for Chart A3
| Provinces and territories | 2017 | 2018 | 2017 (Canada) | 2018 (Canada) |
|---|---|---|---|---|
| percent | ||||
| Newfoundland and Labrador | -0.17 | -0.31 | 0.23 | 0.28 |
| Prince Edward Island | 0.33 | 0.23 | 0.23 | 0.28 |
| Nova Scotia | 0.11 | 0.10 | 0.23 | 0.28 |
| New Brunswick | -0.01 | 0.06 | 0.23 | 0.28 |
| Quebec | 0.17 | 0.18 | 0.23 | 0.28 |
| Ontario | 0.28 | 0.39 | 0.23 | 0.28 |
| Manitoba | 0.31 | 0.13 | 0.23 | 0.28 |
| Saskatchewan | 0.28 | 0.13 | 0.23 | 0.28 |
| Alberta | 0.26 | 0.35 | 0.23 | 0.28 |
| British Columbia | 0.26 | 0.27 | 0.23 | 0.28 |
| Yukon | 0.17 | 0.29 | 0.23 | 0.28 |
| Northwest Territories | 0.30 | 0.31 | 0.23 | 0.28 |
| Nunavut | 0.58 | 0.66 | 0.23 | 0.28 |
| Source: Statistics Canada, Demography Division. | ||||
International migration is the main source of population growth for most provinces
In the first quarter of 2018, international migratory increase was the main driver of population growth in almost all provinces that posted a population gain and in Yukon. International migratory increase in the first quarter peaked in Quebec and has rarely been this high in the Atlantic provinces (except in Newfoundland and Labrador), in Ontario and in the Northwest Territories. Furthermore, international migration offset interprovincial migratory losses in Prince Edward Island, Quebec, Manitoba, Saskatchewan and the Northwest Territories. It also compensated for negative natural increase (more deaths than births) in the Atlantic provinces (except in Newfoundland and Labrador).
In Alberta, natural increase and international migratory increase each accounted for 44% of the population growth, with positive interprovincial migration accounting for the rest. Nunavut and the Northwest Territories continued to post the highest rates of natural increase, with 0.4% and 0.3% respectively. Fertility levels in these two territories are among the highest in Canada.Note 9
In Quebec, Ontario and British Columbia, an increase in the number of non-permanent residents accounted for part of the international migratory increases. Quebec posted a gain of 7,051 non-permanent residents, a level never before seen for a first quarter.Note 10 In Ontario, the estimated 15,662 non-permanent residents level was the second highest level observed for a first quarter, after 1989 (+25,678). Lastly, British Columbia posted a gain of 3,577 non-permanent residents, a level rarely reached in the past.
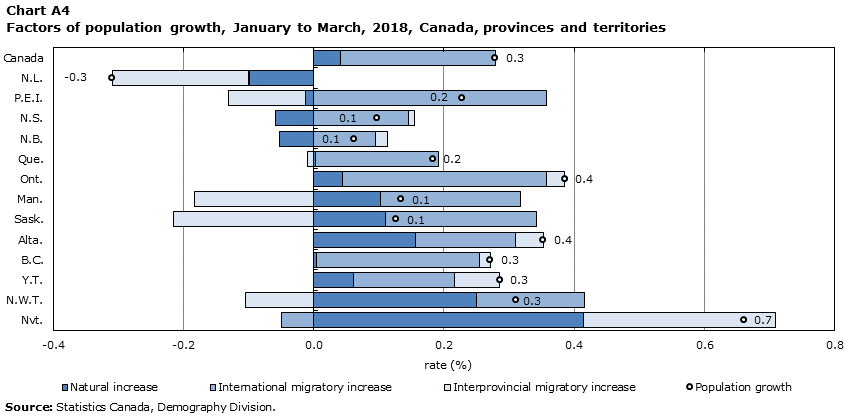
Data table for Chart A4
| Provinces and territories | Natural increase | International migratory increase | Interprovincial migratory increase | Population growth |
|---|---|---|---|---|
| rate (percent) | ||||
| Canada | 0.04 | 0.24 | 0.00 | 0.28 |
| Newfoundland and Labrador | -0.10 | 0.00 | -0.21 | -0.31 |
| Prince Edward Island | -0.01 | 0.36 | -0.12 | 0.23 |
| Nova Scotia | -0.06 | 0.15 | 0.01 | 0.10 |
| New Brunswick | -0.05 | 0.09 | 0.02 | 0.06 |
| Quebec | 0.00 | 0.19 | -0.01 | 0.18 |
| Ontario | 0.04 | 0.31 | 0.03 | 0.39 |
| Manitoba | 0.10 | 0.22 | -0.18 | 0.13 |
| Saskatchewan | 0.11 | 0.23 | -0.22 | 0.13 |
| Alberta | 0.16 | 0.15 | 0.04 | 0.35 |
| British Columbia | 0.00 | 0.25 | 0.02 | 0.27 |
| Yukon | 0.06 | 0.15 | 0.07 | 0.29 |
| Northwest Territories | 0.25 | 0.17 | -0.11 | 0.31 |
| Nunavut | 0.41 | -0.05 | 0.29 | 0.66 |
| Source: Statistics Canada, Demography Division. | ||||
| Population | Population growth for the first quarter | ||||
|---|---|---|---|---|---|
| 2017 | 2018 | ||||
| number | rate (%) | number | rate (%) | ||
| Canada | 37,067,011 | 85,808 | 0.23 | 103,157 | 0.28 |
| Newfoundland and Labrador | 525,983 | -893 | -0.17 | -1,630 | -0.31 |
| Prince Edward Island | 153,116 | 498 | 0.33 | 348 | 0.23 |
| Nova Scotia | 958,400 | 1,026 | 0.11 | 930 | 0.10 |
| New Brunswick | 761,214 | -50 | -0.01 | 470 | 0.06 |
| Quebec | 8,455,402 | 14,308 | 0.17 | 15,477 | 0.18 |
| Ontario | 14,374,084 | 39,508 | 0.28 | 55,334 | 0.39 |
| Manitoba | 1,348,809 | 4,077 | 0.31 | 1,816 | 0.13 |
| Saskatchewan | 1,171,240 | 3,207 | 0.28 | 1,488 | 0.13 |
| Alberta | 4,334,025 | 11,282 | 0.26 | 15,253 | 0.35 |
| British Columbia | 4,862,610 | 12,430 | 0.26 | 13,168 | 0.27 |
| Yukon | 38,936 | 64 | 0.17 | 111 | 0.29 |
| Northwest Territories | 44,736 | 132 | 0.30 | 139 | 0.31 |
| Nunavut | 38,456 | 219 | 0.58 | 253 | 0.66 |
| Source: Statistics Canada, Demography Division. | |||||
Ontario, Alberta and British Columbia gain in their migratory exchanges with the other provinces and territories
According to preliminary population estimates, Alberta had positive net interprovincial migration (+1,862) for a third consecutive quarter, following two consecutive years of interprovincial migration losses (not shown). In its exchanges with the other provinces and territories, Alberta's migratory gains came primarily from Saskatchewan, Manitoba, Nova Scotia and Newfoundland and Labrador. These gains were partially offset by migratory losses to Ontario and Quebec.
In Ontario, net interprovincial migration was positive (+4,024) for an eleventh successive quarter, a first since the early 2000s. Ontario continued to post the highest interprovincial migratory increase in absolute numbers, with migrants coming from most provinces and territories, particularly from Quebec, the Prairie provinces and British Columbia.
British Columbia placed third in terms of the strongest interprovincial gains (+796), pursuing a five-year trend of uninterrupted gains in interprovincial migration. In the first quarter of 2018, interprovincial migrants in British Columbia came primarily from Saskatchewan, Manitoba and Newfoundland and Labrador.
In Nova Scotia, net interprovincial migration remained positive (+90), while modest, for a fifth consecutive quarter, which has not been seen since 1985. These interprovincial gains came at the expense of New Brunswick and Newfoundland and Labrador.
In Quebec, interprovincial migration remained negative (-740), although smaller than usual for a first quarter for a second year in a row (-1,836 on average in the first quarter between 2006 and 2016). All quarters combined, the last time net interprovincial migration was greater than zero in Quebec (+15) was in the fourth quarter of 2009.
The first quarter of 2018 (-1,107) marked two consecutive years of interprovincial migratory losses for Newfoundland and Labrador. The last time the province had such a long period of quarterly deficits was in 1991-2007. The following quarters were rather positive until the beginning of 2016. Migratory losses were especially notable in Alberta, following several quarters in which they had subsided.
Manitoba (-2,458) also saw its largest interprovincial migratory losses for a first quarter since 1972, and Saskatchewan (-2,526) had its lowest quarter since 1990. Both provinces had significant outflows to Ontario, Alberta and British Columbia.

Data table for Chart A5
| Provinces and territories | In-migrants | Out-migrants | Net |
|---|---|---|---|
| number | |||
| Newfoundland and Labrador | 1,484 | -2,591 | -1,107 |
| Prince Edward Island | 778 | -957 | -179 |
| Nova Scotia | 3,956 | -3,866 | 90 |
| New Brunswick | 3,110 | -2,965 | 145 |
| Quebec | 5,571 | -6,311 | -740 |
| Ontario | 18,974 | -14,950 | 4,024 |
| Manitoba | 2,516 | -4,974 | -2,458 |
| Saskatchewan | 3,701 | -6,227 | -2,526 |
| Alberta | 17,065 | -15,203 | 1,862 |
| British Columbia | 12,862 | -12,066 | 796 |
| Yukon | 463 | -436 | 27 |
| Northwest Territories | 572 | -619 | -47 |
| Nunavut | 411 | -298 | 113 |
| Source: Statistics Canada, Demography Division. | |||
Notes
- Date modified: