
First Nations People, Métis and Inuit in Canada: Diverse and Growing Populations
Correction notice
In the description for Chart 8 in the HTML, there were data errors for the categories ‘Trades certificate (non-apprenticeship)’, ‘Apprenticeship certificate’, ‘College diploma’ and ‘Bachelor's degree or higher’. The errors were corrected March 26, 2018.
Skip to text
Text begins
Population
First Nations people, Métis and Inuit make up an increasingly large share of the population
In 2016, there were 1,673,785 Indigenous people in Canada, accounting for 4.9% of the total population. This was up from 3.8% in 2006 and 2.8% in 1996.
The First Nations, Métis and Inuit populations are growing quickly.
Since 2006, the Indigenous population grew by 42.5%, which is more than four times faster than the rest of the population.
The First Nations population— including both those who are registered or treaty Indians under the Indian Act and those who are not—grew by 39.3% from 2006 to reach 977,230 people in 2016.
The Métis population (587,545) had the largest increase of any of the groups over the 10-year span, rising 51.2% from 2006 to 2016.
The Inuit population (65,025) grew by 29.1% from 2006 to 2016.
In the next two decades, the Indigenous population is likely to exceed 2.5 million persons.
Data table for Chart 1
| 2011 | Projected 2036 | |
|---|---|---|
| percent | ||
| Indigenous people |
4.4 | 5.8 |
| First Nations people | 2.7 | 3.5 |
| Métis | 1.4 | 2.0 |
| Inuit | 0.2 | 0.2 |
| Source: Statistics Canada. 2015. Projections of the Aboriginal Population and Households in Canada, 2011 to 2036. Statistics Canada Catalogue no. 91-552-X. | ||
The number of young Indigenous people is growing
From 2006 to 2016, the number of First Nations, Métis and Inuit youth aged 15 to 34 increased by 39%, compared to just over 6% for their non-Indigenous youth.
Data table for Chart 2
| Percent | |
|---|---|
| First Nations | 40.1 |
| Métis | 41.5 |
| Inuit | 24.5 |
| Non- Indigenous |
6.5 |
| Sources: Statistics Canada, Census of Population, 2006 to 2016. | |
Behind the growth
Two main factors have contributed to the growing Indigenous population: the first is natural growth, which includes increased life expectancy and relatively high fertility rates; the second factor relates to changes in self-reported identification. Put simply, more people are newly identifying as First Nations, Métis or Inuit on the census—a continuation of a trend over time.
While the Indigenous population is young, it is also aging
In 2006, 4.8% of the Indigenous population was 65 years of age or older; by 2016, this proportion had risen to 7.3%. Seniors will make up a larger share of the First Nations, Métis and Inuit populations over the coming years.
The Indigenous population is on average, nearly a decade younger than the rest of the population in Canada
The Inuit are the youngest of the three groups, with an average age of 27.7 years, followed by First Nations people (30.6 years) and Métis (34.7 years).
“Aboriginal identity” refers to whether a person identified with the Aboriginal peoples of Canada. This includes those who are First Nations (North American Indian), Métis or Inuk (Inuit) and/or those who are Registered or Treaty Indians (that is, registered under the Indian Act of Canada), and/or those who have membership in a First Nation or Indian band.
Is this person an Aboriginal person, that is, First Nations (North American Indian), Métis or Inuk (Inuit)?
- No, not an Aboriginal person.
- Yes, First Nations (North American Indian).
- Yes, Métis.
- Yes, Inuk (Inuit).
In this document, the term “Indigenous” is used in place of “Aboriginal”.
Increasing participation of First Nations communities
First Nations communities recognize the importance of data for community planning and development. Data from the census are an important source of information as it provides a comprehensive picture of the characteristics of the people in the community – their age, family characteristics, housing, education, labour and language. The 2016 Census had the highest number of participating reserves, with only 14 reserves that were not enumerated of a total of 984. This represents a significant change from 1986, when 136 reserves were incompletely enumerated.
Data table for Chart 3
| Census year | Number |
|---|---|
| 1986 | 136 |
| 1991 | 78 |
| 1996 | 77 |
| 2001 | 30 |
| 2006 | 22 |
| 2011 | 18 |
| 2016 | 14 |
|
Sources: Statistics Canada, Census of Population, 1986 to 2016. |
|
Languages
There were more than 70 Indigenous languages reported on the 2016 Census
Of these, there were 36 languages that had at least 500 speakers. The most widely spoken Indigenous languages were Cree, Inuktitut and Ojibway.
Data table for Chart 4
| Mother tongue | Language spoken at home | |
|---|---|---|
| number of people | ||
| Cree languages | 78,025 | 83,960 |
| Inuktitut | 36,185 | 39,030 |
| Ojibway | 20,470 | 21,805 |
| Oji-Cree | 13,635 | 13,855 |
| Dene | 11,320 | 11,785 |
| Source: Statistics Canada, Census of Population, 2016. | ||

Image description
This is an oval word art image within a rectangle that contains the list of Indigenous languages based on the 36 most widely spoken with at least 500 speakers in 2016:
- Cree
- Inuktitut
- Ojibway
- Oji-Cree
- Dene
- Montagnais (Innu)
- Mi'kmaq
- Atikamekw
- Plains Cree
- Blackfoot
- Stoney
- Woods Cree
- Dogrib (Tlicho)
- Algonquin
- Swampy Cree
- Mohawk
- Carrier
- Dakota
- South Slavey
- Naskapi
- Inuinnaqtun
- Gitxsan (Gitksan)
- North Slavey (Hare)
- Inuvialuktun
- Chilcotin
- Halkomelem
- Michif
- Shuswap (Secwepemctsin)
- Nisga'a
- Kwakiutl (Kwak'wala)
- Lillooet
- Northern East Cree
- Malecite
- Nuu-chah-nulth (Nootka)
- Slavey
- Okanagan
The number of Indigenous people who could speak an Indigenous language grew by 3.1% in the last ten years
Status First Nations people—particularly those living on reserve—were more likely to be able to speak an Indigenous language. Among Inuit, those living in Inuit Nunangat were more likely to be able to speak an Inuit language than those living outside.
Among all three groups, the number of people who could speak an Indigenous language was greater than the number with an Indigenous mother tongue
This suggests that many people, especially young people, are learning Indigenous languages as second languages.
Living arrangements
Indigenous children live in a variety of family settings, such as multigenerational households, where parents and grandparents are present
About one in six (17.9%) Indigenous children aged 0 to 4 shared a household with at least one grandparent, compared with 9.5% of non-Indigenous children.
Half of children in foster care are Indigenous children
In 2016, there were 4,300 Indigenous children aged 0 to 4 reported as foster children living in private homes. Although Indigenous children accounted for 7.7% of all children aged 0 to 4, they accounted for more than one-half (51.2%) of all foster children in this age group.
One in five Indigenous people lived in a dwelling that was in need of major repairs in 2016
One-quarter (26.2%) of Inuit, 24.2% of First Nations people and 11.3% of Métis lived in a dwelling that was in need of major repairs. These rates were highest for Inuit living in Inuit Nunangat (31.5%) and Status First Nations people living on reserve (44.2%). The proportion of First Nations people with Registered or Treaty Indian status who lived in a dwelling that needed major repairs was more than three times higher on reserve than off reserve (14.2%). In comparison, 6.0% of the non-Indigenous population reported living in a dwelling in need of major repairs.

Data table for Chart 5
| Percent | |
|---|---|
| First Nations | 24.2 |
| Métis | 11.3 |
| Inuit | 26.2 |
| Non-Indigenous | 6.0 |
| Source: Statistics Canada, Census of Population, 2016. | |
Close to one-fifth (18.3%) of the Indigenous population lived in crowded housing
A lower proportion of the non-Indigenous population lived in housing that was crowded (8.5%).
“Crowded housing” is categorized into dwellings that have a one-bedroom shortfall, a two-bedroom shortfall or a shortfall of three or more bedrooms. Therefore a house with a one-bedroom shortfall would require a single extra bedroom in order to adequately house the number of people who live there.
Education, labour and earnings
High school completion rates are on the rise
From 2006 to 2016, the share of First Nations people, Métis and Inuit who had completed high school went up by roughly 10 percentage points.

Data table for Chart 6
| 2006 | 2016 | |
|---|---|---|
| percent | ||
| First Nations | 54.1 | 64.0 |
| Métis | 66.8 | 77.4 |
| Inuit | 35.9 | 45.4 |
| Sources: Statistics Canada, Census of Population, 2006 and 2016. | ||
First Nations people, Métis and Inuit aged 25 to 64 all made gains in postsecondary education at every level
Among all Indigenous identity groups, the most common postsecondary qualification for those aged 25 to 64 was college. In 2016, the percentage of First Nations people with a college diploma increased to 21% from 17%. Among the Metis, one in four had completed a college diploma in 2016, compared with one in five in 2006. Among the Inuit, the percentage with a college diploma increased from about 17% to almost 19%.
Data table for Chart 7
| 2006 | 2016 | ||
|---|---|---|---|
| percent | |||
| First Nations people | Bachelor's degree or higherData table Note 3 | 7.2 | 9.6 |
| College diploma | 17.3 | 21.4 | |
| Apprenticeship certificateData table Note 2 | 3.6 | 4.7 | |
| High school diploma | 20.1 | 24.5 | |
| No certificate, diploma or degree | 38.2 | 30.0 | |
| Métis | Bachelor's degree or higherData table Note 3 | 8.9 | 13.2 |
| College diploma | 21.1 | 25.6 | |
| Apprenticeship certificateData table Note 2 | 5.4 | 6.9 | |
| High school diploma | 24.3 | 26.5 | |
| No certificate, diploma or degree | 26.1 | 18.0 | |
| Inuit |
Bachelor's degree or higherData table Note 3 | 3.9 | 5.3 |
| College diploma | 16.9 | 18.7 | |
| Apprenticeship certificateData table Note 2 | 3.6 | 5.0 | |
| High school diploma | 13.0 | 18.5 | |
| No certificate, diploma or degree | 50.8 | 43.9 | |
|
|||
Higher education for Indigenous people leads to better chances of employment
In 2016, employment rates were above 80% for degree holders among each of these groups, and among Métis with college diplomas or apprenticeship certificates. Employment rates were about 75% among First Nations people living off reserve who had college diplomas or apprenticeship certificates.
Data table for Chart 8
| First Nations | Métis | Inuit | ||
|---|---|---|---|---|
| On reserve | Off reserve | |||
| percent | ||||
| No certificate, diploma or degree | 31.3 | 40.3 | 51.1 | 44.3 |
| High school diploma or equivalency certificate | 47.7 | 62.5 | 71.9 | 63.5 |
| Trades certificate (non-apprenticeship) | 55.3 | 66.8 | 73.8 | 65.7 |
| Apprenticeship certificate | 59.1 | 75.0 | 81.3 | 68.4 |
| College diploma | 66.0 | 74.6 | 81.5 | 70.8 |
| Bachelor's degree or higher | 81.3 | 85.3 | 88.0 | 83.6 |
| Source: Statistics Canada, Census of Population, 2016. | ||||
Earnings were much higher among First Nations, Métis and Inuit women with at least a bachelor’s degree than among those with lower levels of education.
First Nations, Métis and Inuit men with at least a bachelor’s degree had higher earnings than those with lower levels of education. However, Métis men with an apprenticeship certificate had earnings almost as high as Métis men with at least a bachelor’s degree.

Data table for Chart 9
| Women | Men | |||||
|---|---|---|---|---|---|---|
| First Nations | Métis | Inuit | First Nations |
Métis | Inuit | |
| dollars | ||||||
| No certificate, diploma or degree | 29,733 | 32,066 | 42,127 | 39,175 | 49,870 | 46,163 |
| High school diploma or equivalency certificate | 36,619 | 42,046 | 57,152 | 46,965 | 54,971 | 61,474 |
| Trades certificate (non-apprenticeship) | 34,105 | 37,778 | 47,846 | 48,551 | 56,287 | 60,349 |
| Apprenticeship certificate | 33,202 | 38,853 | 45,083 | 62,718 | 77,608 | 76,567 |
| College diploma | 42,861 | 47,232 | 66,724 | 58,348 | 68,665 | 78,630 |
| Bachelorʼs degree or higher | 64,410 | 70,400 | 90,881 | 75,090 | 81,796 | 90,925 |
| Source: Statistics Canada, Census of Population, 2016. | ||||||
In spite of the gains in educational qualifications, the employment rates of Indigenous people did not increase between 2006 and 2016
Data table for Chart 10
| 2006 | 2016 | |
|---|---|---|
| percent | ||
| First Nations people living on reserve |
51.3 | 48.2 |
| First Nations people living off reserve |
61.5 | 61.5 |
| Métis | 70.4 | 72.4 |
| Inuit living inside Inuit Nunangat | 60.2 | 58.0 |
| Inuit living outside Inuit Nunangat | 63.8 | 60.3 |
| Sources: Statistics Canada, Census of Population, 2006 and 2016. | ||
Data table for Chart 11
| 2006 | 2016 | |
|---|---|---|
| percent | ||
| First Nations people living on reserve |
51.7 | 45.8 |
| First Nations people living off reserve |
72.1 | 67.9 |
| Métis | 79.4 | 76.9 |
| Inuit living inside Inuit Nunangat | 59.1 | 53.8 |
| Inuit living outside Inuit Nunangat | 70.4 | 67.6 |
| Sources: Statistics Canada, Census of Population, 2006 and 2016. | ||
Staying relevant – The 2021 Census
In light of changing terminology, recent court decisions and the Government’s renewed commitment to Indigenous people, Statistics Canada is actively seeking feedback from First Nations, Métis and Inuit governments, organizations and individuals on the concepts and categories used in the census as well as what data they need.
In September 2017, Statistics Canada initiated a broad series of dialogues with First Nations, Métis and Inuit organizations and communities in every province and territory, about the content of the 2021 Census and their data needs.
To date, there have been over 50 discussions in 36 locations with roughly 400 participants, including representatives of federal departments. We have heard a wide-variety of viewpoints.
- How people describe their identity will depend on their age, where they live, and their cultural background. For example, some would still use the term “Indian” to describe themselves.
- The current categories (First Nations [Status and non-Status], Métis and Inuk) do not cover the complexities of modern treaties.
- “Indigenous,” although increasingly mainstream, is not universally accepted. A distinctions-based approach is preferred.
- The data from the census are very important to communities and organizations and the way we describe the population should allow us to identify those who are most in need of programs and services.
A report summarizing what we heard will be published in the fall of 2018.
Health
Indigenous youth are particularly at risk for poor mental health
Just over one in ten (11.0%) of off-reserve First Nations youth and 7.8% of Métis youth report having a mood disorder. Rates of acute-care hospitalizations for intentional self-harm are high among Indigenous youth aged 10 to 19.
- 42 per 100,000 for First Nations youth living on reserve
- 26 per 100,000 for First Nations youth living off reserve
- 20 per 100,000 for Métis youth
- 101 per 100,000 for Inuit youth living in Inuit Nunangat

Developing capacity in Nunavut
Collecting data in the North presents unique challenges because of the remoteness of the communities and the weather. The Nunavut Inuit Labour Force Analysis (NILFA), a supplement to the Aboriginal Peoples Survey, 2017 included more than 7,700 Inuit, aged 15 years and older, across 25 communities in Nunavut. Statistics Canada developed an Inuit hiring strategy that increased Statistics Canada’s capacity in terms of staffing in Nunavut. The strategy also generated a series of recommendations for future hiring in Nunavut.
Statistics Canada built partnerships with Nunavut Tunngavik Inc., the Government of Nunavut, Pilimmaksaivik, Indigenous Services, Crown–Indigenous Relations and Northern Affairs, and Employment and Social Development Canada in order to transform a standard government recruitment process into one that was engaging, responsive to the unique challenges of the North, culturally sensitive and, ultimately, removed barriers to employment. By focusing on the strengths of prospective Inuit employees, more than 130 territorial residents were hired (accounting for 78% of the data collection team) across all 25 communities.
First Nations people, Métis and Inuit are less likely than non-Indigenous people to report very good or excellent health
Half of First Nations people living off reserve report themselves in very good or excellent health. First Nations people and Métis were more likely to report a chronic condition. In the three Indigenous groups, smoking and obesity rates were higher than the non-Indigenous population.
Data table for Chart 12
| First Nations off reserve | Métis | Inuit | Non-Indigenous | |
|---|---|---|---|---|
| percent | ||||
| Health | 50 | 54 | 55 | 63 |
| Mental health | 66 | 67 | 65 | 75 |
|
Sources: Statistics Canada, Canadian Community Health Survey, 2007 to 2010. |
||||
Food insecurity is higher among Indigenous people, particularly Inuit
About 20% of Indigenous people aged 15 and over experienced food insecurity in the past 12 months. Among the Inuit living in Inuit Nunangat, 52% of adults experienced food insecurity.
Adding Value to the Aboriginal Peoples Survey
“Building sustainable futures” was the motto of the 2017 Aboriginal Peoples Survey (APS) that focused on the economic participation of off-reserve First Nations people, Métis and Inuit. The survey was conducted between January and August 2017. Results will be available in the fall, 2018, that will examine barriers and levers to economic participation, labour mobility, entrepreneurship, skills training and financial well-being.
Findings from past cycles of the APS continues to be used and can tell powerful stories when linked with administrative data. Here are some of the previous findings:
- More than half of Métis aged 45 or older reported strong family networks. Those with strong family networks were generally more likely to report positive health.
- A positive school environment is associated with positive mental health outcomes for off-reserve First Nations youth.
- Indigenous foster children were reported to have poorer educational performance (less likely to have A's and more likely to have repeated a grade) than other children, but were also less likely to have missed school in the past two weeks and were more likely to be receiving tutoring.
- Child care and family responsibilities were most often cited by Inuit women as reasons for leaving high school or postsecondary programs.
Justice
Victimization rates are higher among Indigenous women
Indigenous women are almost three times as likely as non-Indigenous women to be a victim of violent crime.
Data table for Chart 13
| Women | Men | |
|---|---|---|
| rate | ||
| Indigenous | 220 | 110 |
| Non-Indigenous | 81 | 66 |
| Source: Statistics Canada, General Social Survey on Victimization, 2014. | ||
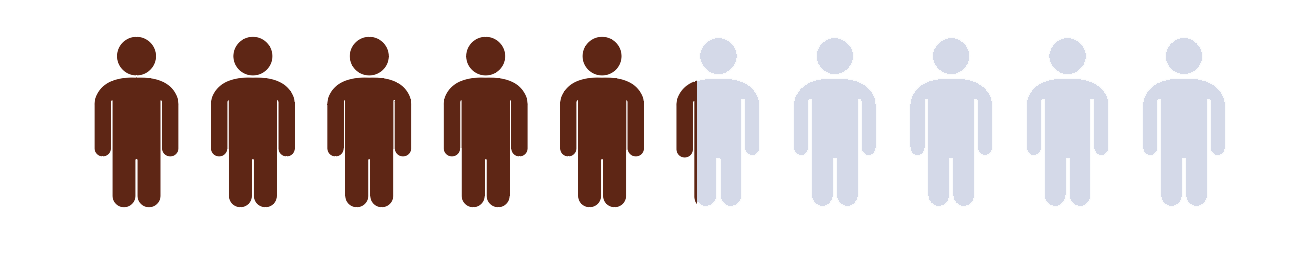
Indigenous men and boys are seven times more likely than non-Indigenous men and boys to be a homicide victim
In 2015, Indigenous people accounted for 25% of all homicide victims in Canada. Indigenous people represented an estimated 5% of the Canadian population in 2015.
Indigenous people also had a lower level of confidence in the justice system
In 2013, 43% of Indigenous people had confidence in the justice system and the courts, compared with 58% of non-Indigenous people.
Data gaps
The data portrait of First Nations people, Métis, Inuit and their communities and businesses is not as comprehensive as it is for the general population. Our key sources of information on First Nations people, Métis and Inuit are collected every five years. Many would like to have information collected more frequently and there are still some populations that are not well covered. These groups include:
- First Nations communities
- Indigenous businesses and entrepreneurs
- Children
- People living in institutions, such as hospitals, shelters and senior’s residences
- Those temporarily living away from home for health or other services
As part of its modernization initiative, Statistics Canada, in partnership with organizations such as Indigenous Services, Crown-Indigenous Relations and Northern Affairs and Indigenous organizations, is striving to find new analytical methods, such as data modelling, which would leverage the power of the information we gather. Innovative approaches to gathering data and data development depend on the effective use of administrative data sources. New analytical opportunities are opened up when these are combined with the Census.
Building partnerships
Meaningful engagement and relationship building are highly valued in Indigenous cultures and are therefore major priorities for Statistics Canada. Through the Aboriginal Liaison Program, we have been strengthening lines of communication between Statistics Canada and First Nations people, Métis and Inuit, their organizations and leadership over the past several decades. The Aboriginal Liaison Advisor program started in the 1980s with one advisor working in Alberta and has grown to a network of eleven positions across the country.
The advisors work with communities and organizations to increase the understanding of, and access to, Statistics Canada data products and services, as well as promote the use of these data sources for decision-making and community-planning activities. They also help build the statistical capacity of First Nations, Métis and Inuit organizations and people.
Renewing relationship with Indigenous peoples
Statistics Canada is committed to strengthening or renewing partnerships with Indigenous organizations, institutions, and communities, and in collaboration with other governments.
Statistics Canada is planning to support initiatives that will provide opportunities for more meaningful service delivery in statistical capacity building and will be grounded in the needs of First Nations people, Métis and Inuit, through a distinction-based approach.
Supporting Indigenous-led statistical capacity building is an important aspect of self-determination and instrumental for Indigenous leadership and governments in planning, delivery, and reporting to their own citizens.
References
Arriagada, P. 2017. “Food insecurity among Inuit living in Inuit Nunangat.” Insights on Canadian Society. Statistics Canada Catalogue no.75-006-X.
Canadian Institute for Health Information, Discharge Abstract Database, 2006-2009.
Mulligan, L., Axford, M. and Solecki, A. 2016. “Homicide in Canada, 2015.” Juristat. Statistics Canada Catalogue no. 85-002-X.
Statistics Canada. 2015. Projections of the Aboriginal Population and Households in Canada, 2011 to 2036. Statistics Canada Catalogue no. 91-552-X.
Statistics Canada, Aboriginal Peoples Survey, 2012.
Statistics Canada, Canadian Community Health Survey, 2007-2014.
Statistics Canada, Census of Population, 1986 to 2016.
Statistics Canada, General Social Survey on Victimization, 2014.
- Date modified: