
Ethnicity, Language and Immigration Thematic Series
Maps and key facts on participation in regular French programs in Canada outside Quebec, 2021
Skip to text
Text begins
The author would like to thank his colleagues in Statistics Canada’s Language Statistics Program for their support and invaluable comments throughout the development of this booklet. Special thanks go to Dominique Pépin-Filion, Éric Caron-Malenfant, Foungatrigue-Siramane Coulibaly, Nicolas Auclair and Daniel Vadnais.
In 2021, for the very first time in a census, information was collected on instruction in the minority official language at the primary and secondary levels (i.e., English in Quebec and French in Canada outside Quebec). According to the 2021 Census results, 452,110 school-agedNote children were eligible for instruction in French in Canada outside Quebec, 65% of whom participated or had participated in a regular French program at a French-language elementary or secondary school in Canada.Note
The number of children eligible for instruction in French and the proportion who attended a French-language school varied within the same region, province or territory. Whether or not eligible children attended a minority language school reflected parents’ choices about schools, which may have been related to factors beyond the choice of language of instruction, such as the proximity of schoolsNote and the quality of programs.Note
This booklet presents the municipalitiesNote where eligible school-aged children were living and the respective proportions of eligible children who were attending or had attended a French-language school. It comprises a series of provincial, territorial and regional maps of Canada outside Quebec, with highlights on the municipalities in question. These maps will inform parents, school authorities and other decision makers in education about the municipalities where instruction in the minority official language could be developed, expanded or made more accessible.
The 2021 Census results are but one component of the data ecosystem on instruction in the minority official language and on children eligible for instruction in that language. To learn more about the concepts used in this booklet, see the “Concepts and definitions” box and the Instruction in the Minority Official Language Reference Guide, Census of Population, 2021.
Atlantic provinces
Description for Map 1
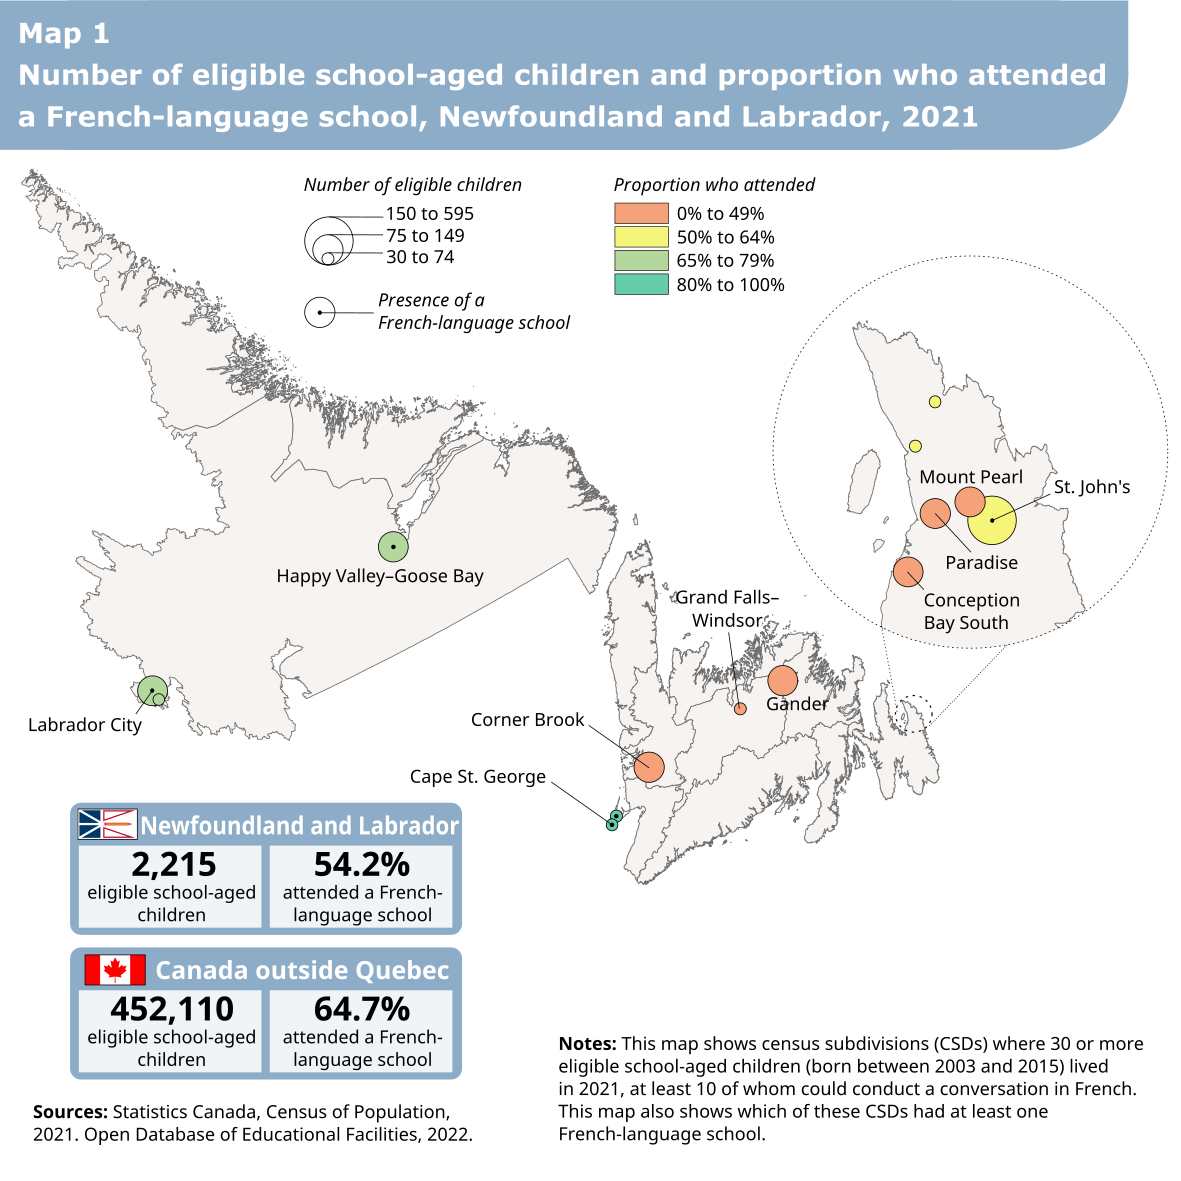
This map shows the number of school-aged children eligible for instruction in French and the proportion of these children who were attending or had attended a French-language school in Canada, in Newfoundland and Labrador’s 14 census subdivisions (CSDs) where 30 or more eligible school-aged children lived in 2021, at least 10 of whom could conduct a conversation in French.
There are two boxes on the map. The first box shows that there were 2,215 eligible school-aged children in Newfoundland and Labrador, 54.2% of whom had attended a French-language school. The second box shows that in Canada outside Quebec, there were 452,110 eligible school-aged children, 64.7% of whom had attended a French-language school.
On the map, the CSDs are represented by circles whose size corresponds to the number of eligible school-aged children. The colour of the circles represents the proportion of eligible children who were attending or had attended a French-language school in Canada. Of these CSDs, the ones with at least one French-language school are represented by a dot.
In 1 CSD, 30 to 74 children were eligible, and 0% to 49% had attended a French-language school. There were no French-language schools in this CSD.
In 2 CSDs, 30 to 74 children were eligible, and 50% to 64% had attended a French-language school. There were no French-language schools in these CSDs.
In 1 CSD, 30 to 74 children were eligible, and 65% to 79% had attended a French-language school. There were no French-language schools in this CSD.
In 2 CSDs, 30 to 74 children were eligible, and 80% to 100% had attended a French-language school. There was at least 1 French-language school in each of these 2 CSDs.
In 5 CSDs, 75 to 149 children were eligible, and 0% to 49% had attended a French-language school. There were no French-language schools in these CSDs.
In 2 CSDs, 75 to 149 children were eligible, and 65% to 79% had attended a French-language school. There was at least 1 French-language school in each of these 2 CSDs.
In 1 CSD, 150 to 595 children were eligible, and 50% to 64% had attended a French-language school. There was at least 1 French-language school in this CSD.
The size and colour of the circles were determined using the values from the table below.
| Census subdivision | Children eligible for instruction in French | Eligible children who attended a French-language school | French-language schools |
|---|---|---|---|
| Code | Number | Percentage | Number |
| 1001519 | 595 | 58 | 1 or more |
| 1001517 | 130 | 42.3 | 0 |
| 1001485 | 115 | 47.8 | 0 |
| 1010025 | 95 | 78.9 | 1 or more |
| 1001542 | 85 | 47.1 | 0 |
| 1005018 | 75 | 40 | 0 |
| 1006009 | 75 | 40 | 0 |
| 1010032 | 75 | 66.7 | 1 or more |
| 1001504 | 60 | 50 | 0 |
| 1006017 | 60 | 41.7 | 0 |
| 1004022 | 55 | 90.9 | 1 or more |
| 1001509 | 50 | 50 | 0 |
| 1004033 | 50 | 100 | 1 or more |
| 1010034 | 30 | 66.7 | 0 |
- In 2021, 2,215 school-aged children were eligible for instruction in French in Newfoundland and Labrador, including 595 in St. John’s, 130 in Paradise, 115 in Conception Bay South, and 95 in Happy Valley-Goose Bay.
- In Newfoundland and Labrador, 54% of eligible children were attending or had attended a French-language school in Canada. This proportion was lower in Conception Bay South (48%) and Paradise (42%), but higher in St. John’s (58%) and Happy Valley-Goose Bay (79%).
- All eligible children in Cape St. George had attended a French-language school, as did 91% of the eligible children in Division No. 4, Subdivision E. Both are neighbouring municipalities on the Port au Port Peninsula. However, the proportion of eligible children who had attended a French-language school was lower in Grand Falls-Windsor (42%), Corner Brook (40%) and Gander (40%).
- In Newfoundland and Labrador, 1,015 eligible school-aged children had never attended a French-language school in Canada. The municipality with the highest number of eligible children who had never attended a French-language school was St. John’s (250 children), followed by the neighbouring municipalities of Paradise (75) and Conception Bay South (60).

Description for Map 2
This map shows the number of school-aged children eligible for instruction in French and the proportion of these children who were attending or had attended a French-language school in Canada, in Prince Edward Island’s 16 census subdivisions (CSDs) where 30 or more eligible school-aged children lived in 2021, at least 10 of whom could conduct a conversation in French.
There are two boxes on the map. The first box shows that there were 2,230 eligible school-aged children in Prince Edward Island, 64.3% of whom had attended a French-language school. The second box shows that in Canada outside Quebec, there were 452,110 eligible school-aged children, 64.7% of whom had attended a French-language school.
On the map, the CSDs are represented by circles whose size corresponds to the number of eligible school-aged children. The colour of the circles represents the proportion of eligible children who were attending or had attended a French-language school in Canada. Of these CSDs, the ones with at least one French-language school are represented by a dot.
In 3 CSDs, 30 to 74 children were eligible, and 0% to 49% had attended a French-language school. There were no French-language schools in these CSDs.
In 2 CSDs, 30 to 74 children were eligible, and 50% to 64% had attended a French-language school. There was at least 1 French-language school in 1 of these CSDs.
In 4 CSDs, 30 to 74 children were eligible, and 65% to 79% had attended a French-language school. There was at least 1 French-language school in 1 of these CSDs.
In 1 CSD, 30 to 74 children were eligible, and 80% to 100% had attended a French-language school. There was at least 1 French-language school in this CSD.
In 2 CSDs, 75 to 199 children were eligible, and 50% to 64% had attended a French-language school. There was at least 1 French-language school in 1 of these CSDs.
In 1 CSD, 75 to 199 children were eligible, and 65% to 79% had attended a French-language school. There were no French-language schools in this CSD.
In 1 CSD, 75 to 199 children were eligible, and 80% to 100% had attended a French-language school. There were no French-language schools in this CSD.
In 2 CSDs, 200 to 405 children were eligible, and 50% to 64% had attended a French-language school. There was at least 1 French-language school in each of these 2 CSDs.
The size and colour of the circles were determined using the values from the table below.
| Census subdivision | Children eligible for instruction in French | Eligible children who attended a French-language school | French-language schools |
|---|---|---|---|
| Code | Number | Percentage | Number |
| 1102075 | 405 | 61.7 | 1 or more |
| 1103025 | 245 | 57.1 | 1 or more |
| 1102080 | 150 | 70 | 0 |
| 1103020 | 150 | 90 | 0 |
| 1102085 | 100 | 50 | 0 |
| 1102017 | 95 | 63.2 | 1 or more |
| 1101035 | 60 | 75 | 1 or more |
| 1101045 | 55 | 45.5 | 0 |
| 1103027 | 50 | 100 | 1 or more |
| 1103061 | 50 | 60 | 1 or more |
| 1102010 | 40 | 37.5 | 0 |
| 1102067 | 40 | 50 | 0 |
| 1102068 | 40 | 25 | 0 |
| 1103024 | 40 | 75 | 0 |
| 1103063 | 35 | 71.4 | 0 |
| 1103064 | 35 | 71.4 | 0 |
- In 2021, 2,230 school-aged children were eligible for instruction in French in Prince Edward Island, including 405 in Charlottetown, 245 in Summerside, and 150 in Stratford as well as in Wellington (Fire district).
- Just under two-thirds (64%) of eligible children in Prince Edward Island were attending or had attended a French-language school in Canada. This proportion was higher in Wellington (Fire district) (90%) than in Stratford (70%), Charlottetown (62%) and Summerside (57%).
- All eligible children in Abram-Village attended a French-language school, as did three-quarters of eligible children in Souris (Fire district) and Miscouche. The proportion of eligible children who attended a French-language school was lower in Three Rivers (46%), Crossroads (38%) and West River (25%).
- In Prince Edward Island, 795 eligible school-aged children had never attended a French-language school in Canada. The municipalities with the highest number of eligible children who had never attended a French-language school were Charlottetown (155 children), Summerside (105), Cornwall (50) and Stratford (45).
Description for Map 3
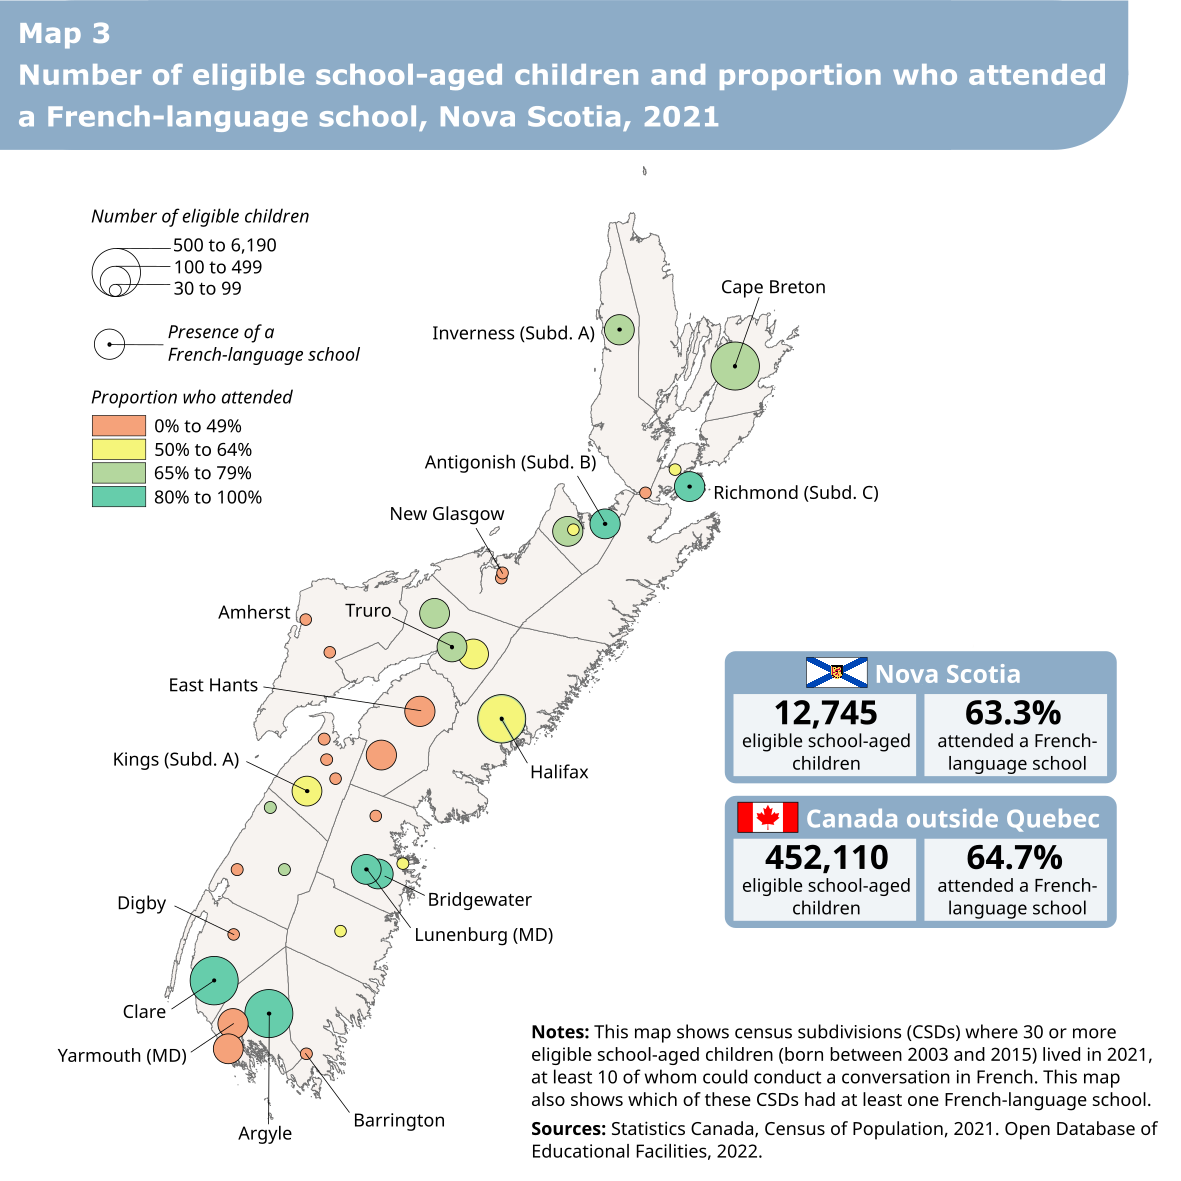
This map shows the number of school-aged children eligible for instruction in French and the proportion of these children who were attending or had attended a French-language school in Canada, in Nova Scotia’s 36 census subdivisions (CSDs) where 30 or more eligible school-aged children lived in 2021, at least 10 of whom could conduct a conversation in French.
There are two boxes on the map. The first box shows that there were 12,745 eligible school-aged children in Nova Scotia, 63.3% of whom had attended a French-language school. The second box shows that in Canada outside Quebec, there were 452,110 eligible school-aged children, 64.7% of whom had attended a French-language school.
On the map, the CSDs are represented by circles whose size corresponds to the number of eligible school-aged children. The colour of the circles represents the proportion of eligible children who were attending or had attended a French-language school in Canada. Of these CSDs, the ones with at least one French-language school are represented by a dot.
In 12 CSDs, 30 to 99 children were eligible, and 0% to 49% had attended a French-language school. There were no French-language schools in these CSDs.
In 4 CSDs, 30 to 99 children were eligible, and 50% to 64% had attended a French-language school. There were no French-language schools in these CSDs.
In 2 CSDs, 30 to 99 children were eligible, and 65% to 79% had attended a French-language school. There were no French-language schools in these CSDs.
In 4 CSDs, 100 to 499 children were eligible, and 0% to 49% had attended a French-language school. There were no French-language schools in these CSDs.
In 2 CSDs, 100 to 499 children were eligible, and 50% to 64% had attended a French-language school. There was at least 1 French-language school in 1 of these CSDs.
In 4 CSDs, 100 to 499 children were eligible, and 65% to 79% had attended a French-language school. There was at least 1 French-language school in 2 of these CSDs.
In 4 CSDs, 100 to 499 children were eligible, and 80% to 100% had attended a French-language school. There was at least 1 French-language school in 3 of these CSDs.
In 1 CSD, 500 to 6,190 children were eligible, and 50% to 64% had attended a French-language school. There was at least 1 French-language school in this CSD.
In 1 CSD, 500 to 6,190 children were eligible, and 65% to 79% had attended a French-language school. There was at least 1 French-language school in this CSD.
In 2 CSDs, 500 to 6,190 children were eligible, and 80% to 100% had attended a French-language school. There was at least 1 French-language school in each of these 2 CSDs.
The size and colour of the circles were determined using the values from the table below.
| Census subdivision | Children eligible for instruction in French | Eligible children who attended a French-language school | French-language schools |
|---|---|---|---|
| Code | Number | Percentage | Number |
| 1209034 | 6190 | 64.3 | 1 or more |
| 1217030 | 710 | 69.7 | 1 or more |
| 1202001 | 665 | 84.2 | 1 or more |
| 1203001 | 530 | 86.8 | 1 or more |
| 1207001 | 345 | 59.4 | 1 or more |
| 1202004 | 300 | 41.7 | 0 |
| 1206001 | 295 | 81.4 | 1 or more |
| 1210008 | 255 | 70.6 | 0 |
| 1216001 | 250 | 90 | 1 or more |
| 1214006 | 245 | 85.7 | 1 or more |
| 1214001 | 215 | 67.4 | 0 |
| 1215011 | 210 | 69 | 1 or more |
| 1210006 | 200 | 75 | 1 or more |
| 1208008 | 190 | 36.8 | 0 |
| 1208003 | 140 | 32.1 | 0 |
| 1210001 | 130 | 61.5 | 0 |
| 1202006 | 125 | 40 | 0 |
| 1206004 | 125 | 88 | 0 |
| 1207016 | 90 | 27.8 | 0 |
| 1216006 | 85 | 58.8 | 0 |
| 1203004 | 75 | 20 | 0 |
| 1206009 | 70 | 42.9 | 0 |
| 1205014 | 65 | 76.9 | 0 |
| 1211011 | 65 | 15.4 | 0 |
| 1205001 | 60 | 66.7 | 0 |
| 1207012 | 60 | 33.3 | 0 |
| 1212014 | 60 | 25 | 0 |
| 1204010 | 55 | 54.5 | 0 |
| 1207011 | 55 | 27.3 | 0 |
| 1201001 | 45 | 22.2 | 0 |
| 1205004 | 45 | 33.3 | 0 |
| 1206006 | 40 | 50 | 0 |
| 1211006 | 40 | 37.5 | 0 |
| 1214002 | 40 | 50 | 0 |
| 1212009 | 35 | 42.9 | 0 |
| 1215002 | 35 | 28.6 | 0 |
- In 2021, 12,745 school-aged children were eligible for instruction in French in Nova Scotia. Of these, about half (6,190) lived in Halifax, and several hundred lived in Cape Breton (710), Argyle (665) and Clare (530).
- In Nova Scotia, 63% of eligible children were attending or had attended a French-language school in Canada. This proportion was higher in Clare (87%) and Argyle (84%) than in Cape Breton (70%) and Halifax (64%).
- More than five in six eligible children attended a French-language school in Richmond Subdivision C (90%) (which includes Isle Madame), in Bridgewater (88%), and in Antigonish Subdivision B (86%) (which includes the village of Pomquet). Moreover, the proportion of eligible children who attended a French-language school was at most one-quarter in New Glasgow (25%), Barrington (22%), Digby (20%) and Amherst (15%).
- In Nova Scotia, 4,680 eligible school-aged children had never attended a French-language school in Canada. The municipalities with the highest number of eligible children who had never attended a French-language school were Halifax (2,210 children), Cape Breton (215), Yarmouth (Municipal district) (175), Kings Subdivision A (140), East Hants (120) and Argyle (105).
Description for Map 4
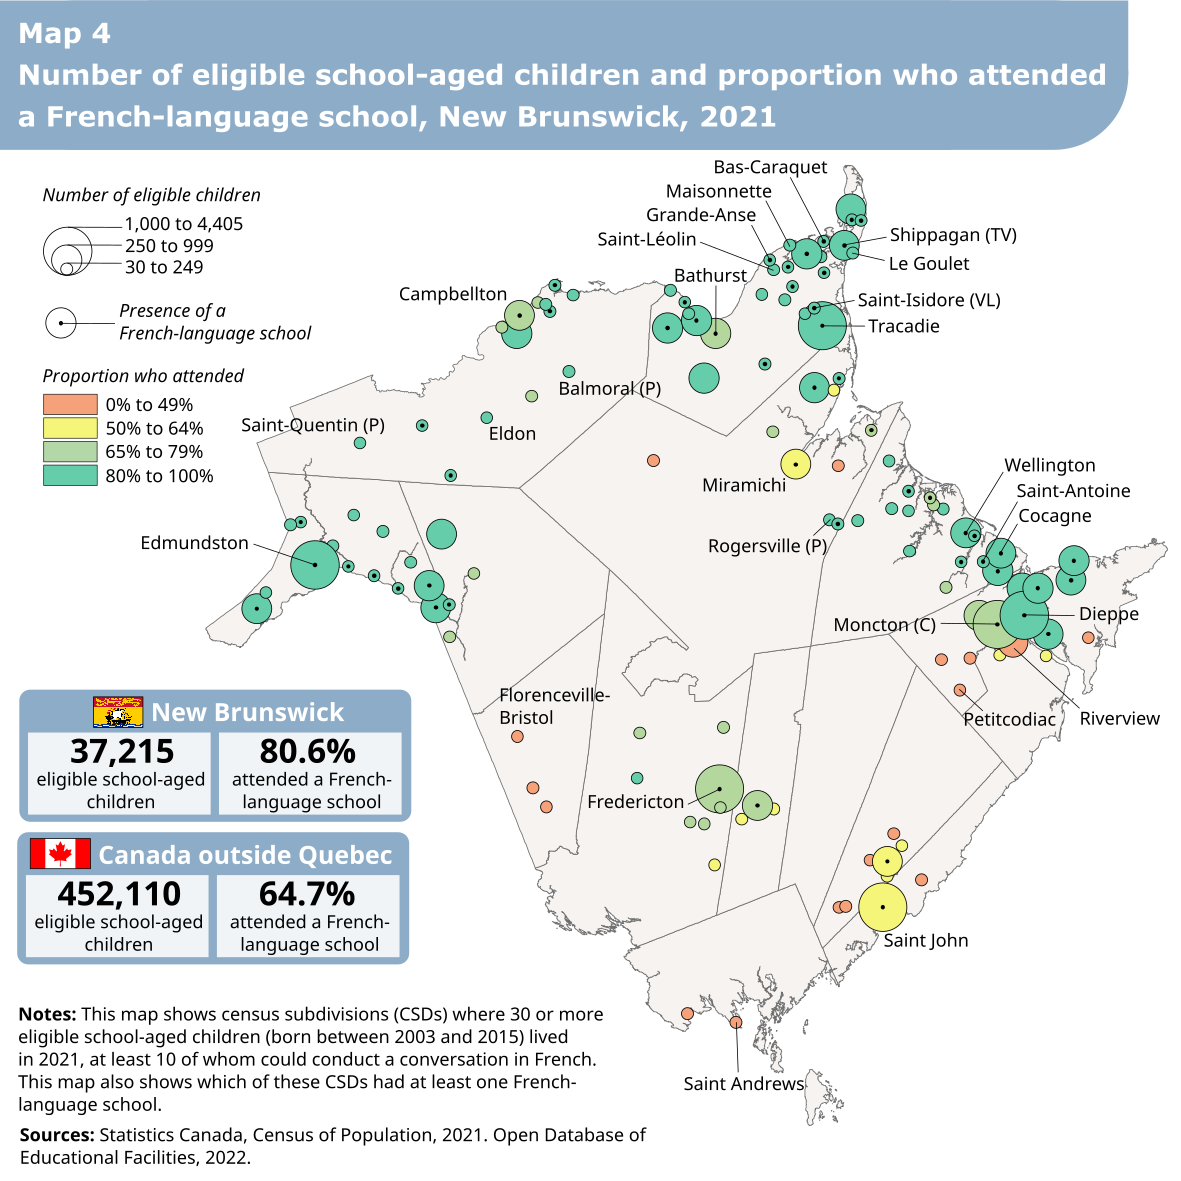
This map shows the number of school-aged children eligible for instruction in French and the proportion of these children who were attending or had attended a French-language school in Canada, in New Brunswick’s 126 census subdivisions (CSDs) where 30 or more eligible school-aged children lived in 2021, at least 10 of whom could conduct a conversation in French.
There are two boxes on the map. The first box shows that there were 37,215 eligible school-aged children in New Brunswick, 80.6% of whom had attended a French-language school. The second box shows that in Canada outside Quebec, there were 452,110 eligible school-aged children, 64.7% of whom had attended a French-language school.
On the map, the CSDs are represented by circles whose size corresponds to the number of eligible school-aged children. The colour of the circles represents the proportion of eligible children who were attending or had attended a French-language school in Canada. Of these CSDs, the ones with at least one French-language school are represented by a dot.
In 16 CSDs, 30 to 249 children were eligible, and 0% to 49% had attended a French-language school. There were no French-language schools in these CSDs.
In 8 CSDs, 30 to 249 children were eligible, and 50% to 64% had attended a French-language school. There were no French-language schools in these CSDs.
In 15 CSDs, 30 to 249 children were eligible, and 65% to 79% had attended a French-language school. There was at least 1 French-language school in 2 of these CSDs.
In 54 CSDs, 30 to 249 children were eligible, and 80% to 100% had attended a French-language school. There was at least 1 French-language school in 26 of these CSDs.
In 1 CSD, 250 to 999 children were eligible, and 0% to 49% had attended a French-language school. There were no French-language schools in this CSD.
In 2 CSDs, 250 to 999 children were eligible, and 50% to 64% had attended a French-language school. There was at least 1 French-language school in each of these 2 CSDs.
In 4 CSDs, 250 to 999 children were eligible, and 65% to 79% had attended a French-language school. There was at least 1 French-language school in 3 of these CSDs.
In 20 CSDs, 250 to 999 children were eligible, and 80% to 100% had attended a French-language school. There was at least 1 French-language school in 15 of these CSDs.
In 1 CSD, 1,000 to 4,405 children were eligible, and 50% to 64% had attended a French-language school. There was at least 1 French-language school in this CSD.
In 2 CSDs, 1,000 to 4,405 children were eligible, and 65% to 79% had attended a French-language school. There was at least 1 French-language school in each of these 2 CSDs.
In 3 CSDs, 1,000 to 4,405 children were eligible, and 80% to 100% had attended a French-language school. There was at least 1 French-language school in each of these 3 CSDs.
The size and colour of the circles were determined using the values from the table below.
| Census subdivision | Children eligible for instruction in French | Eligible children who attended a French-language school | French-language schools |
|---|---|---|---|
| Code | Number | Percentage | Number |
| 1307022 | 4405 | 73.8 | 1 or more |
| 1307045 | 3585 | 93.6 | 1 or more |
| 1313027 | 1795 | 91.6 | 1 or more |
| 1315002 | 1700 | 93.8 | 1 or more |
| 1310032 | 1545 | 70.9 | 1 or more |
| 1301006 | 1125 | 63.1 | 1 or more |
| 1307019 | 780 | 76.3 | 0 |
| 1315011 | 780 | 75 | 1 or more |
| 1307005 | 695 | 92.8 | 1 or more |
| 1315012 | 690 | 93.5 | 1 or more |
| 1307052 | 600 | 95 | 1 or more |
| 1306020 | 595 | 47.9 | 0 |
| 1307013 | 590 | 88.1 | 1 or more |
| 1314014 | 530 | 74.5 | 1 or more |
| 1312019 | 515 | 84.5 | 1 or more |
| 1315029 | 460 | 93.5 | 0 |
| 1313031 | 450 | 92.2 | 1 or more |
| 1315028 | 440 | 93.2 | 1 or more |
| 1307016 | 440 | 83 | 0 |
| 1303012 | 430 | 65.1 | 1 or more |
| 1308001 | 425 | 92.9 | 1 or more |
| 1305057 | 420 | 61.9 | 1 or more |
| 1309050 | 420 | 54.8 | 1 or more |
| 1315015 | 410 | 92.7 | 1 or more |
| 1314013 | 330 | 86.4 | 0 |
| 1315008 | 330 | 81.8 | 0 |
| 1309036 | 315 | 90.5 | 1 or more |
| 1312021 | 315 | 85.7 | 0 |
| 1308004 | 300 | 96.7 | 1 or more |
| 1315031 | 285 | 96.5 | 1 or more |
| 1313002 | 265 | 88.7 | 1 or more |
| 1307007 | 255 | 94.1 | 1 or more |
| 1308002 | 250 | 98 | 1 or more |
| 1314022 | 245 | 91.8 | 1 or more |
| 1308005 | 240 | 93.8 | 1 or more |
| 1314020 | 230 | 91.3 | 1 or more |
| 1314021 | 225 | 95.6 | 0 |
| 1303008 | 220 | 59.1 | 0 |
| 1315024 | 215 | 95.3 | 1 or more |
| 1308006 | 210 | 92.9 | 1 or more |
| 1305045 | 205 | 56.1 | 0 |
| 1315019 | 200 | 85 | 0 |
| 1310017 | 200 | 72.5 | 0 |
| 1308007 | 200 | 97.5 | 1 or more |
| 1313024 | 195 | 92.3 | 0 |
| 1314006 | 195 | 87.2 | 1 or more |
| 1314017 | 190 | 81.6 | 1 or more |
| 1314011 | 185 | 94.6 | 1 or more |
| 1315006 | 185 | 94.6 | 1 or more |
| 1315014 | 185 | 94.6 | 1 or more |
| 1313006 | 175 | 88.6 | 1 or more |
| 1308019 | 170 | 85.3 | 0 |
| 1310002 | 170 | 70.6 | 0 |
| 1309038 | 165 | 93.9 | 1 or more |
| 1303011 | 150 | 63.3 | 0 |
| 1308021 | 150 | 86.7 | 0 |
| 1309001 | 150 | 76.7 | 1 or more |
| 1310031 | 145 | 69 | 0 |
| 1313022 | 145 | 93.1 | 1 or more |
| 1310028 | 130 | 69.2 | 0 |
| 1308016 | 125 | 80 | 0 |
| 1315021 | 125 | 92 | 0 |
| 1315032 | 125 | 84 | 1 or more |
| 1313004 | 115 | 87 | 0 |
| 1314004 | 115 | 87 | 0 |
| 1309017 | 115 | 91.3 | 1 or more |
| 1315026 | 110 | 90.9 | 0 |
| 1315037 | 105 | 95.2 | 0 |
| 1315036 | 105 | 95.2 | 1 or more |
| 1306014 | 100 | 55 | 0 |
| 1313011 | 100 | 85 | 0 |
| 1313018 | 100 | 95 | 0 |
| 1312023 | 100 | 80 | 1 or more |
| 1307009 | 95 | 36.8 | 0 |
| 1309016 | 95 | 100 | 0 |
| 1310001 | 95 | 57.9 | 0 |
| 1310018 | 95 | 68.4 | 0 |
| 1313012 | 95 | 89.5 | 1 or more |
| 1308022 | 90 | 88.9 | 1 or more |
| 1305015 | 85 | 41.2 | 0 |
| 1312016 | 85 | 76.5 | 0 |
| 1315020 | 85 | 94.1 | 1 or more |
| 1315027 | 85 | 100 | 1 or more |
| 1308008 | 80 | 75 | 0 |
| 1308018 | 80 | 68.8 | 1 or more |
| 1313015 | 80 | 93.8 | 0 |
| 1314008 | 75 | 66.7 | 0 |
| 1313014 | 75 | 86.7 | 1 or more |
| 1315033 | 75 | 86.7 | 1 or more |
| 1315013 | 70 | 92.9 | 0 |
| 1315016 | 70 | 85.7 | 0 |
| 1315022 | 70 | 100 | 1 or more |
| 1315038 | 70 | 100 | 1 or more |
| 1305007 | 65 | 30.8 | 0 |
| 1308024 | 65 | 84.6 | 0 |
| 1312014 | 65 | 69.2 | 0 |
| 1301004 | 60 | 33.3 | 0 |
| 1314015 | 60 | 75 | 0 |
| 1308026 | 55 | 90.9 | 0 |
| 1309031 | 55 | 72.7 | 0 |
| 1313037 | 55 | 90.9 | 0 |
| 1305006 | 50 | 60 | 0 |
| 1307028 | 50 | 30 | 0 |
| 1310026 | 50 | 80 | 0 |
| 1313020 | 50 | 80 | 0 |
| 1309044 | 50 | 60 | 0 |
| 1307024 | 45 | 33.3 | 0 |
| 1309004 | 45 | 33.3 | 0 |
| 1314012 | 45 | 77.8 | 0 |
| 1302037 | 40 | 25 | 0 |
| 1305014 | 40 | 37.5 | 0 |
| 1311006 | 40 | 25 | 0 |
| 1314005 | 40 | 100 | 0 |
| 1315030 | 40 | 100 | 0 |
| 1308017 | 35 | 71.4 | 0 |
| 1314016 | 35 | 100 | 0 |
| 1315017 | 35 | 100 | 0 |
| 1302026 | 30 | 16.7 | 0 |
| 1305011 | 30 | 33.3 | 0 |
| 1306025 | 30 | 50 | 0 |
| 1307029 | 30 | 16.7 | 0 |
| 1308014 | 30 | 83.3 | 0 |
| 1309028 | 30 | 33.3 | 0 |
| 1311014 | 30 | 33.3 | 0 |
| 1311027 | 30 | 16.7 | 0 |
| 1315040 | 30 | 100 | 0 |
- In 2021, 37,215 school-aged children were eligible for instruction in French in New Brunswick, including 4,405 in Moncton (City), 3,585 in Dieppe, 1,795 in Edmundston, 1,700 in Tracadie, 1,545 in Fredericton and 1,125 in Saint John.
- In New Brunswick, 81% of eligible children were attending or had attended a French-language school in Canada, as did more than 9 in 10 eligible children in Dieppe (94%), Tracadie (94%), and Edmundston (92%). In contrast, the proportion of eligible children who had attended a French-language school was lower in Moncton (City) (74%), Fredericton (71%) and Saint John (63%).
- In a few municipalities where fewer than 100 eligible children lived—Balmoral (Parish), Bas-Caraquet, Eldon, Grande-Anse, Le Goulet, Maisonnette, Rogersville (Parish), Saint-Isidore (Village) and Saint-Léolin—all eligible children had attended a French-language school. Among municipalities with more than 100 eligible children, those with the highest proportion of children who had attended a French-language school were Cocagne (98%), Saint-Antoine (98%), Wellington (97%), Shippagan (Town) (97%) and Saint-Quentin (Parish) (96%). Conversely, one-sixth of eligible children in Florenceville-Bristol, Petitcodiac and Saint Andrews had attended a French-language school.
- In New Brunswick, 7,235 eligible school-aged children had never attended a French-language school in Canada. The municipalities with the highest number of children who had never attended a French-language school were Moncton (City) (1,155 children), Fredericton (450), Saint John (415), Riverview (310) and Dieppe (230).
Ontario
Description for Map 5
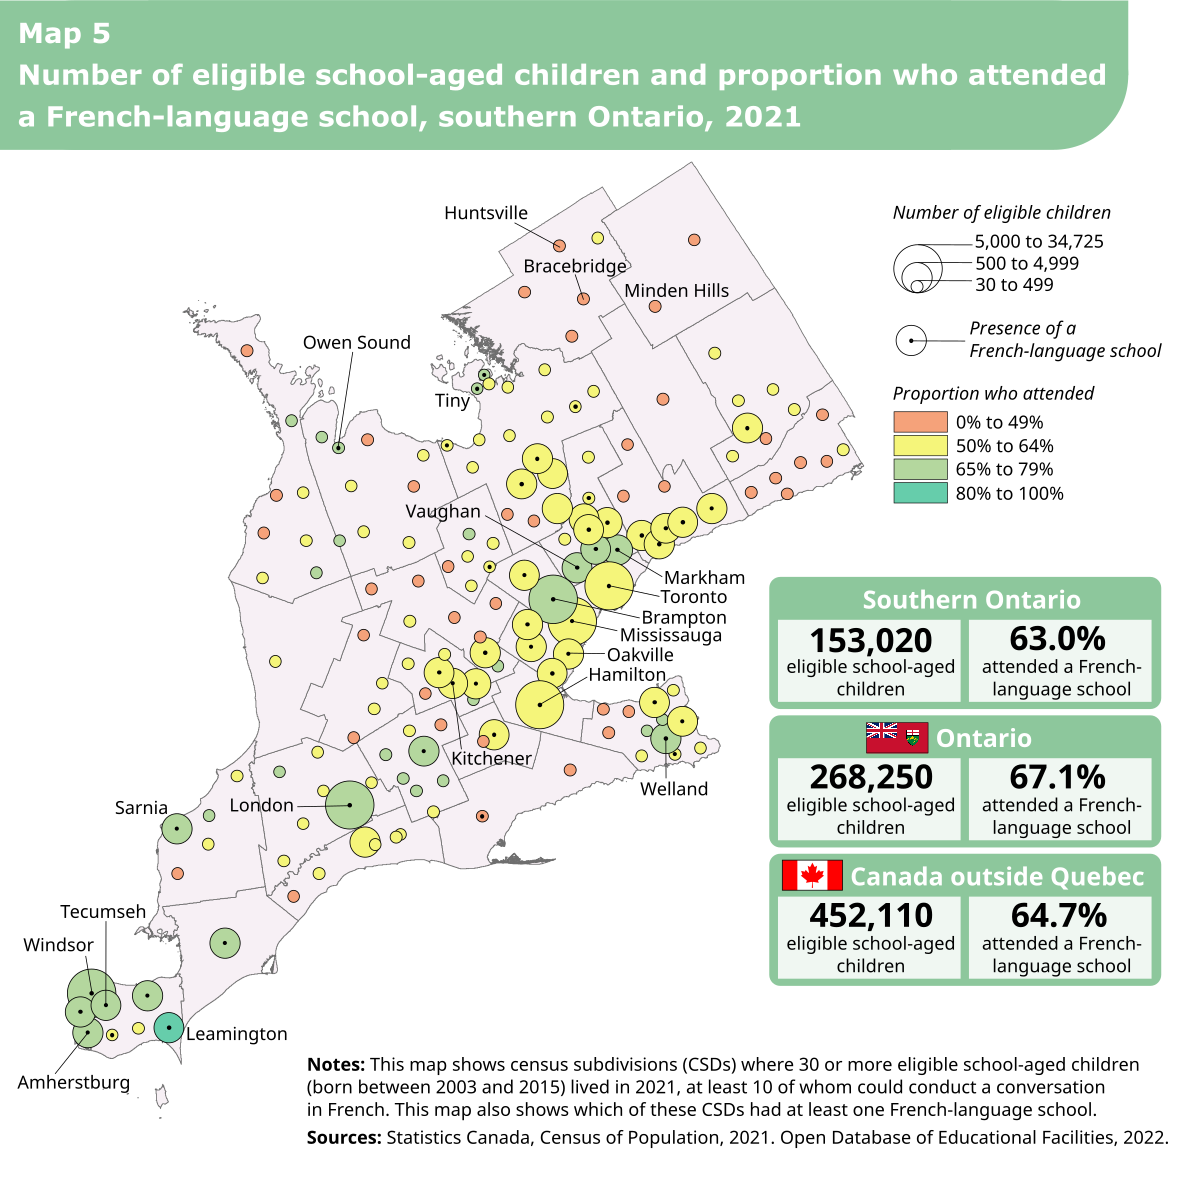
This map shows the number of school-aged children eligible for instruction in French and the proportion of these children who were attending or had attended a French-language school in Canada, in southern Ontario’s 160 census subdivisions (CSDs) where 30 or more eligible school-aged children lived in 2021, at least 10 of whom could conduct a conversation in French.
There are three boxes on the map. The first box shows that there were 153,020 eligible school-aged children in southern Ontario, 63.0% of whom had attended a French-language school. The second box shows that in Ontario, there were 268,250 eligible school-aged children, 67.1% of whom had attended a French-language school. The third box shows that in Canada outside Quebec, there were 452,110 eligible school-aged children, 64.7% of whom had attended a French-language school.
On the map, the CSDs are represented by circles whose size corresponds to the number of eligible school-aged children. The colour of the circles represents the proportion of eligible children who were attending or had attended a French-language school in Canada. Of these CSDs, the ones with at least one French-language school are represented by a dot.
In 42 CSDs, 30 to 499 children were eligible, and 0% to 49% had attended a French-language school. There was at least 1 French-language school in 1 of these CSDs.
In 56 CSDs, 30 to 499 children were eligible, and 50% to 64% had attended a French-language school. There was at least 1 French-language school in 6 of these CSDs.
In 18 CSDs, 30 to 499 children were eligible, and 65% to 79% had attended a French-language school. There was at least 1 French-language school in 3 of these CSDs.
In 26 CSDs, 500 to 4,999 children were eligible, and 50% to 64% had attended a French-language school. There was at least 1 French-language school in 22 of these CSDs.
In 11 CSDs, 500 to 4,999 children were eligible, and 65% to 79% had attended a French-language school. There was at least 1 French-language school in each of these 11 CSDs.
In 1 CSD, 500 to 4,999 children were eligible, and 80% to 100% had attended a French-language school. There was at least 1 French-language school in this CSD.
In 3 CSDs, 5,000 to 34,725 children were eligible, and 50% to 64% had attended a French-language school. There was at least 1 French-language school in each of these 3 CSDs.
In 3 CSDs, 5,000 to 34,725 children were eligible, and 65% to 79% had attended a French-language school. There was at least 1 French-language school in each of these 3 CSDs.
The size and colour of the circles were determined using the values from the table below.
| Census subdivision | Children eligible for instruction in French | Eligible children who attended a French-language school | French-language schools |
|---|---|---|---|
| Code | Number | Percentage | Number |
| 3520005 | 34725 | 64.6 | 1 or more |
| 3521010 | 9480 | 71.3 | 1 or more |
| 3521005 | 9220 | 64.7 | 1 or more |
| 3539036 | 6895 | 67.2 | 1 or more |
| 3525005 | 6005 | 57.2 | 1 or more |
| 3537039 | 5260 | 70.7 | 1 or more |
| 3519028 | 4230 | 65 | 1 or more |
| 3519036 | 4140 | 67 | 1 or more |
| 3524001 | 3965 | 58 | 1 or more |
| 3530013 | 3150 | 62.2 | 1 or more |
| 3519038 | 2840 | 67.1 | 1 or more |
| 3524009 | 2605 | 59.7 | 1 or more |
| 3518013 | 2440 | 61.1 | 1 or more |
| 3524002 | 2385 | 52 | 1 or more |
| 3518009 | 2265 | 55.4 | 1 or more |
| 3518005 | 2160 | 63.9 | 1 or more |
| 3543042 | 2150 | 57.7 | 1 or more |
| 3523008 | 2010 | 60.9 | 1 or more |
| 3536020 | 1865 | 73.5 | 1 or more |
| 3537064 | 1860 | 73.7 | 1 or more |
| 3526053 | 1595 | 62.7 | 1 or more |
| 3530010 | 1495 | 59.5 | 1 or more |
| 3530016 | 1495 | 61.2 | 1 or more |
| 3518017 | 1490 | 53 | 1 or more |
| 3519048 | 1380 | 60.1 | 0 |
| 3526032 | 1335 | 68.2 | 1 or more |
| 3526043 | 1330 | 64.3 | 1 or more |
| 3518001 | 1285 | 60.3 | 1 or more |
| 3529006 | 1190 | 60.9 | 1 or more |
| 3537034 | 1115 | 73.5 | 1 or more |
| 3538030 | 1115 | 68.6 | 1 or more |
| 3521024 | 970 | 57.7 | 1 or more |
| 3537028 | 945 | 76.2 | 1 or more |
| 3519046 | 910 | 62.1 | 1 or more |
| 3532042 | 885 | 70.6 | 1 or more |
| 3524015 | 880 | 54 | 1 or more |
| 3537048 | 835 | 79.6 | 1 or more |
| 3519044 | 720 | 57.6 | 1 or more |
| 3537003 | 720 | 83.3 | 1 or more |
| 3515014 | 680 | 54.4 | 1 or more |
| 3543021 | 580 | 60.3 | 1 or more |
| 3534021 | 545 | 57.8 | 0 |
| 3543014 | 540 | 60.2 | 0 |
| 3543017 | 500 | 50 | 0 |
| 3516010 | 485 | 41.2 | 0 |
| 3519070 | 470 | 50 | 0 |
| 3519054 | 450 | 60 | 1 or more |
| 3537016 | 445 | 59.6 | 1 or more |
| 3528052 | 435 | 49.4 | 1 or more |
| 3543007 | 435 | 48.3 | 0 |
| 3528018 | 390 | 47.4 | 0 |
| 3543009 | 380 | 56.6 | 0 |
| 3537013 | 370 | 60.8 | 0 |
| 3543068 | 370 | 73 | 1 or more |
| 3543052 | 355 | 57.7 | 1 or more |
| 3519049 | 350 | 64.3 | 0 |
| 3543074 | 350 | 50 | 0 |
| 3526037 | 335 | 67.2 | 0 |
| 3529005 | 335 | 49.3 | 0 |
| 3526003 | 315 | 61.9 | 0 |
| 3522014 | 310 | 56.5 | 1 or more |
| 3543031 | 310 | 59.7 | 1 or more |
| 3526011 | 305 | 59 | 1 or more |
| 3526065 | 300 | 40 | 0 |
| 3543023 | 290 | 51.7 | 0 |
| 3543072 | 290 | 67.2 | 1 or more |
| 3539033 | 270 | 57.4 | 0 |
| 3518029 | 260 | 44.2 | 0 |
| 3531011 | 260 | 50 | 0 |
| 3530035 | 255 | 54.9 | 0 |
| 3526057 | 240 | 47.9 | 0 |
| 3523025 | 235 | 42.6 | 0 |
| 3526028 | 235 | 68.1 | 0 |
| 3543064 | 235 | 57.4 | 0 |
| 3542059 | 230 | 69.6 | 1 or more |
| 3530020 | 220 | 43.2 | 0 |
| 3539027 | 195 | 61.5 | 0 |
| 3539015 | 185 | 62.2 | 0 |
| 3532018 | 180 | 66.7 | 0 |
| 3538003 | 165 | 45.5 | 0 |
| 3543071 | 165 | 54.5 | 0 |
| 3515015 | 160 | 53.1 | 0 |
| 3522021 | 160 | 68.8 | 0 |
| 3523009 | 160 | 46.9 | 0 |
| 3541045 | 160 | 34.4 | 0 |
| 3526047 | 155 | 54.8 | 0 |
| 3518020 | 145 | 27.6 | 0 |
| 3522012 | 145 | 51.7 | 0 |
| 3523017 | 145 | 44.8 | 0 |
| 3541024 | 145 | 48.3 | 0 |
| 3544042 | 145 | 24.1 | 0 |
| 3514021 | 135 | 29.6 | 0 |
| 3526021 | 135 | 44.4 | 0 |
| 3534020 | 135 | 55.6 | 0 |
| 3532004 | 130 | 53.8 | 0 |
| 3543005 | 130 | 53.8 | 0 |
| 3544018 | 125 | 24 | 0 |
| 3543003 | 120 | 45.8 | 0 |
| 3515013 | 115 | 52.2 | 0 |
| 3523001 | 115 | 69.6 | 0 |
| 3514020 | 110 | 40.9 | 0 |
| 3530004 | 110 | 72.7 | 0 |
| 3531040 | 110 | 36.4 | 0 |
| 3543015 | 110 | 59.1 | 0 |
| 3514004 | 105 | 52.4 | 0 |
| 3541032 | 100 | 60 | 0 |
| 3542004 | 100 | 55 | 0 |
| 3532012 | 95 | 73.7 | 0 |
| 3532027 | 95 | 68.4 | 0 |
| 3542015 | 95 | 42.1 | 0 |
| 3542047 | 95 | 47.4 | 0 |
| 3514019 | 90 | 44.4 | 0 |
| 3530027 | 90 | 55.6 | 0 |
| 3532002 | 90 | 66.7 | 0 |
| 3542005 | 90 | 55.6 | 0 |
| 3518039 | 85 | 29.4 | 0 |
| 3526014 | 85 | 64.7 | 0 |
| 3523033 | 80 | 56.3 | 0 |
| 3523050 | 80 | 37.5 | 0 |
| 3532038 | 80 | 62.5 | 0 |
| 3544002 | 80 | 37.5 | 0 |
| 3534010 | 75 | 53.3 | 0 |
| 3538035 | 75 | 66.7 | 0 |
| 3542045 | 75 | 53.3 | 0 |
| 3542053 | 75 | 66.7 | 0 |
| 3514045 | 70 | 42.9 | 0 |
| 3515005 | 70 | 42.9 | 0 |
| 3538019 | 70 | 64.3 | 0 |
| 3541015 | 70 | 50 | 0 |
| 3543019 | 70 | 57.1 | 0 |
| 3514024 | 65 | 38.5 | 0 |
| 3531016 | 65 | 38.5 | 0 |
| 3531030 | 65 | 61.5 | 0 |
| 3532045 | 65 | 38.5 | 0 |
| 3534011 | 65 | 61.5 | 0 |
| 3542029 | 60 | 66.7 | 0 |
| 3522008 | 55 | 63.6 | 0 |
| 3523043 | 55 | 36.4 | 0 |
| 3541004 | 55 | 72.7 | 0 |
| 3514014 | 50 | 40 | 0 |
| 3515023 | 50 | 60 | 0 |
| 3541043 | 50 | 50 | 0 |
| 3534030 | 45 | 55.6 | 0 |
| 3539060 | 45 | 55.6 | 0 |
| 3540025 | 45 | 55.6 | 0 |
| 3541055 | 45 | 66.7 | 0 |
| 3544053 | 45 | 44.4 | 0 |
| 3538040 | 40 | 62.5 | 0 |
| 3542037 | 40 | 50 | 0 |
| 3546015 | 40 | 12.5 | 0 |
| 3515044 | 35 | 57.1 | 0 |
| 3539005 | 35 | 57.1 | 0 |
| 3541069 | 35 | 42.9 | 0 |
| 3546024 | 35 | 42.9 | 0 |
| 3515003 | 30 | 50 | 0 |
| 3522001 | 30 | 50 | 0 |
| 3522010 | 30 | 33.3 | 0 |
| 3534042 | 30 | 33.3 | 0 |
| 3539041 | 30 | 66.7 | 0 |
| 3544027 | 30 | 50 | 0 |
- In 2021, 153,020 school-aged children were eligible for instruction in French in southern Ontario, including 34,725 in Toronto, 9,480 in Brampton, 9,220 in Mississauga, 6,895 in London, 6,010 in Hamilton and 5,260 in Windsor.
- Just under two-thirds (63%) of eligible children in southern Ontario were attending or had attended a French-language school in Canada. This proportion was higher in Brampton (71%), Windsor (71%), London (67%), Mississauga (64.7%) and Toronto (64.6%), but lower in Hamilton (57%).
- Over three-quarters of eligible children had attended a French-language school in three municipalities near Windsor—Leamington (83%), Tecumseh (79.6%) and Amherstburg (76%)—while less than a quarter of eligible children in Huntsville (24%), Bracebridge (24%) and Minden Hills (13%) had attended a French-language school.
- In southern Ontario, 56,675 eligible school-aged children had never attended a French-language school in Canada. The 10 southern Ontario municipalities with the highest number of eligible children who had never attended a French-language school were Toronto (12,295 children), Mississauga (3,255), Brampton (2,725), Hamilton (2,570), London (2,265), Oakville (1,665), Windsor (1,540), Vaughan (1,480), Markham (1,365) and Kitchener (1,190).
Description for Map 6
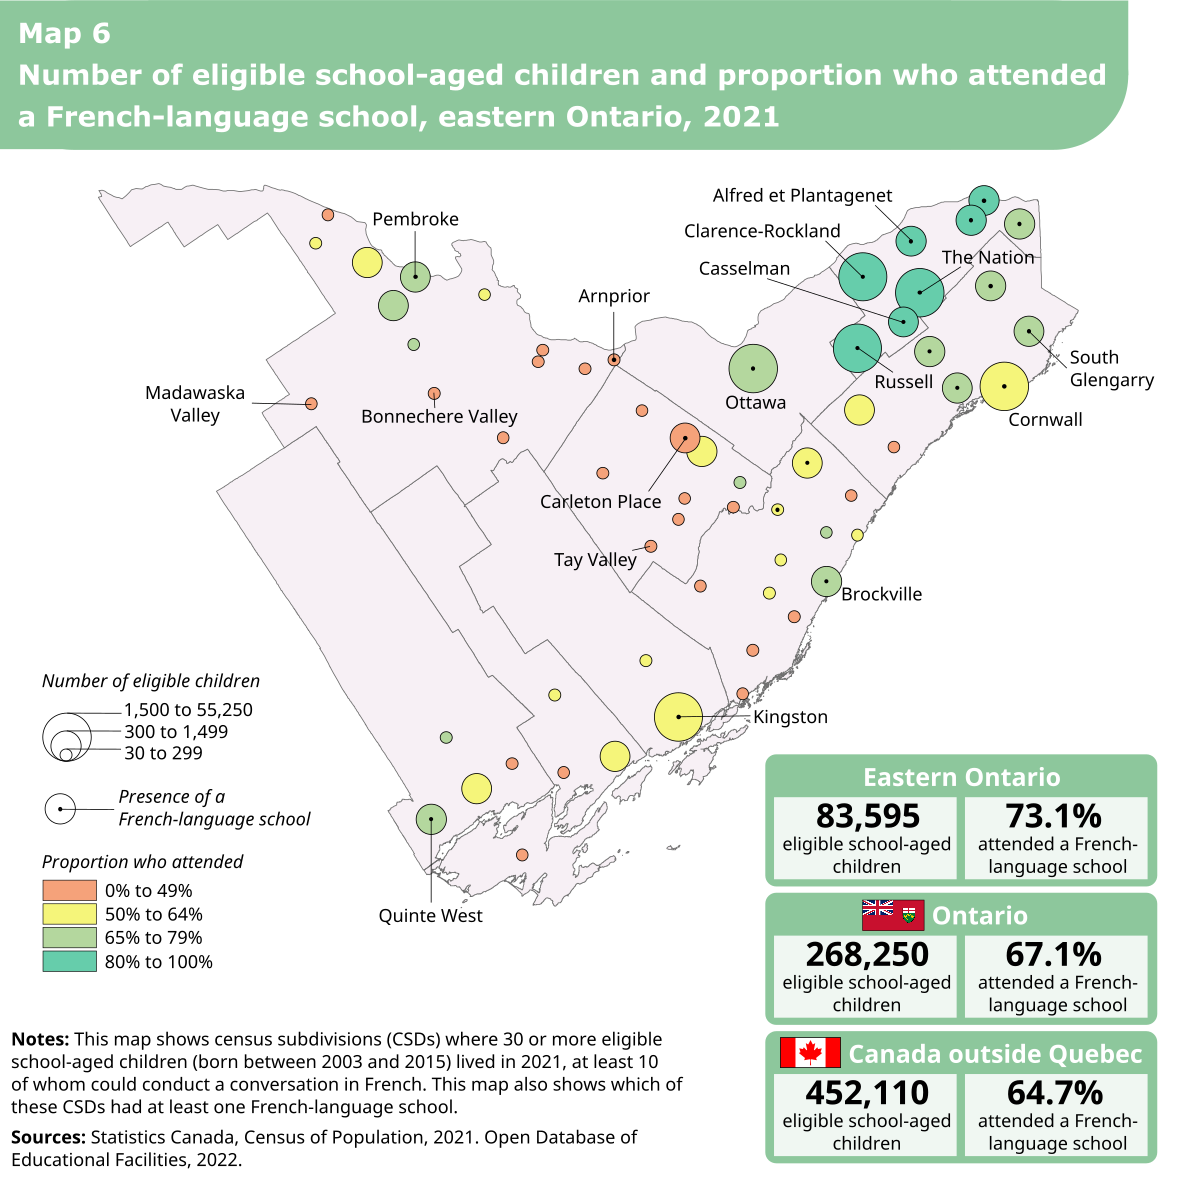
This map shows the number of school-aged children eligible for instruction in French and the proportion of these children who were attending or had attended a French-language school in Canada, in eastern Ontario’s 61 census subdivisions (CSDs) where 30 or more eligible school-aged children lived in 2021, at least 10 of whom could conduct a conversation in French.
There are three boxes on the map. The first box shows that there were 83,595 eligible school-aged children in eastern Ontario, 73.1% of whom had attended a French-language school. The second box shows that in Ontario, there were 268,250 eligible school-aged children, 67.1% of whom had attended a French-language school. The third box shows that in Canada outside Quebec, there were 452,110 eligible school-aged children, 64.7% of whom had attended a French-language school.
On the map, the CSDs are represented by circles whose size corresponds to the number of eligible school-aged children. The colour of the circles represents the proportion of eligible children who were attending or had attended a French-language school in Canada. Of these CSDs, the ones with at least one French-language school are represented by a dot.
In 23 CSDs, 30 to 299 children were eligible, and 0% to 49% had attended a French-language school. There was at least 1 French-language school in 1 of these CSDs.
In 8 CSDs, 30 to 299 children were eligible, and 50% to 64% had attended a French-language school. There was at least 1 French-language school in 1 of these CSDs.
In 4 CSDs, 30 to 299 children were eligible, and 65% to 79% had attended a French-language school. There were no French-language schools in these CSDs.
In 1 CSD, 300 to 1,499 children were eligible, and 0% to 49% had attended a French-language school. There was at least 1 French-language school in this CSD.
In 6 CSDs, 300 to 1,499 children were eligible, and 50% to 64% had attended a French-language school. There was at least 1 French-language school in 1 of these CSDs.
In 9 CSDs, 300 to 1,499 children were eligible, and 65% to 79% had attended a French-language school. There was at least 1 French-language school in 8 of these CSDs.
In 4 CSDs, 300 to 1,499 children were eligible, and 80% to 100% had attended a French-language school. There was at least 1 French-language school in each of these 4 CSDs.
In 2 CSDs, 1,500 to 55,250 children were eligible, and 50% to 64% had attended a French-language school. There was at least 1 French-language school in each of these 2 CSDs.
In 1 CSD, 1,500 to 55,250 children were eligible, and 65% to 79% had attended a French-language school. There was at least 1 French-language school in this CSD.
In 3 CSDs, 1,500 to 55,250 children were eligible, and 80% to 100% had attended a French-language school. There was at least 1 French-language school in each of these 3 CSDs.
The size and colour of the circles were determined using the values from the table below.
| Census subdivision | Children eligible for instruction in French | Eligible children who attended a French-language school | French-language schools |
|---|---|---|---|
| Code | Number | Percentage | Number |
| 3506008 | 55250 | 74.5 | 1 or more |
| 3502036 | 3145 | 88.4 | 1 or more |
| 3501012 | 2605 | 62.8 | 1 or more |
| 3510010 | 2465 | 64.1 | 1 or more |
| 3502048 | 2170 | 81.6 | 1 or more |
| 3502025 | 1795 | 88.9 | 1 or more |
| 3502023 | 1110 | 91.4 | 1 or more |
| 3501005 | 1020 | 69.6 | 1 or more |
| 3502008 | 965 | 81.3 | 1 or more |
| 3512015 | 875 | 68.6 | 1 or more |
| 3501050 | 865 | 74.0 | 1 or more |
| 3502010 | 865 | 82.7 | 1 or more |
| 3501011 | 855 | 65.5 | 1 or more |
| 3547076 | 835 | 64.1 | 0 |
| 3501042 | 665 | 72.9 | 1 or more |
| 3507065 | 595 | 57.1 | 1 or more |
| 3512005 | 575 | 52.2 | 0 |
| 3502044 | 510 | 93.1 | 1 or more |
| 3547064 | 400 | 70.0 | 1 or more |
| 3502001 | 365 | 76.7 | 1 or more |
| 3501030 | 350 | 54.3 | 0 |
| 3507015 | 335 | 71.6 | 1 or more |
| 3509028 | 335 | 47.8 | 1 or more |
| 3547075 | 320 | 79.7 | 0 |
| 3509024 | 300 | 51.7 | 0 |
| 3511005 | 300 | 53.3 | 0 |
| 3510020 | 275 | 54.5 | 0 |
| 3509030 | 270 | 37.0 | 0 |
| 3547056 | 180 | 58.3 | 0 |
| 3547002 | 175 | 31.4 | 1 or more |
| 3513020 | 165 | 48.5 | 0 |
| 3501020 | 160 | 37.5 | 0 |
| 3511015 | 135 | 37.0 | 0 |
| 3509010 | 125 | 32.0 | 0 |
| 3507006 | 120 | 70.8 | 0 |
| 3507014 | 120 | 54.2 | 0 |
| 3547003 | 120 | 33.3 | 0 |
| 3507004 | 115 | 47.8 | 0 |
| 3507021 | 110 | 45.5 | 0 |
| 3509004 | 110 | 40.9 | 0 |
| 3507040 | 95 | 47.4 | 0 |
| 3509039 | 95 | 31.6 | 0 |
| 3547048 | 95 | 26.3 | 0 |
| 3509001 | 90 | 77.8 | 0 |
| 3547090 | 80 | 62.5 | 0 |
| 3547096 | 75 | 46.7 | 0 |
| 3511030 | 70 | 50.0 | 0 |
| 3507052 | 65 | 61.5 | 1 or more |
| 3547046 | 65 | 38.5 | 0 |
| 3507024 | 55 | 36.4 | 0 |
| 3509021 | 55 | 45.5 | 0 |
| 3509015 | 50 | 20.0 | 0 |
| 3507008 | 45 | 55.6 | 0 |
| 3512001 | 45 | 44.4 | 0 |
| 3547070 | 45 | 77.8 | 0 |
| 3507042 | 40 | 62.5 | 0 |
| 3547035 | 40 | 25.0 | 0 |
| 3507017 | 30 | 33.3 | 0 |
| 3512026 | 30 | 66.7 | 0 |
| 3547008 | 30 | 33.3 | 0 |
| 3547030 | 30 | 16.7 | 0 |
- In 2021, 83,595 school-aged children were eligible for instruction in French in eastern Ontario, including 55,250 in Ottawa, 3,145 in Clarence-Rockland, 2,605 in Cornwall, 2,465 in Kingston, 2,170 in Russell and 1,795 in The Nation.
- Close to three-quarters (73%) of eligible children in eastern Ontario were attending or had attended a French-language school in Canada. This proportion was lower in Cornwall (63%) and Kingston (64%), but higher in Ottawa (75%), Russell (82%), Clarence-Rockland (88%) and The Nation (89%).
- More than 9 in 10 eligible children attended a French-language school in Alfred and Plantagenet (91%) and Casselman (93%), municipalities in the United Counties of Prescott and Russell. In contrast, the proportion of eligible children who attended a French-language school was no more than a quarter in Bonnechere Valley (25%), Tay Valley (20%) and Madawaska Valley (17%).
- In eastern Ontario, 22,515 eligible school-aged children had never attended a French-language school in Canada. At least 300 eligible children had never attended a French-language school in Ottawa (14,080 children), Cornwall (970), Kingston (885), Russell (400), Clarence-Rockland (365), South Glengarry (310) and Petawawa (300).
Description for Map 7
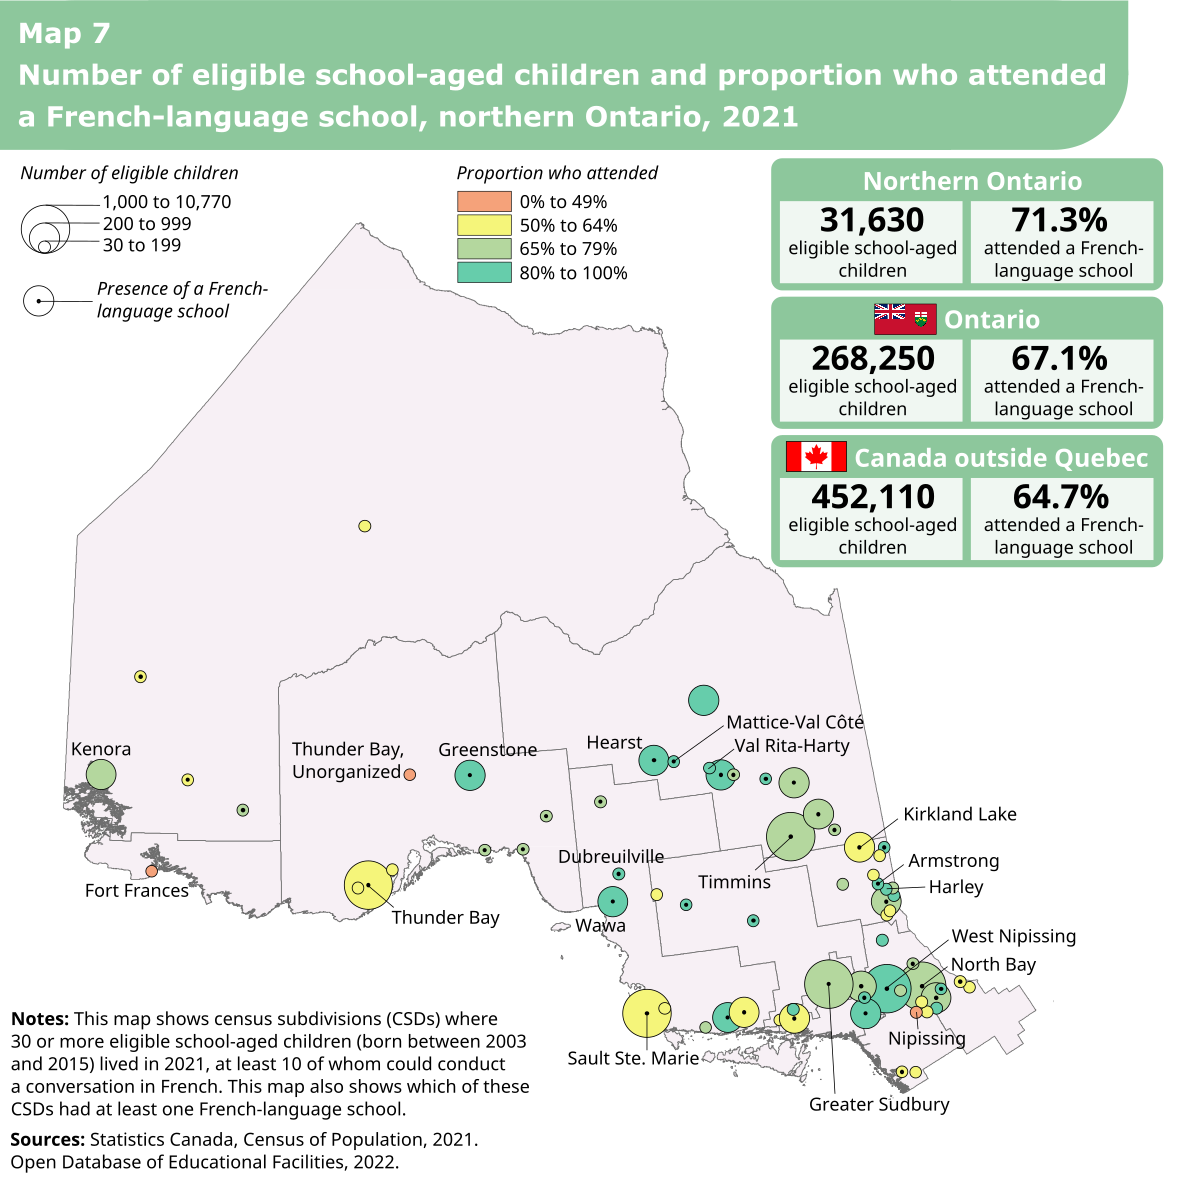
This map shows the number of school-aged children eligible for instruction in French and the proportion of these children who were attending or had attended a French-language school in Canada, in northern Ontario’s 70 census subdivisions (CSDs) where 30 or more eligible school-aged children lived in 2021, at least 10 of whom could conduct a conversation in French.
There are three boxes on the map. The first box shows that there were 31,630 eligible school-aged children in northern Ontario, 71.3% of whom had attended a French-language school. The second box shows that in Ontario, there were 268,250 eligible school-aged children, 67.1% of whom had attended a French-language school. The third box shows that in Canada outside Quebec, there were 452,110 eligible school-aged children, 64.7% of whom had attended a French-language school.
On the map, the CSDs are represented by circles whose size corresponds to the number of eligible school-aged children. The colour of the circles represents the proportion of eligible children who were attending or had attended a French-language school in Canada. Of these CSDs, the ones with at least one French-language school are represented by a dot.
In 3 CSDs, 30 to 199 children were eligible, and 0% to 49% had attended a French-language school. There were no French-language schools in these CSDs.
In 18 CSDs, 30 to 199 children were eligible, and 50% to 64% had attended a French-language school. There was at least 1 French-language school in 4 of these CSDs.
In 12 CSDs, 30 to 199 children were eligible, and 65% to 79% had attended a French-language school. There was at least 1 French-language school in 8 of these CSDs.
In 15 CSDs, 30 to 199 children were eligible, and 80% to 100% had attended a French-language school. There was at least 1 French-language school in 9 of these CSDs.
In 3 CSDs, 200 to 999 children were eligible, and 50% to 64% had attended a French-language school. There was at least 1 French-language school in each of these 3 of CSDs.
In 6 CSDs, 200 to 999 children were eligible, and 65% to 79% had attended a French-language school. There was at least 1 French-language school in 5 of these CSDs.
In 7 CSDs, 200 to 999 children were eligible, and 80% to 100% had attended a French-language school. There was at least 1 French-language school in 6 of these CSDs.
In 2 CSDs, 1,000 to 10,770 children were eligible, and 50% to 64% had attended a French-language school. There was at least 1 French-language school in each of these 2 CSDs.
In 3 CSDs, 1,000 to 10,770 children were eligible, and 65% to 79% had attended a French-language school. There was at least 1 French-language school in each of these 3 CSDs.
In 1 CSD, 1,000 to 10,770 children were eligible, and 80% to 100% had attended a French-language school. There was at least 1 French-language school in this CSD.
The size and colour of the circles were determined using the values from the table below.
| Census subdivision | Children eligible for instruction in French | Eligible children who attended a French-language school | French-language schools |
|---|---|---|---|
| Code | Number | Percentage | Number |
| 3553005 | 10770 | 70.3 | 1 or more |
| 3556027 | 3600 | 73.6 | 1 or more |
| 3548044 | 2275 | 66.8 | 1 or more |
| 3548055 | 1520 | 91.1 | 1 or more |
| 3557061 | 1265 | 56.9 | 1 or more |
| 3558004 | 1220 | 59.0 | 1 or more |
| 3556066 | 960 | 88.5 | 1 or more |
| 3554020 | 735 | 78.2 | 1 or more |
| 3556076 | 620 | 96.8 | 1 or more |
| 3556042 | 430 | 75.6 | 1 or more |
| 3548034 | 370 | 79.7 | 1 or more |
| 3556031 | 360 | 65.3 | 1 or more |
| 3554068 | 345 | 62.3 | 1 or more |
| 3560010 | 290 | 65.5 | 0 |
| 3557041 | 280 | 57.1 | 1 or more |
| 3552026 | 270 | 63.0 | 1 or more |
| 3558075 | 240 | 81.3 | 1 or more |
| 3557038 | 230 | 80.4 | 1 or more |
| 3552013 | 220 | 77.3 | 1 or more |
| 3556092 | 210 | 83.3 | 0 |
| 3557076 | 210 | 90.5 | 1 or more |
| 3552001 | 205 | 87.8 | 1 or more |
| 3549066 | 190 | 63.2 | 0 |
| 3552092 | 185 | 81.1 | 1 or more |
| 3556014 | 165 | 78.8 | 1 or more |
| 3552093 | 155 | 80.6 | 1 or more |
| 3554036 | 155 | 93.5 | 1 or more |
| 3554094 | 125 | 72.0 | 0 |
| 3556056 | 115 | 78.3 | 1 or more |
| 3558059 | 115 | 65.2 | 1 or more |
| 3548021 | 110 | 63.6 | 1 or more |
| 3549060 | 110 | 59.1 | 0 |
| 3560042 | 105 | 52.4 | 1 or more |
| 3548027 | 100 | 80.0 | 1 or more |
| 3558066 | 100 | 65.0 | 1 or more |
| 3556048 | 90 | 83.3 | 1 or more |
| 3548073 | 85 | 76.5 | 0 |
| 3552023 | 85 | 64.7 | 0 |
| 3556070 | 85 | 94.1 | 0 |
| 3557079 | 85 | 100.0 | 1 or more |
| 3548013 | 80 | 56.3 | 0 |
| 3557095 | 80 | 56.3 | 0 |
| 3552004 | 75 | 86.7 | 1 or more |
| 3558090 | 75 | 46.7 | 0 |
| 3554026 | 65 | 92.3 | 0 |
| 3558011 | 65 | 53.8 | 0 |
| 3558028 | 65 | 53.8 | 0 |
| 3560090 | 65 | 53.8 | 0 |
| 3548031 | 60 | 83.3 | 0 |
| 3556077 | 60 | 100.0 | 1 or more |
| 3559012 | 60 | 41.7 | 0 |
| 3548094 | 55 | 72.7 | 1 or more |
| 3554058 | 55 | 81.8 | 1 or more |
| 3560027 | 55 | 54.5 | 1 or more |
| 3549032 | 50 | 60.0 | 1 or more |
| 3554008 | 50 | 60.0 | 0 |
| 3554052 | 50 | 60.0 | 0 |
| 3557096 | 50 | 70.0 | 1 or more |
| 3558054 | 50 | 70.0 | 1 or more |
| 3560001 | 45 | 66.7 | 1 or more |
| 3554001 | 40 | 62.5 | 0 |
| 3554014 | 40 | 87.5 | 0 |
| 3549071 | 35 | 42.9 | 0 |
| 3552028 | 35 | 85.7 | 0 |
| 3554029 | 35 | 71.4 | 0 |
| 3548069 | 30 | 83.3 | 0 |
| 3549003 | 30 | 50.0 | 0 |
| 3554062 | 30 | 50.0 | 0 |
| 3557074 | 30 | 50.0 | 0 |
| 3557035 | 30 | 66.7 | 0 |
- In 2021, 31,630 school-aged children were eligible for instruction in French in northern Ontario, including 10,770 in Greater Sudbury, 3,600 in Timmins, 2,275 in North Bay, 1,520 in West Nipissing, 1,265 in Sault Ste. Marie and 1,220 in Thunder Bay.
- Of all eligible school-aged children in northern Ontario, 71% were attending or had attended a French-language school in Canada. This proportion was lower in Sault Ste. Marie (57%), Thunder Bay (59%), North Bay (67%) and Greater Sudbury (70%), but higher in Timmins (74%) and West Nipissing (91%).
- All eligible children in Dubreuilville and Mattice-Val Côté and at least 9 in 10 eligible children in Hearst (97%), Val Rita-Harty (94%), Armstrong (94%), Harley (92%) and Wawa (91%) attended a French-language school. The proportion of eligible children who attended a French-language school was lower in Fort Frances (42%), Nipissing (43%), and Thunder Bay, Unorganized (47%).
- In northern Ontario, 9,070 eligible school-aged children had never attended a French-language school in Canada. In five municipalities, 500 or more eligible children had never attended a French-language school: Greater Sudbury (3,200 children), Timmins (950), North Bay (755), Sault Ste. Marie (545) and Thunder Bay (500).
Western provinces and the territories
Description for Map 8
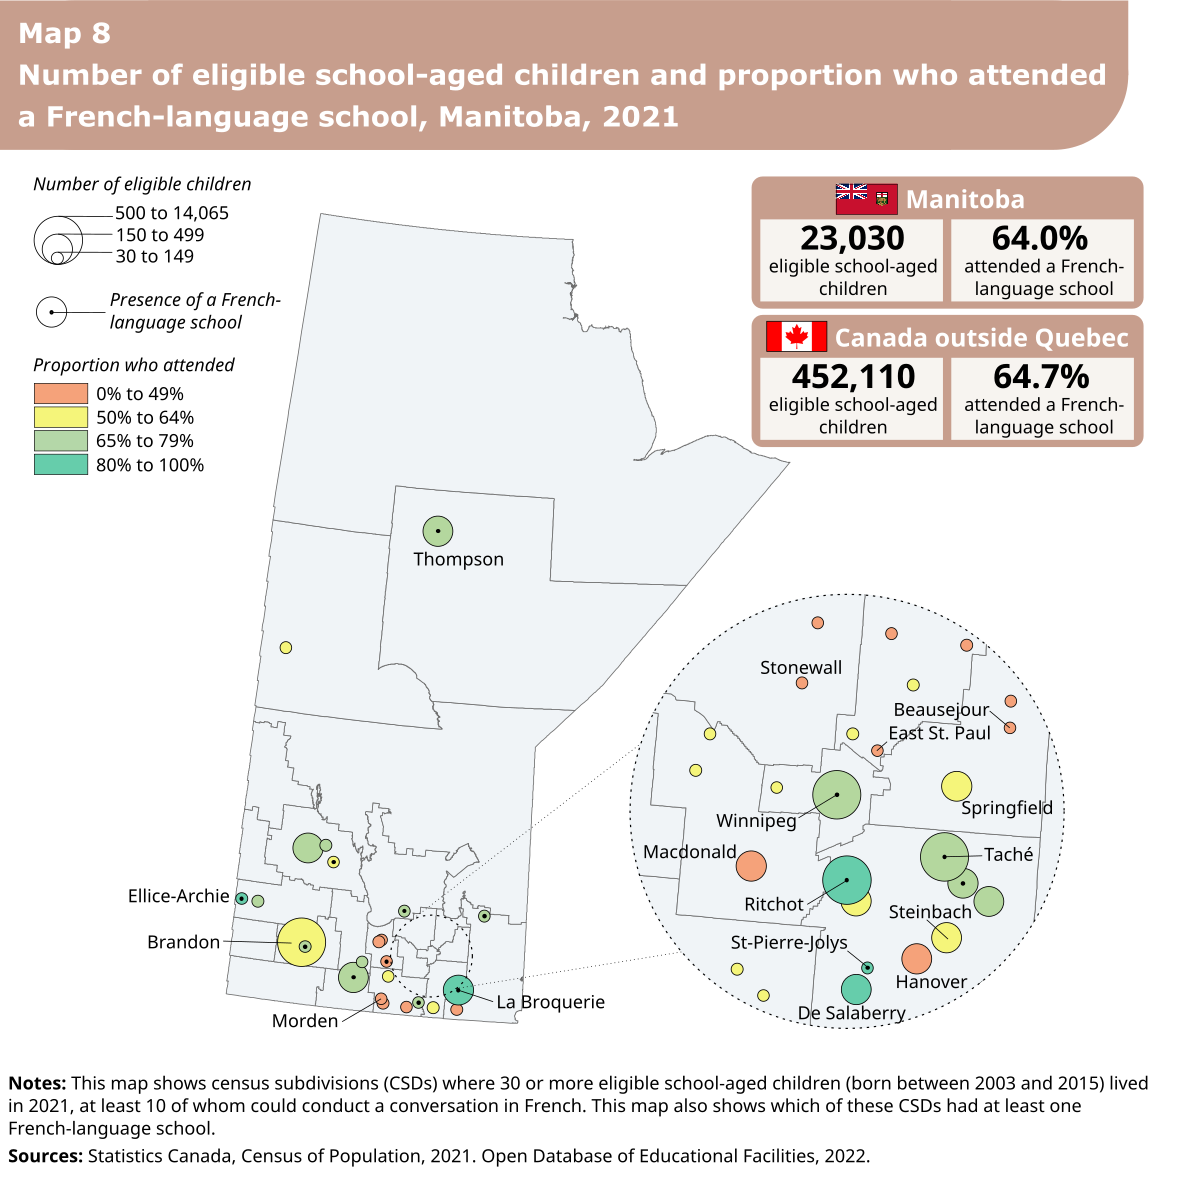
This map shows the number of school-aged children eligible for instruction in French and the proportion of these children who were attending or had attended a French-language school in Canada, in Manitoba’s 52 census subdivisions (CSDs) where 30 or more eligible school-aged children lived in 2021, at least 10 of whom could conduct a conversation in French.
There are two boxes on the map. The first box shows that there were 23,030 eligible school-aged children in Manitoba, 64.0% of whom had attended a French-language school. The second box shows that in Canada outside Quebec, there were 452,110 eligible school-aged children, 64.7% of whom had attended a French-language school.
On the map, the CSDs are represented by circles whose size corresponds to the number of eligible school-aged children. The colour of the circles represents the proportion of eligible children who were attending or had attended a French-language school in Canada. Of these CSDs, the ones with at least one French-language school are represented by a dot.
In 14 CSDs, 30 to 149 children were eligible, and 0% to 49% had attended a French-language school. There was at least 1 French-language school in 1 of these CSDs.
In 12 CSDs, 30 to 149 children were eligible, and 50% to 64% had attended a French-language school. There was at least 1 French-language school in 1 of these CSDs.
In 8 CSDs, 30 to 149 children were eligible, and 65% to 79% had attended a French-language school. There was at least 1 French-language school in 4 of these CSDs.
In 2 CSDs, 30 to 149 children were eligible, and 80% to 100% had attended a French-language school. There was at least 1 French-language school in each of these 2 CSDs.
In 2 CSDs, 150 to 499 children were eligible, and 0% to 49% had attended a French-language school. There were no French-language schools in these CSDs.
In 3 CSDs, 150 to 499 children were eligible, and 50% to 64% had attended a French-language school. There were no French-language schools in these CSDs.
In 5 CSDs, 150 to 499 children were eligible, and 65% to 79% had attended a French-language school. There was at least 1 French-language school in 3 of these CSDs.
In 2 CSDs, 150 to 499 children were eligible, and 80% to 100% had attended a French-language school. There was at least 1 French-language school in 1 of these CSDs.
In 1 CSD, 500 to 14,065 children were eligible, and 50% to 64% had attended a French-language school. There were no French-language schools in this CSD.
In 2 CSDs, 500 to 14,065 children were eligible, and 65% to 79% had attended a French-language school. There was at least 1 French-language school in each of these 2 CSDs.
In 1 CSD, 500 to 14,065 children were eligible, and 80% to 100% had attended a French-language school. There was at least 1 French-language school in this CSD.
The size and colour of the circles were determined using the values from the table below.
| Census subdivision | Children eligible for instruction in French | Eligible children who attended a French-language school | French-language schools |
|---|---|---|---|
| Code | Number | Percentage | Number |
| 4611040 | 14065 | 67.4 | 1 or more |
| 4602069 | 715 | 69.2 | 1 or more |
| 4607062 | 650 | 59.2 | 0 |
| 4602075 | 520 | 82.7 | 1 or more |
| 4602032 | 360 | 80.6 | 0 |
| 4602053 | 350 | 80 | 1 or more |
| 4602057 | 310 | 75.8 | 0 |
| 4612047 | 290 | 50 | 0 |
| 4602041 | 245 | 49 | 0 |
| 4602044 | 225 | 51.1 | 0 |
| 4604064 | 210 | 76.2 | 1 or more |
| 4622026 | 210 | 73.8 | 1 or more |
| 4602046 | 185 | 59.5 | 0 |
| 4602061 | 185 | 78.4 | 1 or more |
| 4610035 | 180 | 41.7 | 0 |
| 4617050 | 155 | 67.7 | 0 |
| 4602037 | 145 | 82.8 | 1 or more |
| 4613047 | 145 | 62.1 | 0 |
| 4609029 | 135 | 44.4 | 0 |
| 4609018 | 125 | 48 | 1 or more |
| 4613032 | 125 | 32 | 0 |
| 4613037 | 125 | 56 | 0 |
| 4607060 | 115 | 78.3 | 1 or more |
| 4613043 | 115 | 34.8 | 0 |
| 4613056 | 115 | 43.5 | 0 |
| 4603030 | 105 | 76.2 | 1 or more |
| 4603053 | 100 | 25 | 0 |
| 4610043 | 100 | 55 | 0 |
| 4618040 | 100 | 70 | 1 or more |
| 4609024 | 90 | 33.3 | 0 |
| 4617041 | 90 | 61.1 | 1 or more |
| 4608032 | 85 | 70.6 | 0 |
| 4614036 | 75 | 40 | 0 |
| 4601071 | 70 | 71.4 | 1 or more |
| 4611042 | 70 | 50 | 0 |
| 4615047 | 65 | 92.3 | 1 or more |
| 4612054 | 55 | 36.4 | 0 |
| 4614039 | 55 | 27.3 | 0 |
| 4602024 | 50 | 60 | 0 |
| 4603047 | 50 | 40 | 0 |
| 4603065 | 50 | 50 | 0 |
| 4617048 | 50 | 50 | 0 |
| 4603067 | 45 | 55.6 | 0 |
| 4621045 | 45 | 55.6 | 0 |
| 4603074 | 40 | 50 | 0 |
| 4612056 | 40 | 25 | 0 |
| 4601035 | 35 | 42.9 | 0 |
| 4603040 | 35 | 42.9 | 0 |
| 4607046 | 35 | 71.4 | 0 |
| 4610052 | 30 | 50 | 0 |
| 4615056 | 30 | 66.7 | 0 |
| 4617075 | 30 | 66.7 | 0 |
- In 2021, 23,030 school-aged children were eligible for instruction in French in Manitoba, including 14,065 in Winnipeg, 715 in Taché, 650 in Brandon and 520 in Ritchot.
- Nearly two-thirds (64%) of eligible children in Manitoba were attending or had attended a French-language school in Canada. This proportion was lower in Brandon (59%), but higher in Winnipeg (67%), Taché (69%) and Ritchot (83%).
- The proportion of eligible children who attended a French-language school was 92% in Ellice-Archie, 83% in St-Pierre-Jolys, 81% in De Salaberry and 80% in La Broquerie. Conversely, less than a third of eligible children in Morden (25%), Beausejour (25%), Stonewall (27%) and East St. Paul (32%) had attended a French-language school.
- In Manitoba, 8,275 eligible school-aged children had never attended a French-language school in Canada. In some municipalities, more than 100 eligible children had never attended a French-language school. These include Winnipeg (4,590 children), Brandon (265), Taché (220), Springfield (145), Hanover (125), Steinbach (110) and Macdonald (105).
Description for Map 9
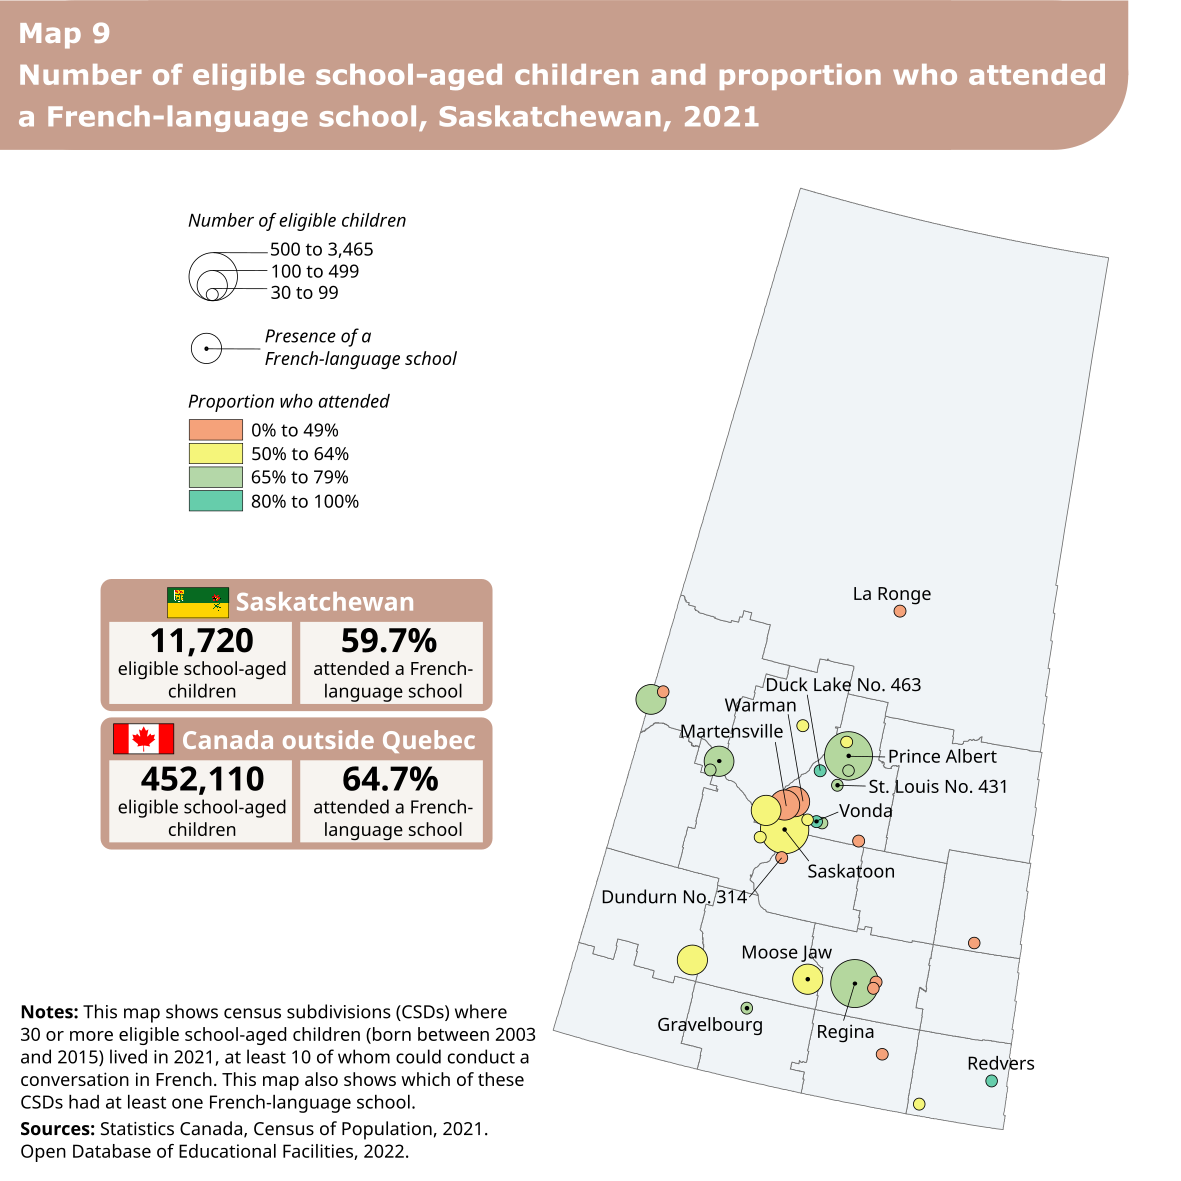
This map shows the number of school-aged children eligible for instruction in French and the proportion of these children who were attending or had attended a French-language school in Canada, in Saskatchewan’s 31 census subdivisions (CSDs) where 30 or more eligible school-aged children lived in 2021, at least 10 of whom could conduct a conversation in French.
There are two boxes on the map. The first box shows that there were 11,720 eligible school-aged children in Saskatchewan, 59.7% of whom had attended a French-language school. The second box shows that in Canada outside Quebec, there were 452,110 eligible school-aged children, 64.7% of whom had attended a French-language school.
On the map, the CSDs are represented by circles whose size corresponds to the number of eligible school-aged children. The colour of the circles represents the proportion of eligible children who were attending or had attended a French-language school in Canada. Of these CSDs, the ones with at least one French-language school are represented by a dot.
In 8 CSDs, 30 to 99 children were eligible, and 0% to 49% had attended a French-language school. There were no French-language schools in these CSDs.
In 5 CSDs, 30 to 99 children were eligible, and 50% to 64% had attended a French-language school. There were no French-language schools in these CSDs.
In 5 CSDs, 30 to 99 children were eligible, and 65% to 79% had attended a French-language school. There was at least 1 French-language school in 2 of these CSDs.
In 3 CSDs, 30 to 99 children were eligible, and 80% to 100% had attended a French-language school. There was at least 1 French-language school in 1 of these CSDs.
In 2 CSDs, 100 to 499 children were eligible, and 0% to 49% had attended a French-language school. There were no French-language schools in these CSDs.
In 3 CSDs, 100 to 499 children were eligible, and 50% to 64% had attended a French-language school. There was at least 1 French-language school in 1 of these CSDs.
In 2 CSDs, 100 to 499 children were eligible, and 65% to 79% had attended a French-language school. There was at least 1 French-language school in 1 of these CSDs.
In 1 CSD, 500 to 3,465 children were eligible, and 50% to 64% had attended a French-language school. There was at least 1 French-language school in this CSD.
In 2 CSDs, 500 to 3,465 children were eligible, and 65% to 79% had attended a French-language school. There was at least 1 French-language school in each of these 2 CSDs.
The size and colour of the circles were determined using the values from the table below.
| Census subdivision | Children eligible for instruction in French | Eligible children who attended a French-language school | French-language schools |
|---|---|---|---|
| Code | Number | Percentage | Number |
| 4711066 | 3465 | 63.5 | 1 or more |
| 4706027 | 3030 | 71.8 | 1 or more |
| 4715066 | 570 | 65.8 | 1 or more |
| 4707039 | 375 | 61.3 | 1 or more |
| 4716029 | 280 | 71.4 | 1 or more |
| 4717029 | 195 | 74.4 | 0 |
| 4708004 | 140 | 53.6 | 0 |
| 4711068 | 135 | 33.3 | 0 |
| 4711070 | 130 | 38.5 | 0 |
| 4711065 | 120 | 54.2 | 0 |
| 4715057 | 90 | 77.8 | 1 or more |
| 4712079 | 85 | 70.6 | 0 |
| 4702047 | 80 | 43.8 | 0 |
| 4709012 | 70 | 42.9 | 0 |
| 4701024 | 60 | 50 | 0 |
| 4715094 | 60 | 50 | 0 |
| 4706029 | 55 | 45.5 | 0 |
| 4706030 | 55 | 45.5 | 0 |
| 4715008 | 55 | 45.5 | 0 |
| 4715014 | 55 | 72.7 | 0 |
| 4715064 | 50 | 70 | 0 |
| 4703071 | 45 | 66.7 | 1 or more |
| 4715017 | 45 | 100 | 1 or more |
| 4712054 | 40 | 50 | 0 |
| 4715018 | 40 | 62.5 | 0 |
| 4718041 | 40 | 37.5 | 0 |
| 4701049 | 35 | 85.7 | 0 |
| 4717028 | 35 | 42.9 | 0 |
| 4711061 | 30 | 33.3 | 0 |
| 4715061 | 30 | 83.3 | 0 |
| 4716051 | 30 | 50 | 0 |
- In 2021, 11,720 school-aged children were eligible for instruction in French in Saskatchewan, including 3,470 in Saskatoon, 3,030 in Regina, 570 in Prince Albert and 375 in Moose Jaw.
- In Saskatchewan, 60% of eligible school-aged children were attending or had attended a French-language school in Canada. This proportion was higher in Moose Jaw (61%), Saskatoon (64%), Prince Albert (66%) and Regina (72%).
- All eligible children in Vonda attended a French-language school, as did more than three-quarters of eligible children in St. Louis No. 431 (78%), Duck Lake No. 463 (83%) and Redvers (86%). However, fewer than two in five eligible children in Martensville (39%), La Ronge (38%), Warman (33%) and Dundurn No. 314 (33%) attended a French-language school.
- In Saskatchewan, 4,725 eligible school-aged children had never attended a French-language school in Canada. The municipalities with the highest number of eligible children who had never attended a French-language school were Saskatoon (1,265 children), Regina (855), Prince Albert (195), Moose Jaw (145) and Warman (90).
Description for Map 10
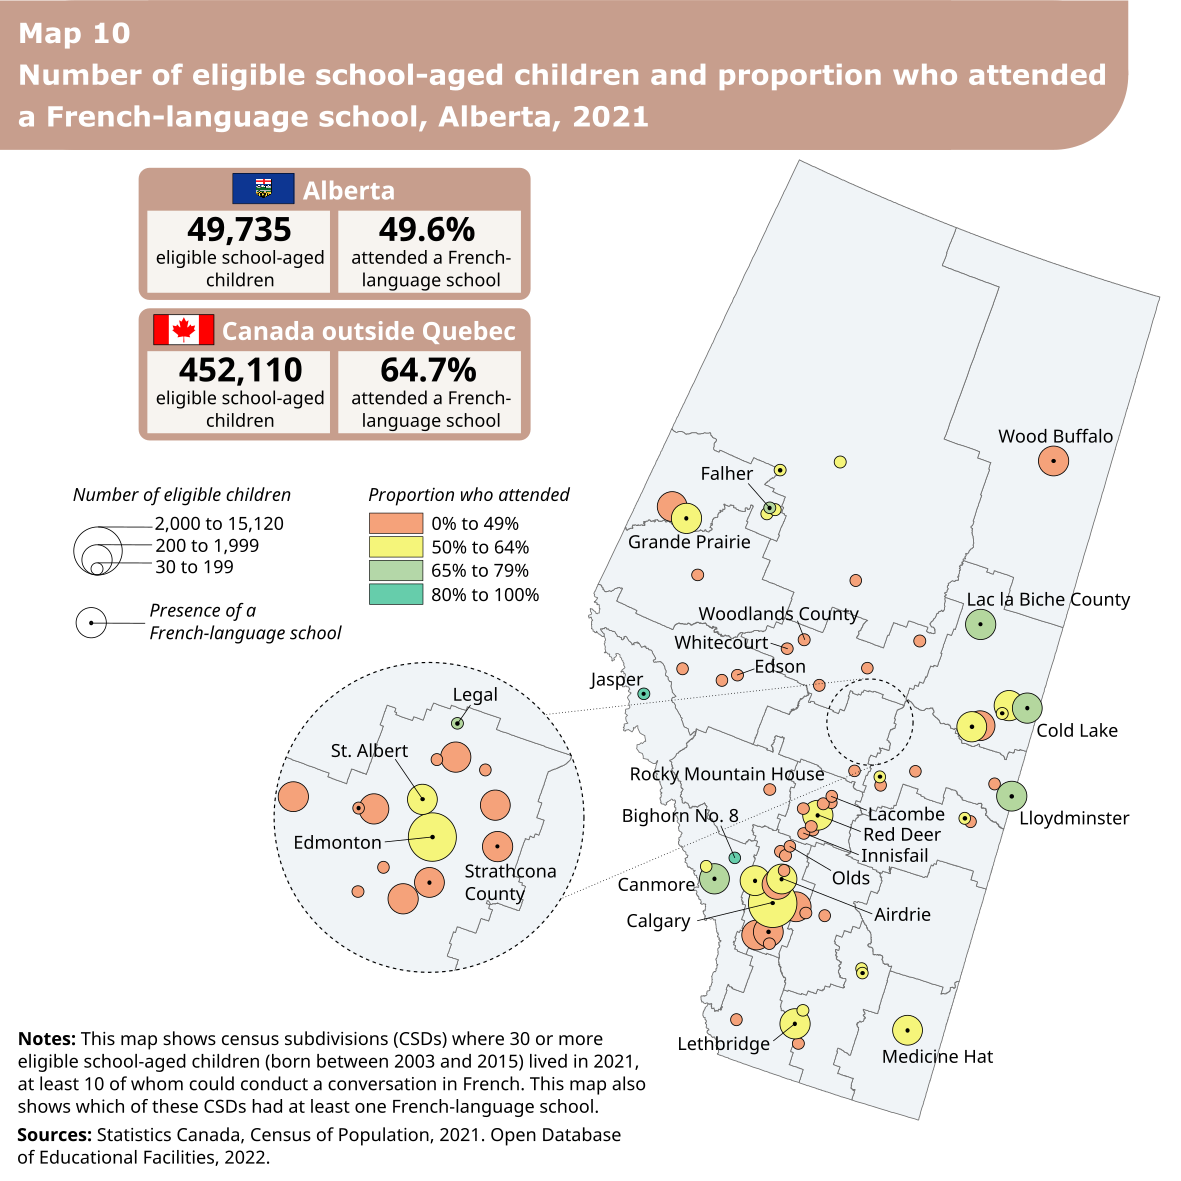
This map shows the number of school-aged children eligible for instruction in French and the proportion of these children who were attending or had attended a French-language school in Canada, in Alberta’s 82 census subdivisions (CSDs) where 30 or more eligible school-aged children lived in 2021, at least 10 of whom could conduct a conversation in French.
There are two boxes on the map. The first box shows that there were 49,735 eligible school-aged children in Alberta, 49.6% of whom had attended a French-language school. The second box shows that in Canada outside Quebec, there were 452,110 eligible school-aged children, 64.7% of whom had attended a French-language school.
On the map, the CSDs are represented by circles whose size corresponds to the number of eligible school-aged children. The colour of the circles represents the proportion of eligible children who were attending or had attended a French-language school in Canada. Of these CSDs, the ones with at least one French-language school are represented by a dot.
In 37 CSDs, 30 to 199 children were eligible, and 0% to 49% had attended a French-language school. There was at least 1 French-language school in 1 of these CSDs.
In 12 CSDs, 30 to 199 children were eligible, and 50% to 64% had attended a French-language school. There was at least 1 French-language school in 5 of these CSDs.
In 2 CSDs, 30 to 199 children were eligible, and 65% to 79% had attended a French-language school. There was at least 1 French-language school in each of these 2 CSDs.
In 2 CSDs, 30 to 199 children were eligible, and 80% to 100% had attended a French-language school. There was at least 1 French-language school in 1 of these CSDs.
In 14 CSDs, 200 to 1,999 children were eligible, and 0% to 49% had attended a French-language school. There was at least 1 French-language school in 4 of these CSDs.
In 9 CSDs, 200 to 1,999 children were eligible, and 50% to 64% had attended a French-language school. There was at least 1 French-language school in 8 of these CSDs.
In 4 CSDs, 200 to 1,999 children were eligible, and 65% to 79% had attended a French-language school. There was at least 1 French-language school in each of these 4 CSDs.
In 2 CSDs, 2,000 to 15,120 children were eligible, and 50% to 64% had attended a French-language school. There was at least 1 French-language school in each of these 2 CSDs.
The size and colour of the circles were determined using the values from the table below.
| Census subdivision | Children eligible for instruction in French | Eligible children who attended a French-language school | French-language schools |
|---|---|---|---|
| Code | Number | Percentage | Number |
| 4806016 | 15120 | 51.9 | 1 or more |
| 4811061 | 12585 | 53.1 | 1 or more |
| 4811052 | 1405 | 49.8 | 1 or more |
| 4806021 | 1360 | 55.9 | 1 or more |
| 4819012 | 1325 | 64.9 | 1 or more |
| 4811062 | 1175 | 50.6 | 1 or more |
| 4816037 | 1125 | 48.9 | 1 or more |
| 4808011 | 1020 | 51 | 1 or more |
| 4802012 | 710 | 56.3 | 1 or more |
| 4806019 | 560 | 51.8 | 1 or more |
| 4806014 | 520 | 42.3 | 0 |
| 4811049 | 485 | 34 | 0 |
| 4811013 | 480 | 44.8 | 1 or more |
| 4801006 | 475 | 50.5 | 1 or more |
| 4806012 | 455 | 42.9 | 1 or more |
| 4811056 | 415 | 47 | 0 |
| 4811016 | 410 | 31.7 | 0 |
| 4812002 | 395 | 68.4 | 1 or more |
| 4812004 | 360 | 51.4 | 0 |
| 4811059 | 360 | 44.4 | 0 |
| 4819006 | 355 | 43.7 | 0 |
| 4815023 | 335 | 68.7 | 1 or more |
| 4810039 | 325 | 66.2 | 1 or more |
| 4811034 | 305 | 36.1 | 0 |
| 4812014 | 265 | 39.6 | 0 |
| 4806001 | 225 | 28.9 | 0 |
| 4806017 | 225 | 28.9 | 0 |
| 4812037 | 210 | 78.6 | 1 or more |
| 4812018 | 200 | 55 | 1 or more |
| 4811068 | 190 | 36.8 | 0 |
| 4802034 | 185 | 51.4 | 1 or more |
| 4811048 | 170 | 29.4 | 1 or more |
| 4808012 | 155 | 22.6 | 0 |
| 4819041 | 145 | 55.2 | 0 |
| 4819038 | 140 | 60.7 | 1 or more |
| 4812009 | 135 | 51.9 | 1 or more |
| 4808001 | 135 | 29.6 | 0 |
| 4811012 | 135 | 33.3 | 0 |
| 4814019 | 125 | 32 | 0 |
| 4810011 | 120 | 50 | 1 or more |
| 4805018 | 120 | 16.7 | 0 |
| 4806006 | 120 | 41.7 | 0 |
| 4808029 | 115 | 43.5 | 0 |
| 4813001 | 115 | 21.7 | 0 |
| 4813030 | 110 | 13.6 | 0 |
| 4815033 | 110 | 81.8 | 1 or more |
| 4815035 | 110 | 59.1 | 0 |
| 4807054 | 95 | 52.6 | 1 or more |
| 4811069 | 95 | 68.4 | 1 or more |
| 4806028 | 90 | 16.7 | 0 |
| 4814003 | 90 | 22.2 | 0 |
| 4818015 | 85 | 47.1 | 0 |
| 4817026 | 85 | 58.8 | 0 |
| 4813044 | 80 | 31.3 | 0 |
| 4801003 | 75 | 53.3 | 0 |
| 4808031 | 70 | 14.3 | 0 |
| 4811002 | 70 | 21.4 | 0 |
| 4814024 | 70 | 14.3 | 0 |
| 4809015 | 65 | 7.7 | 0 |
| 4813028 | 65 | 30.8 | 0 |
| 4817029 | 65 | 15.4 | 0 |
| 4819046 | 60 | 66.7 | 1 or more |
| 4807049 | 55 | 45.5 | 0 |
| 4810036 | 55 | 36.4 | 0 |
| 4811018 | 55 | 27.3 | 0 |
| 4805012 | 50 | 20 | 0 |
| 4803014 | 45 | 22.2 | 0 |
| 4806026 | 45 | 44.4 | 0 |
| 4806034 | 45 | 11.1 | 0 |
| 4808022 | 45 | 33.3 | 0 |
| 4810001 | 45 | 44.4 | 0 |
| 4810016 | 45 | 33.3 | 0 |
| 4811064 | 45 | 33.3 | 0 |
| 4813029 | 45 | 11.1 | 0 |
| 4802031 | 45 | 55.6 | 0 |
| 4808008 | 40 | 0 | 0 |
| 4802011 | 40 | 62.5 | 0 |
| 4815015 | 40 | 87.5 | 0 |
| 4802008 | 35 | 28.6 | 0 |
| 4806032 | 30 | 33.3 | 0 |
| 4808009 | 30 | 33.3 | 0 |
| 4819044 | 30 | 50 | 0 |
- In 2021, 49,735 school-aged children were eligible for instruction in French in Alberta, including 15,120 in Calgary, 12,585 in Edmonton, 1,405 in Strathcona County, 1,360 in Airdrie, 1,325 in Grande Prairie, 1,175 in St. Albert, 1,125 in Wood Buffalo and 1,020 in Red Deer.
- Half (50%) of all eligible children in Alberta were attending or had attended a French-language school in Canada. This proportion was similar in Wood Buffalo (49%) and in Strathcona County (49.8%), but higher in St. Albert (51%), Red Deer (51%), Calgary (52%), Edmonton (53%), Airdrie (56%) and Grande Prairie (64.9%).
- More than three-quarters of eligible children attended a French-language school in Bighorn No. 8 (88%), Jasper (82%) and Lac la Biche County (79%). However, no eligible children living in Innisfail attended a French-language school, and the proportion of eligible children who attended a French-language school was under 1 in 6 in Rocky Mountain House (8%), Olds (11%), Woodlands County (11%), Whitecourt (14%), Lacombe (14%) and Edson (14%).
- In Alberta, 25,055 eligible school-aged children had never attended a French-language school in Canada. In a few municipalities, 500 or more eligible children had never attended a French-language school. These municipalities are Calgary (7,275 children), Edmonton (5,905), Strathcona County (705), Airdrie (600), St. Albert (580), Wood Buffalo (575) and Red Deer (500).
Description for Map 11
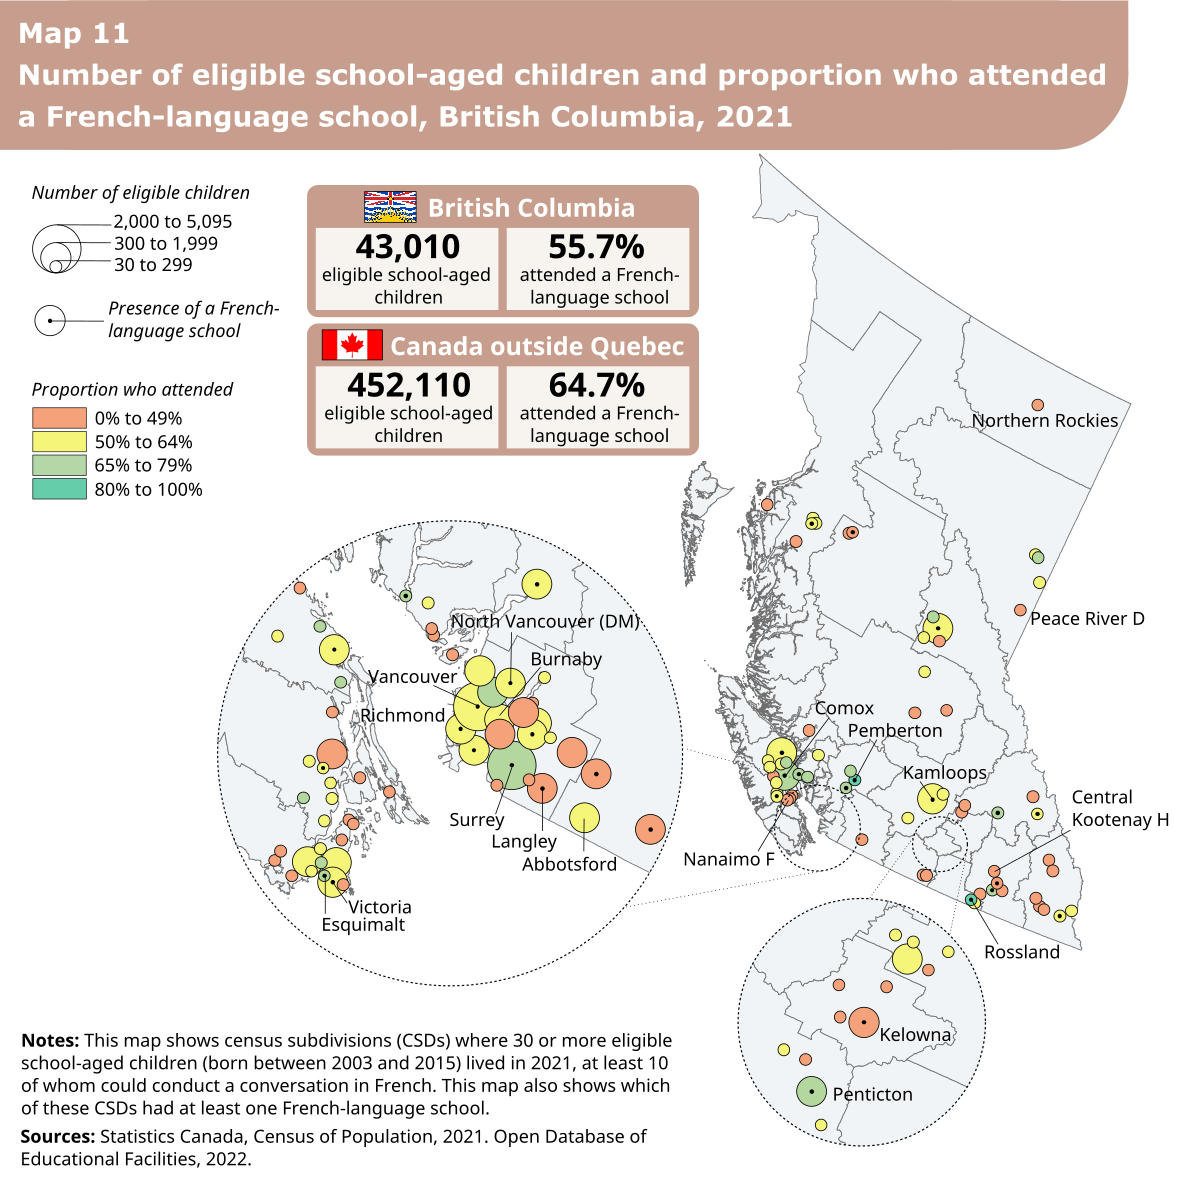
This map shows the number of school-aged children eligible for instruction in French and the proportion of these children who were attending or had attended a French-language school in Canada, in British Columbia’s 134 census subdivisions (CSDs) where 30 or more eligible school-aged children lived in 2021, at least 10 of whom could conduct a conversation in French.
There are two boxes on the map. The first box shows that there were 43,010 eligible school-aged children in British Columbia, 55.7% of whom had attended a French-language school. The second box shows that in Canada outside Quebec, there were 452,110 eligible school-aged children, 64.7% of whom had attended a French-language school.
On the map, the CSDs are represented by circles whose size corresponds to the number of eligible school-aged children. The colour of the circles represents the proportion of eligible children who were attending or had attended a French-language school in Canada. Of these CSDs, the ones with at least one French-language school are represented by a dot.
In 51 CSDs, 30 to 299 children were eligible, and 0% to 49% had attended a French-language school. There was at least 1 French-language school in 2 of these CSDs.
In 36 CSDs, 30 to 299 children were eligible, and 50% to 64% had attended a French-language school. There was at least 1 French-language school in 5 of these CSDs.
In 15 CSDs, 30 to 299 children were eligible, and 65% to 79% had attended a French-language school. There was at least 1 French-language school in 6 of these CSDs.
In 2 CSDs, 30 to 299 children were eligible, and 80% to 100% had attended a French-language school. There was at least 1 French-language school in each of these 2 CSDs.
In 8 CSDs, 300 to 1,999 children were eligible, and 0% to 49% had attended a French-language school. There was at least 1 French-language school in 4 of these CSDs.
In 17 CSDs, 300 to 1,999 children were eligible, and 50% to 64% had attended a French-language school. There was at least 1 French-language school in 10 of these CSDs.
In 3 CSDs, 300 to 1,999 children were eligible, and 65% to 79% had attended a French-language school. There was at least 1 French-language school in 2 of these CSDs.
In 1 CSD, 2,000 to 5,095 children were eligible, and 50% to 64% had attended a French-language school. There was at least 1 French-language school in this CSD.
In 1 CSD, 2,000 to 5,095 children were eligible, and 65% to 79% had attended a French-language school. There was at least 1 French-language school in this CSD.
The size and colour of the circles were determined using the values from the table below.
| Census subdivision | Children eligible for instruction in French | Eligible children who attended a French-language school | French-language schools |
|---|---|---|---|
| Code | Number | Percentage | Number |
| 5915022 | 5095 | 64.6 | 1 or more |
| 5915004 | 5045 | 66 | 1 or more |
| 5915025 | 1445 | 60.2 | 0 |
| 5915015 | 1365 | 64.1 | 1 or more |
| 5915046 | 1290 | 58.9 | 1 or more |
| 5935010 | 1280 | 48 | 1 or more |
| 5909052 | 1210 | 53.3 | 0 |
| 5915034 | 1170 | 59 | 0 |
| 5921007 | 1080 | 56.5 | 1 or more |
| 5915001 | 1075 | 46 | 1 or more |
| 5915011 | 995 | 54.8 | 1 or more |
| 5917021 | 945 | 54 | 0 |
| 5933042 | 840 | 61.3 | 1 or more |
| 5909020 | 760 | 39.5 | 1 or more |
| 5915075 | 730 | 45.9 | 0 |
| 5915055 | 680 | 62.5 | 0 |
| 5953023 | 665 | 57.1 | 1 or more |
| 5917044 | 635 | 57.5 | 0 |
| 5917034 | 610 | 50 | 1 or more |
| 5915039 | 555 | 62.2 | 1 or more |
| 5915051 | 555 | 65.8 | 0 |
| 5937014 | 500 | 63 | 0 |
| 5924034 | 480 | 63.5 | 1 or more |
| 5915029 | 445 | 44.9 | 0 |
| 5931006 | 415 | 55.4 | 1 or more |
| 5909056 | 360 | 47.2 | 1 or more |
| 5907041 | 360 | 69.4 | 1 or more |
| 5919008 | 355 | 47.9 | 0 |
| 5926005 | 350 | 71.4 | 1 or more |
| 5915043 | 345 | 44.9 | 0 |
| 5917041 | 295 | 54.2 | 0 |
| 5926010 | 270 | 53.7 | 0 |
| 5935029 | 265 | 34 | 0 |
| 5955034 | 245 | 51 | 0 |
| 5917040 | 240 | 79.2 | 1 or more |
| 5917030 | 220 | 36.4 | 0 |
| 5903015 | 210 | 66.7 | 1 or more |
| 5917052 | 205 | 34.1 | 0 |
| 5931020 | 200 | 65 | 1 or more |
| 5927008 | 200 | 67.5 | 1 or more |
| 5949011 | 190 | 63.2 | 1 or more |
| 5915070 | 175 | 51.4 | 0 |
| 5939019 | 165 | 66.7 | 1 or more |
| 5939032 | 165 | 30.3 | 0 |
| 5915002 | 165 | 45.5 | 0 |
| 5937010 | 160 | 46.9 | 0 |
| 5923008 | 145 | 62.1 | 1 or more |
| 5917015 | 145 | 37.9 | 0 |
| 5947012 | 130 | 30.8 | 0 |
| 5901012 | 125 | 52 | 1 or more |
| 5919046 | 125 | 68 | 0 |
| 5926022 | 120 | 66.7 | 0 |
| 5917047 | 120 | 66.7 | 0 |
| 5901022 | 120 | 37.5 | 0 |
| 5933006 | 115 | 56.5 | 0 |
| 5917027 | 115 | 17.4 | 0 |
| 5915007 | 115 | 43.5 | 0 |
| 5915020 | 115 | 60.9 | 0 |
| 5929011 | 105 | 66.7 | 1 or more |
| 5935016 | 105 | 19 | 0 |
| 5905023 | 105 | 85.7 | 1 or more |
| 5926024 | 100 | 50 | 0 |
| 5949005 | 95 | 26.3 | 0 |
| 5941009 | 95 | 36.8 | 0 |
| 5901028 | 95 | 21.1 | 0 |
| 5931012 | 90 | 83.3 | 1 or more |
| 5955014 | 80 | 62.5 | 0 |
| 5917010 | 75 | 40 | 0 |
| 5917005 | 75 | 40 | 0 |
| 5926014 | 70 | 42.9 | 0 |
| 5921032 | 70 | 14.3 | 0 |
| 5919043 | 70 | 64.3 | 0 |
| 5907035 | 70 | 42.9 | 0 |
| 5903043 | 65 | 46.2 | 1 or more |
| 5919021 | 65 | 38.5 | 0 |
| 5941013 | 60 | 50 | 0 |
| 5921010 | 60 | 66.7 | 0 |
| 5903045 | 60 | 16.7 | 0 |
| 5951051 | 55 | 36.4 | 0 |
| 5939011 | 55 | 27.3 | 0 |
| 5937021 | 55 | 63.6 | 0 |
| 5931017 | 55 | 72.7 | 0 |
| 5919051 | 55 | 54.5 | 0 |
| 5919049 | 55 | 63.6 | 0 |
| 5903052 | 55 | 9.1 | 0 |
| 5939007 | 50 | 50 | 1 or more |
| 5949013 | 50 | 50 | 0 |
| 5929005 | 50 | 40 | 0 |
| 5926021 | 50 | 50 | 0 |
| 5921023 | 50 | 40 | 0 |
| 5924042 | 50 | 60 | 0 |
| 5921018 | 50 | 30 | 0 |
| 5917054 | 50 | 40 | 0 |
| 5917042 | 50 | 30 | 0 |
| 5915062 | 50 | 20 | 0 |
| 5901035 | 50 | 20 | 0 |
| 5919012 | 45 | 55.6 | 1 or more |
| 5935020 | 45 | 44.4 | 0 |
| 5929026 | 45 | 44.4 | 0 |
| 5955042 | 45 | 66.7 | 0 |
| 5929024 | 45 | 55.6 | 0 |
| 5921034 | 45 | 22.2 | 0 |
| 5907028 | 45 | 44.4 | 0 |
| 5951043 | 40 | 25 | 1 or more |
| 5959007 | 40 | 12.5 | 0 |
| 5953044 | 40 | 37.5 | 0 |
| 5953042 | 40 | 50 | 0 |
| 5949018 | 40 | 62.5 | 0 |
| 5937801 | 40 | 50 | 0 |
| 5927010 | 40 | 50 | 0 |
| 5923037 | 40 | 50 | 0 |
| 5909032 | 40 | 37.5 | 0 |
| 5903041 | 40 | 37.5 | 0 |
| 5901039 | 40 | 37.5 | 0 |
| 5955021 | 35 | 14.3 | 0 |
| 5939037 | 35 | 28.6 | 0 |
| 5927016 | 35 | 71.4 | 0 |
| 5917029 | 35 | 28.6 | 0 |
| 5941014 | 30 | 33.3 | 0 |
| 5937017 | 30 | 50 | 0 |
| 5933044 | 30 | 50 | 0 |
| 5953038 | 30 | 66.7 | 0 |
| 5924054 | 30 | 33.3 | 0 |
| 5921016 | 30 | 50 | 0 |
| 5919013 | 30 | 50 | 0 |
| 5921008 | 30 | 66.7 | 0 |
| 5917049 | 30 | 50 | 0 |
| 5915038 | 30 | 16.7 | 0 |
| 5907051 | 30 | 50 | 0 |
| 5907047 | 30 | 50 | 0 |
| 5907014 | 30 | 16.7 | 0 |
| 5901046 | 30 | 16.7 | 0 |
| 5905014 | 30 | 50 | 0 |
| 5901017 | 30 | 50 | 0 |
- In 2021, 43,010 school-aged children were eligible for instruction in French in British Columbia, including 5,095 in Vancouver, 5,045 in Surrey, 1,445 in Burnaby, 1,365 in Richmond, 1,290 in North Vancouver (District municipality), 1,280 in Kelowna and 1,210 in Abbotsford.
- Just under three in five (56%) eligible children in British Columbia were attending or had attended a French-language school in Canada. This proportion was lower in Kelowna (48%) and Abbotsford (53%), but higher in North Vancouver (District municipality) (59%), Burnaby (60%), Richmond (64%), Vancouver (64.6%) and Surrey (66%).
- More than three-quarters of eligible children in Esquimalt (79%), Pemberton (83%) and Rossland (86%) attended a French-language school. Conversely, the proportion of eligible children who attended a French-language school was under 1 in 6 children in Central Kootenay H (9%), Northern Rockies (13%), Peace River D (14%) and Nanaimo F (14%).
- In British Columbia, 19,050 eligible school-aged children had never attended a French-language school in Canada. More than 500 eligible children in Vancouver (1,805 children), Surrey (1,715), Kelowna (665), Langley (580), Burnaby (575), Abbotsford (565) and North Vancouver (District municipality) (530) had never attended a French-language school.
Description for Map 12
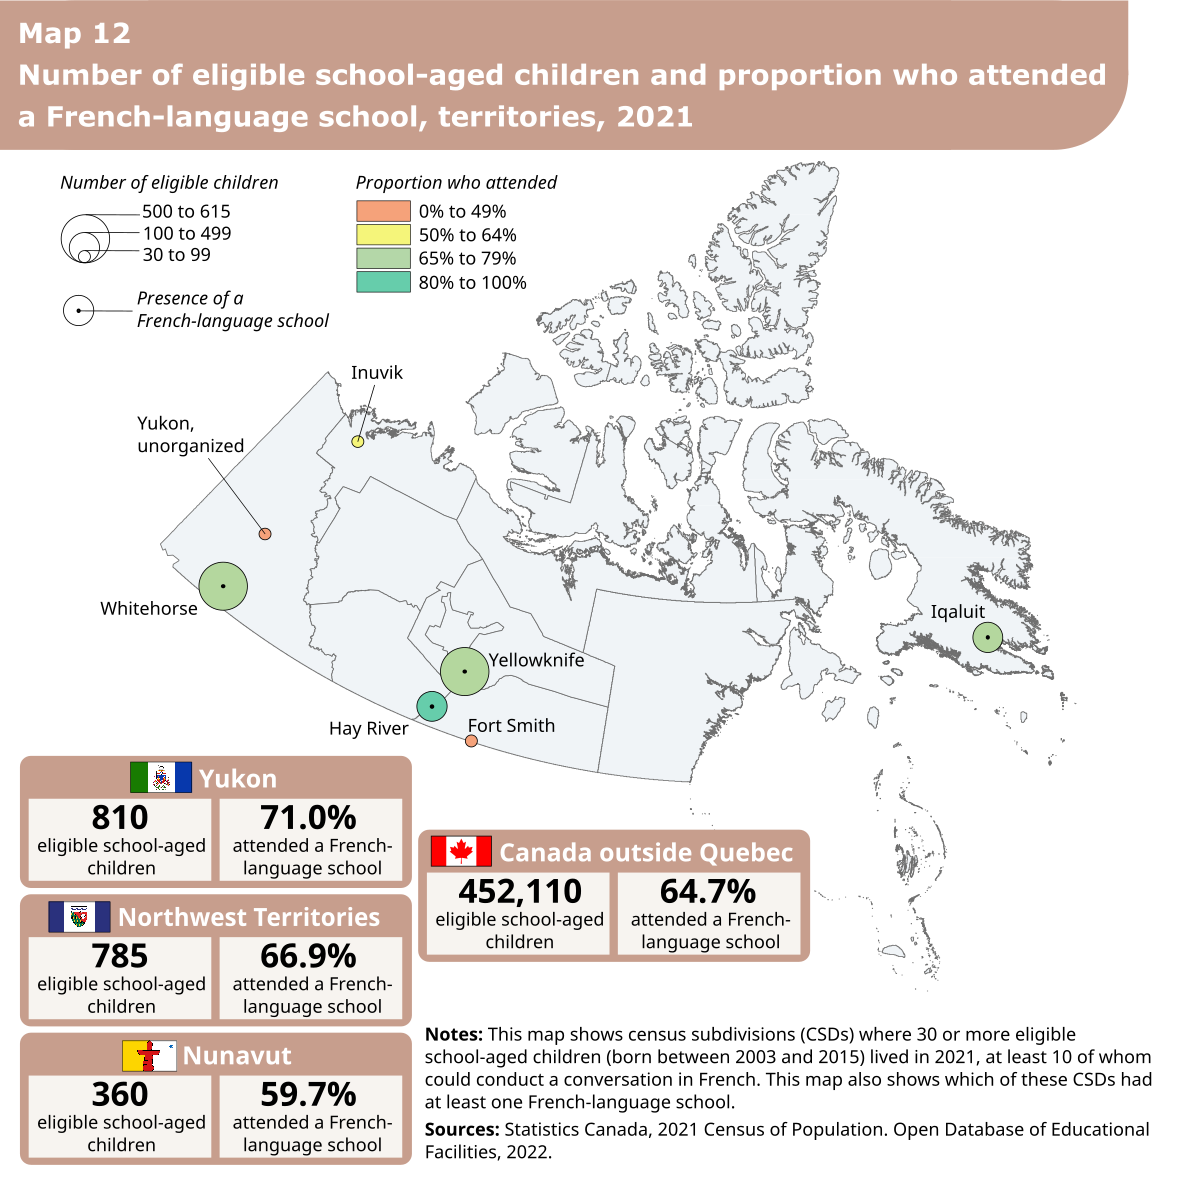
This map shows the number of school-aged children eligible for instruction in French and the proportion of these children who were attending or had attended a French-language school in Canada, in the territories’ 7 census subdivisions (CSDs) where 30 or more eligible school-aged children lived in 2021, at least 10 of whom could conduct a conversation in French.
There are four boxes on the map. The first box shows that in Yukon, there were 810 eligible school-aged children, 71.0% of whom had attended a French-language school. The second box shows that in the Northwest Territories, there were 785 eligible school-aged children, 66.9% of whom had attended a French-language school. The third box shows that in Nunavut, there were 360 eligible school-aged children, 59.7% of whom had attended a French-language school. The fourth box shows that in Canada outside Quebec, there were 452,110 eligible school-aged children, 64.7% of whom had attended a French-language school.
On the map, the CSDs are represented by circles whose size corresponds to the number of eligible school-aged children. The colour of the circles represents the proportion of eligible children who were attending or had attended a French-language school in Canada. Of these CSDs, the ones with at least one French-language school are represented by a dot.
In 2 CSDs, 30 to 99 children were eligible, and 0% to 49% had attended a French-language school. There were no French-language schools in these CSDs.
In 1 CSDs, 30 to 99 children were eligible, and 50% to 64% had attended a French-language school. There were no French-language schools in this CSD.
In 1 CSD, 100 to 499 children were eligible, and 65% to 79% had attended a French-language school. There was at least 1 French-language school in this CSD.
In 1 CSD, 100 to 499 children were eligible, and 80% to 100% had attended a French-language school. There was at least 1 French-language school in this CSD.
In 2 CSDs, 500 to 615 children were eligible, and 65% to 79% had attended a French-language school. There was at least 1 French-language school in each of these 2 CSDs.
The size and colour of the circles were determined using the values from the table below.
| Census subdivision | Children eligible for instruction in French | Eligible children who attended a French-language school | French-language schools |
|---|---|---|---|
| Code | Number | Percentage | Number |
| 6001009 | 615 | 76.4 | 1 or more |
| 6106023 | 560 | 70.5 | 1 or more |
| 6204003 | 220 | 72.7 | 1 or more |
| 6105016 | 105 | 85.7 | 1 or more |
| 6001045 | 40 | 25 | 0 |
| 6105001 | 35 | 28.6 | 0 |
| 6101017 | 30 | 50 | 0 |
- In 2021, 810 school-aged children in Yukon were eligible for instruction in French, including 615 in Whitehorse. In the Northwest Territories, there were 785 eligible school-aged children, including 565 in Yellowknife. Lastly, 360 eligible school-aged children lived in Nunavut, including 220 in Iqaluit.
- The proportion of eligible children who were attending or had attended a French-language school in Canada was 71% in Yukon, 67% in the Northwest Territories and 60% in Nunavut. This proportion was higher in the capital cities: 76% in Whitehorse, 71% in Yellowknife, and 73% in Iqaluit.
- Close to 9 in 10 eligible children had attended a French-language school in Hay River, N.W.T. (86%), but the proportions in the rest of the territory was lower in Fort Smith (29%) and Inuvik (50%), as well as in the unorganized sectors of Yukon (25%).
- The number of eligible school-aged children who had never attended a French-language school in Canada was 235 in Yukon, 260 in the Northwest Territories and 140 in Nunavut. More than 100 eligible school-aged children had never attended a French-language school in Yellowknife (165 children) or Whitehorse (145).
Concepts and definitions
The information presented in this booklet is from the 2021 Census of Population short-form questionnaire. The location of French-language schools was determined using the 2022 Open Database of Educational Facilities.
The 2021 Census results on eligibility for instruction in French at the primary and secondary levels in Canada outside Quebec are based on the criteria in section 23 of the Canadian Charter of Rights and Freedoms. Children are eligible to attend French-language schools when they have at least one parent whose mother tongue is French, at least one parent who attended a French-language primary school in Canada, or the child or their brother or sister attended a French-language primary or secondary school in Canada. The information in this booklet does not account for the criterion of parents’ Canadian citizenship.
School-aged children were between 5 and 17 years of age as of December 31, 2020. They were born between 2003 and 2015.
The proportion of children who attended a French-language school corresponds to the percentage of eligible children aged 5 to 17 who participated or had participated in a regular French program at a French-language school for at least one year. Enrolment in a French-language school may be current at the time of the census or may have been prior to the census. In addition, it may have been in the municipality where the eligible child lived at the time of the 2021 Census or elsewhere in Canada.
“French-language schools” include public schools under a French-language school authority. Some municipalities that have a French-language school are not presented in the maps in this booklet because they did not meet the following criterion: having at least 30 eligible school-aged children, at least 10 of whom can conduct a conversation in French.
The census results are a statistical operationalization of the concept of children eligible for instruction in the minority official language, which has certain limitations. The issue of eligibility is ultimately a legal matter that requires a case-by-case analysis. For more information on this concept and its limitations, consult the Instruction in the Minority Official Language Reference Guide, Census of Population, 2021.
The data products that present results on instruction in the minority official language, by a variety of standardized geographic regions, are available through the Census Profile, highlight tables and data tables. In particular, the table Instruction in the minority official language of eligible school-aged children, by eligibility criterion, age group and level, 2021 provides more information on eligible school-aged children who attended a French-language school in Canada.
- Date modified: