
Ethnicity, Language and Immigration Thematic Series
Key facts on the French language in Ontario in 2021
Skip to text
Text begins
This fact sheet gives an overview of the situation of French in Ontario in 2021. It begins by providing information on the changes in the number and proportion of the population who can have a conversation in French, whose first official language spoken is French, whose mother tongue is French, and who speak French at home or use French at work. Next, it presents information on French‑language instruction in primary and secondary schools, on French spoken among recent and established immigrants, as well as on the mobility and place of birth of individuals whose first official language spoken is French. Additional data on these topics can be found in the appendix.
The information presented in this fact sheet comes from the Census of Population. To learn more about census concepts and the historical comparability of data, please refer to the 2021 Census of Population Languages Reference Guide and the Instruction in the Minority Official Language Reference Guide.
Start of text boxHighlights
- In Ontario, 1,558,670 residents (11.1% of the population) could have a conversation in French. This was the largest number ever observed in a census in the province. In contrast, the demographic weight of these residents was at its lowest level in 50 years.
- In 2021, 594,735 Ontarians (4.2% of the population) spoke French at least regularly at home. This includes all those who spoke French most often at home, whether predominantly (254,870 people, or 1.8% of the population) or equally with other languages (78,385 people, or 0.6%). Moreover, among people with French as one of their mother tongues, two-thirds (66.0%) spoke French regularly at home.
- In Ontario, 301,655 workers (4.6%) used French at least regularly at work. This includes all those who used French most often at work, whether predominantly (80,050 workers, or 1.2%) or equally with other languages (41,390 workers, or 0.6%).
- Roughly 1 in 17 immigrants (6.1%) could have a conversation in French in 2021. This proportion was lower than that of the non-immigrant population (13.5%).
- Around three in five Ontarians (58.7%) whose only first official language spoken was French in 2021 were born in Ontario.
Ability to conduct a conversation in French

Data table for Chart 1
| Knowledge of official languages | 1991 | 1996 | 2001 | 2006 | 2011 | 2016 | 2021 |
|---|---|---|---|---|---|---|---|
| number | |||||||
| French and English | 1,136,245 | 1,234,895 | 1,319,715 | 1,377,330 | 1,395,805 | 1,490,390 | 1,519,365 |
| French only | 54,245 | 46,940 | 42,305 | 49,210 | 42,980 | 40,045 | 39,310 |
| Sources: Statistics Canada, Census of Population, 1991 to 2021. | |||||||
- In 2021, 1,558,670 Ontarians (11.1% of the population) could have a conversation in French. This was the largest number ever recorded in a census in Ontario.
- Almost all (97.5%, or 1,519,365 people) could also do so in English. This number has risen steadily since 1991 (+383,120 people).
- A small proportion of these residents (2.5%, or 39,310 people) could converse in French, but not in English. This was down from 1991 (-14,935 people).
- Following a period of relative stability from 1991 to 2006 (11.9%), the demographic weight of Ontarians who could have a conversation in French fell to 11.3% in 2011. After rising to 11.5% in 2016, this proportion then fell again to 11.1% in 2021. This was the lowest proportion recorded since the 1971 Census.
- From 1991 to 2021, the number and proportion of Ontarians who could have a conversation in French increased among those who first learned English at home in childhood: 555,710 people (7.5%) could have a conversation in French in 1991, and it rose to 747,900 people (8.1%) in 2021.
- Among residents whose mother tongues are neither French nor English, the number of people who could have a conversation in French rose from 1991 to 2021 (+92,875). However, the proportion of people able to speak French among this population fell from 6.5% in 1991 to 5.8% in 2021.

Description for Map 1
This map shows the proportion of the population able to conduct a conversation in French in each census subdivision in the south and the east of Ontario in 2021.
In this map we use 6 distinct colours to signify different values. Grey is used to represent areas for which no data are available. There are 9 census subdivisions in this group.
Teal is used to represent areas in which less than 10% of the population is able to conduct a conversation in French. There are 238 census subdivisions in this group.
Green is used to represent areas in which 10% to less than 20% of the population is able to conduct a conversation in French. There are 32 census subdivisions in this group.
Yellow is used to represent areas in which 20% to less than 40% of the population is able to conduct a conversation in French. There are 7 census subdivisions in this group.
Orange is used to represent areas in which 40% to less than 60% of the population is able to conduct a conversation in French. There are 4 census subdivisions in this group.
Red is used to represent areas in which 60% or more of the population is able to conduct a conversation in French. There are 7 census subdivisions in this group.
The boundaries of census subdivisions have been delimited by a gray line. Their colour was assigned according to the table below.
| Census Subdivision | Population knowing FrenchMap table 1 Note 1 | |
|---|---|---|
| Code | Name | percentage |
| 3502008 | Hawkesbury | 87.3 |
| 3502044 | Casselman | 85.1 |
| 3502023 | Alfred and Plantagenet | 83.9 |
| 3502001 | East Hawkesbury | 82.0 |
| 3502010 | Champlain | 79.7 |
| 3502025 | The Nation | 79.0 |
| 3502036 | Clarence-Rockland | 74.2 |
| 3502048 | Russell | 59.8 |
| 3501050 | North Glengarry | 59.0 |
| 3501005 | South Glengarry | 53.6 |
| 3501042 | North Stormont | 45.0 |
| 3501012 | Cornwall | 39.0 |
| 3506008 | Ottawa | 37.9 |
| 3501011 | South Stormont | 34.0 |
| 3507065 | North Grenville | 23.0 |
| 3501030 | North Dundas | 21.8 |
| 3547076 | Petawawa | 21.6 |
| 3509024 | Beckwith | 20.7 |
| 3509028 | Carleton Place | 18.6 |
| 3507052 | Merrickville-Wolford | 18.5 |
| 3509030 | Mississippi Mills | 17.7 |
| 3543072 | Penetanguishene | 16.9 |
| 3537064 | Lakeshore | 16.1 |
| 3543068 | Tiny | 15.7 |
| 3547075 | Laurentian Valley | 15.1 |
| 3509001 | Montague | 14.0 |
| 3547008 | Greater Madawaska | 14.0 |
| 3547064 | Pembroke | 14.0 |
| 3509039 | Lanark Highlands | 13.9 |
| 3547090 | Laurentian Hills | 13.9 |
| 3510010 | Kingston | 13.6 |
| 3526032 | Welland | 13.4 |
| 3501020 | South Dundas | 12.9 |
| 3547096 | Deep River | 12.8 |
| 3537048 | Tecumseh | 12.6 |
| 3547002 | Arnprior | 12.5 |
| 3507004 | Edwardsburgh/Cardinal | 12.3 |
| 3509010 | Drummond/North Elmsley | 11.5 |
| 3537034 | LaSalle | 11.4 |
| 3547056 | Whitewater Region | 11.4 |
| 3509015 | Tay Valley | 11.2 |
| 3507008 | Prescott | 11.1 |
| 3510005 | Frontenac Islands | 11.1 |
| 3524001 | Oakville | 11.1 |
| 3511005 | Loyalist | 10.8 |
| 3537028 | Amherstburg | 10.7 |
| 3509021 | Perth | 10.6 |
| 3507015 | Brockville | 10.5 |
| 3547003 | McNab/Braeside | 10.5 |
| 3507006 | Augusta | 10.2 |
| 3509004 | Smiths Falls | 9.6 |
| 3547098 | Head, Clara and Maria | 9.3 |
| 3507014 | Elizabethtown-Kitley | 9.1 |
| 3507040 | Rideau Lakes | 9.1 |
| 3543021 | Essa | 9.1 |
| 3547046 | Horton | 9.1 |
| 3512015 | Quinte West | 9.0 |
| 3523008 | Guelph | 8.9 |
| 3519046 | Aurora | 8.8 |
| 3523017 | Erin | 8.8 |
| 3507021 | Leeds and the Thousand Islands | 8.7 |
| 3507024 | Gananoque | 8.7 |
| 3530016 | Waterloo | 8.7 |
| 3547048 | Renfrew | 8.7 |
| 3547070 | North Algona Wilberforce | 8.7 |
| 3520005 | Toronto | 8.6 |
| 3524002 | Burlington | 8.6 |
| 3537039 | Windsor | 8.6 |
| 3518009 | Whitby | 8.4 |
| 3543074 | Midland | 8.4 |
| 3526047 | Niagara-on-the-Lake | 8.2 |
| 3542045 | The Blue Mountains | 8.2 |
| 3507042 | Athens | 8.0 |
| 3526011 | Port Colborne | 8.0 |
| 3507033 | Westport | 7.9 |
| 3510020 | South Frontenac | 7.9 |
| 3515014 | Peterborough | 7.9 |
| 3524009 | Milton | 7.9 |
| 3547035 | Bonnechere Valley | 7.8 |
| 3518029 | Uxbridge | 7.7 |
| 3523009 | Guelph/Eramosa | 7.7 |
| 3524015 | Halton Hills | 7.7 |
| 3513020 | Prince Edward County | 7.6 |
| 3518017 | Clarington | 7.6 |
| 3522012 | Mono | 7.6 |
| 3507017 | Front of Yonge | 7.5 |
| 3518005 | Ajax | 7.5 |
| 3519048 | Newmarket | 7.5 |
| 3538030 | Sarnia | 7.5 |
| 3541024 | Kincardine | 7.5 |
| 3542047 | Meaford | 7.5 |
| 3543031 | Collingwood | 7.5 |
| 3519038 | Richmond Hill | 7.4 |
| 3526028 | Pelham | 7.4 |
| 3541045 | Saugeen Shores | 7.4 |
| 3514021 | Cobourg | 7.3 |
| 3518001 | Pickering | 7.3 |
| 3543009 | Springwater | 7.3 |
| 3539036 | London | 7.2 |
| 3519044 | Whitchurch-Stouffville | 7.1 |
| 3523001 | Puslinch | 7.1 |
| 3514020 | Port Hope | 7.0 |
| 3536020 | Chatham-Kent | 7.0 |
| 3537013 | Kingsville | 7.0 |
| 3537016 | Essex | 6.9 |
| 3544027 | Lake of Bays | 6.9 |
| 3521005 | Mississauga | 6.8 |
| 3544042 | Huntsville | 6.8 |
| 3547043 | Admaston/Bromley | 6.8 |
| 3518020 | Scugog | 6.7 |
| 3519049 | King | 6.7 |
| 3538019 | Petrolia | 6.7 |
| 3542059 | Owen Sound | 6.7 |
| 3544018 | Bracebridge | 6.7 |
| 3510045 | North Frontenac | 6.6 |
| 3518013 | Oshawa | 6.6 |
| 3526053 | St. Catharines | 6.6 |
| 3543042 | Barrie | 6.6 |
| 3514004 | Brighton | 6.5 |
| 3515015 | Selwyn | 6.5 |
| 3537001 | Pelee | 6.5 |
| 3546024 | Dysart et al | 6.5 |
| 3519054 | East Gwillimbury | 6.4 |
| 3522001 | East Garafraxa | 6.4 |
| 3531011 | Stratford | 6.4 |
| 3538015 | Brooke-Alvinston | 6.4 |
| 3515013 | Cavan Monaghan | 6.3 |
| 3523025 | Centre Wellington | 6.3 |
| 3526043 | Niagara Falls | 6.3 |
| 3530013 | Kitchener | 6.3 |
| 3511030 | Stone Mills | 6.2 |
| 3512005 | Belleville | 6.2 |
| 3514019 | Hamilton | 6.2 |
| 3514024 | Alnwick/Haldimand | 6.2 |
| 3519028 | Vaughan | 6.2 |
| 3522014 | Orangeville | 6.1 |
| 3543023 | Oro-Medonte | 6.1 |
| 3511015 | Greater Napanee | 6.0 |
| 3526065 | Grimsby | 6.0 |
| 3538031 | Point Edward | 6.0 |
| 3546018 | Algonquin Highlands | 6.0 |
| 3521024 | Caledon | 5.9 |
| 3522016 | Mulmur | 5.9 |
| 3525005 | Hamilton | 5.9 |
| 3542053 | Georgian Bluffs | 5.9 |
| 3526014 | Wainfleet | 5.8 |
| 3526037 | Thorold | 5.8 |
| 3539033 | Middlesex Centre | 5.8 |
| 3547033 | Killaloe, Hagarty and Richards | 5.8 |
| 3510035 | Central Frontenac | 5.7 |
| 3512051 | Limerick | 5.7 |
| 3515005 | Otonabee-South Monaghan | 5.7 |
| 3515037 | North Kawartha | 5.7 |
| 3543071 | Tay | 5.7 |
| 3522008 | Amaranth | 5.6 |
| 3532042 | Woodstock | 5.6 |
| 3537003 | Leamington | 5.6 |
| 3543064 | Wasaga Beach | 5.6 |
| 3544053 | Muskoka Lakes | 5.6 |
| 3519036 | Markham | 5.5 |
| 3530010 | Cambridge | 5.5 |
| 3534020 | Central Elgin | 5.5 |
| 3542015 | Grey Highlands | 5.4 |
| 3547030 | Madawaska Valley | 5.4 |
| 3538003 | St. Clair | 5.3 |
| 3543017 | Innisfil | 5.3 |
| 3515023 | Douro-Dummer | 5.2 |
| 3519070 | Georgina | 5.2 |
| 3526057 | Lincoln | 5.2 |
| 3526003 | Fort Erie | 5.1 |
| 3543005 | Clearview | 5.1 |
| 3538016 | Enniskillen | 5.0 |
| 3538035 | Plympton-Wyoming | 5.0 |
| 3543052 | Orillia | 5.0 |
| 3534021 | St. Thomas | 4.9 |
| 3546015 | Minden Hills | 4.9 |
| 3529006 | Brantford | 4.8 |
| 3530004 | North Dumfries | 4.8 |
| 3543014 | Bradford West Gwillimbury | 4.8 |
| 3543007 | New Tecumseth | 4.7 |
| 3521010 | Brampton | 4.6 |
| 3541069 | Northern Bruce Peninsula | 4.6 |
| 3543003 | Adjala-Tosorontio | 4.6 |
| 3514014 | Cramahe | 4.5 |
| 3515044 | Trent Lakes | 4.5 |
| 3518039 | Brock | 4.5 |
| 3530020 | Wilmot | 4.5 |
| 3530035 | Woolwich | 4.5 |
| 3541055 | South Bruce Peninsula | 4.5 |
| 3544065 | Georgian Bay | 4.5 |
| 3511035 | Addington Highlands | 4.4 |
| 3512076 | Hastings Highlands | 4.4 |
| 3514045 | Trent Hills | 4.4 |
| 3516010 | Kawartha Lakes | 4.4 |
| 3512020 | Stirling-Rawdon | 4.3 |
| 3540028 | Goderich | 4.3 |
| 3543015 | Severn | 4.3 |
| 3544002 | Gravenhurst | 4.3 |
| 3512001 | Tyendinaga | 4.2 |
| 3512054 | Wollaston | 4.2 |
| 3522010 | Grand Valley | 4.2 |
| 3539015 | Strathroy-Caradoc | 4.2 |
| 3539027 | Thames Centre | 4.2 |
| 3541015 | Huron-Kinloss | 4.2 |
| 3542029 | Hanover | 4.2 |
| 3512048 | Tudor and Cashel | 4.1 |
| 3522021 | Shelburne | 4.1 |
| 3532012 | South-West Oxford | 4.1 |
| 3512030 | Tweed | 4.0 |
| 3534030 | Dutton/Dunwich | 4.0 |
| 3541004 | South Bruce | 4.0 |
| 3542004 | West Grey | 4.0 |
| 3542005 | Southgate | 4.0 |
| 3543019 | Ramara | 4.0 |
| 3512026 | Centre Hastings | 3.9 |
| 3512061 | Bancroft | 3.9 |
| 3515003 | Asphodel-Norwood | 3.9 |
| 3523043 | Minto | 3.9 |
| 3529005 | Brant | 3.9 |
| 3534042 | West Elgin | 3.9 |
| 3531016 | St. Marys | 3.8 |
| 3532018 | Ingersoll | 3.8 |
| 3534024 | Southwold | 3.8 |
| 3539060 | Lucan Biddulph | 3.8 |
| 3541043 | Arran-Elderslie | 3.8 |
| 3542037 | Chatsworth | 3.8 |
| 3512058 | Faraday | 3.7 |
| 3512065 | Carlow/Mayo | 3.7 |
| 3514027 | Alderville First Nation | 3.7 |
| 3532027 | Zorra | 3.7 |
| 3541032 | Brockton | 3.7 |
| 3526021 | West Lincoln | 3.5 |
| 3546005 | Highlands East | 3.5 |
| 3547020 | Brudenell, Lyndoch and Raglan | 3.5 |
| 3538043 | Warwick | 3.4 |
| 3539002 | Newbury | 3.4 |
| 3528052 | Norfolk County | 3.3 |
| 3531013 | Perth South | 3.3 |
| 3539047 | Adelaide-Metcalfe | 3.3 |
| 3528018 | Haldimand County | 3.2 |
| 3532038 | East Zorra-Tavistock | 3.2 |
| 3532045 | Blandford-Blenheim | 3.2 |
| 3538040 | Lambton Shores | 3.2 |
| 3515030 | Havelock-Belmont-Methuen | 3.1 |
| 3530027 | Wellesley | 3.1 |
| 3532004 | Tillsonburg | 3.1 |
| 3536029 | Moravian 47 | 3.1 |
| 3538018 | Oil Springs | 3.1 |
| 3539005 | Southwest Middlesex | 3.1 |
| 3540025 | Central Huron | 3.1 |
| 3547037 | Pikwakanagan (Golden Lake 39) | 3.1 |
| 3512046 | Marmora and Lake | 3.0 |
| 3512002 | Deseronto | 2.9 |
| 3515019 | Curve Lake First Nation 35 | 2.8 |
| 3538007 | Dawn-Euphemia | 2.8 |
| 3540010 | Bluewater | 2.8 |
| 3539041 | North Middlesex | 2.7 |
| 3523033 | Mapleton | 2.6 |
| 3532002 | Norwich | 2.6 |
| 3512036 | Madoc | 2.5 |
| 3523050 | Wellington North | 2.5 |
| 3534011 | Aylmer | 2.5 |
| 3540063 | Ashfield-Colborne-Wawanosh | 2.5 |
| 3519076 | Chippewas of Georgina Island First Nation | 2.2 |
| 3522019 | Melancthon | 2.2 |
| 3543069 | Christian Island 30 | 2.2 |
| 3531030 | Perth East | 2.1 |
| 3531040 | North Perth | 2.1 |
| 3540005 | South Huron | 2.1 |
| 3531025 | West Perth | 2.0 |
| 3534005 | Bayham | 2.0 |
| 3534010 | Malahide | 2.0 |
| 3540040 | Huron East | 1.9 |
| 3540055 | North Huron | 1.8 |
| 3540046 | Howick | 1.7 |
| 3541060 | Neyaashiinigmiing 27 | 1.7 |
| 3538056 | Kettle Point 44 | 1.6 |
| 3540050 | Morris-Turnberry | 1.6 |
| 3515008 | Hiawatha First Nation | 1.5 |
| 3512004 | Tyendinaga Mohawk Territory | 1.4 |
| 3541057 | Saugeen 29 | 1.3 |
| 3543050 | Chippewas of Rama First Nation | 1.0 |
| 3538025 | Sarnia 45 | 0.8 |
| 3518022 | Mississaugas of Scugog Island | 0.0 |
| 3528035 | New Credit (Part) 40A | 0.0 |
| 3529021 | New Credit (Part) 40A | 0.0 |
| 3539018 | Munsee-Delaware Nation 1 | 0.0 |
| 3544073 | Moose Point 79 | 0.0 |
|
||

Description for Map 2
This map shows the proportion of the population able to conduct a conversation in French in each census subdivision in the north of Ontario in 2021.
In this map we use 6 distinct colours to signify different values. Grey is used to represent areas for which no data are available. There are 29 census subdivisions in this group.
Teal is used to represent areas in which less than 10% of the population is able to conduct a conversation in French. There are 170 census subdivisions in this group.
Green is used to represent areas in which 10% to less than 20% of the population is able to conduct a conversation in French. There are 21 census subdivisions in this group.
Yellow is used to represent areas in which 20% to less than 40% of the population is able to conduct a conversation in French. There are 33 census subdivisions in this group.
Orange is used to represent areas in which 40% to less than 60% of the population is able to conduct a conversation in French. There are 16 census subdivisions in this group.
Red is used to represent areas in which 60% or more of the population is able to conduct a conversation in French. There are 11 census subdivisions in this group.
The boundaries of census subdivisions have been delimited by a gray line. Their colour was assigned according to the table below.
| Census Subdivision | Population knowing FrenchMap table 2 Note 1 | |
|---|---|---|
| Code | Name | percentage |
| 3556077 | Mattice-Val Côté | 96.3 |
| 3556076 | Hearst | 93.2 |
| 3557079 | Dubreuilville | 90.4 |
| 3556056 | Moonbeam | 79.7 |
| 3556070 | Val Rita-Harty | 79.6 |
| 3556066 | Kapuskasing | 77.6 |
| 3556052 | Fauquier-Strickland | 75.3 |
| 3556048 | Smooth Rock Falls | 71.5 |
| 3548055 | Nipissing Ouest | 68.5 |
| 3556073 | Opasatika | 67.5 |
| 3554036 | Armstrong | 64.6 |
| 3556092 | Cochrane, Unorganized, North Part | 59.1 |
| 3554029 | Casey | 52.9 |
| 3552004 | St.-Charles | 52.6 |
| 3556031 | Iroquois Falls | 52.5 |
| 3554058 | McGarry | 51.7 |
| 3556042 | Cochrane | 51.7 |
| 3552001 | French River / Rivière des Français | 51.3 |
| 3552092 | Chapleau | 51.0 |
| 3556027 | Timmins | 50.5 |
| 3554014 | Harris | 46.2 |
| 3552013 | Markstay-Warren | 44.6 |
| 3548019 | Mattawan | 43.3 |
| 3554020 | Temiskaming Shores | 42.9 |
| 3554026 | Harley | 42.9 |
| 3552093 | Sudbury, Unorganized, North Part | 41.4 |
| 3548021 | Mattawa | 40.8 |
| 3554038 | Thornloe | 38.9 |
| 3548013 | Papineau-Cameron | 38.6 |
| 3556014 | Black River-Matheson | 37.6 |
| 3553005 | Grand Sudbury | 37.5 |
| 3548034 | East Ferris | 36.7 |
| 3554001 | Coleman | 35.9 |
| 3554062 | Larder Lake | 35.6 |
| 3548027 | Bonfield | 34.5 |
| 3554021 | Hudson | 33.0 |
| 3558075 | Greenstone | 31.1 |
| 3554057 | Matachewan 72 | 30.8 |
| 3557076 | Wawa | 30.7 |
| 3557038 | Blind River | 30.2 |
| 3554066 | Gauthier | 30.0 |
| 3548091 | Nipissing, Unorganized, South Part | 28.6 |
| 3554042 | James | 28.6 |
| 3554034 | Hilliard | 27.9 |
| 3554068 | Kirkland Lake | 27.8 |
| 3554056 | Matachewan | 26.4 |
| 3548094 | Nipissing, Unorganized, North Part | 26.1 |
| 3557040 | The North Shore | 25.5 |
| 3557039 | Spanish | 24.6 |
| 3548044 | North Bay | 24.3 |
| 3554024 | Kerns | 22.7 |
| 3554094 | Timiskaming, Unorganized, West Part | 22.7 |
| 3549066 | Callander | 22.6 |
| 3548073 | Nipissing 10 | 22.3 |
| 3554008 | Cobalt | 21.8 |
| 3552028 | Baldwin | 21.6 |
| 3548031 | Chisholm | 21.3 |
| 3552026 | Espanola | 20.9 |
| 3549077 | Dokis 9 | 20.0 |
| 3556033 | Abitibi 70 | 20.0 |
| 3557041 | Elliot Lake | 19.8 |
| 3548022 | Calvin | 18.9 |
| 3557091 | White River | 18.8 |
| 3558066 | Manitouwadge | 18.8 |
| 3554006 | Latchford | 18.3 |
| 3557096 | Hornepayne | 18.3 |
| 3554049 | Evanturel | 18.0 |
| 3552056 | Chapleau Cree Fox Lake | 16.7 |
| 3548069 | Temagami | 16.3 |
| 3552031 | Nairn and Hyman | 16.0 |
| 3558059 | Marathon | 15.7 |
| 3551021 | Billings | 14.6 |
| 3552052 | Mattagami 71 | 14.3 |
| 3554032 | Brethour | 14.3 |
| 3552023 | Sables-Spanish Rivers | 13.9 |
| 3554052 | Englehart | 12.5 |
| 3560001 | Ignace | 12.0 |
| 3554054 | Chamberlain | 11.3 |
| 3549060 | Powassan | 11.2 |
| 3558054 | Terrace Bay | 10.4 |
| 3554044 | Charlton and Dack | 10.2 |
| 3558028 | Shuniah | 9.7 |
| 3557061 | Sault Ste. Marie | 9.3 |
| 3557004 | Hilton | 9.2 |
| 3552036 | Killarney | 8.9 |
| 3549071 | Nipissing | 8.8 |
| 3557095 | Algoma, Unorganized, North Part | 8.8 |
| 3557066 | Prince | 8.7 |
| 3557073 | Mississagi River 8 | 8.4 |
| 3551017 | Northeastern Manitoulin and the Islands | 8.1 |
| 3551027 | Gordon/Barrie Island | 8.1 |
| 3557035 | Huron Shores | 8.1 |
| 3558004 | Thunder Bay | 8.1 |
| 3551011 | Assiginack | 8.0 |
| 3553040 | Wahnapitei 11 | 8.0 |
| 3551028 | Burpee and Mills | 7.8 |
| 3560042 | Red Lake | 7.8 |
| 3560010 | Kenora | 7.6 |
| 3551006 | Central Manitoulin | 7.2 |
| 3549076 | French River 13 | 7.1 |
| 3551094 | Manitoulin, Unorganized, West Part | 6.8 |
| 3558012 | Gillies | 6.8 |
| 3557011 | Laird | 6.7 |
| 3560027 | Dryden | 6.7 |
| 3551026 | Gore Bay | 6.6 |
| 3560090 | Kenora, Unorganized | 6.6 |
| 3549032 | Parry Sound | 6.5 |
| 3552054 | Duck Lake 76B | 6.5 |
| 3549036 | Carling | 6.4 |
| 3560021 | Machin | 6.4 |
| 3557001 | Jocelyn | 6.3 |
| 3557021 | Bruce Mines | 6.3 |
| 3558090 | Thunder Bay, Unorganized | 6.2 |
| 3558011 | Oliver Paipoonge | 6.1 |
| 3557019 | Plummer Additional | 6.0 |
| 3557051 | Macdonald, Meredith and Aberdeen Additional | 6.0 |
| 3560032 | Ear Falls | 5.9 |
| 3549096 | Parry Sound, Unorganized, Centre Part | 5.8 |
| 3557072 | Serpent River 7 | 5.8 |
| 3558051 | Schreiber | 5.8 |
| 3559011 | Alberton | 5.8 |
| 3558019 | Conmee | 5.7 |
| 3549028 | McKellar | 5.6 |
| 3549095 | Parry Sound, Unorganized, North East Part | 5.6 |
| 3551001 | Tehkummah | 5.6 |
| 3558001 | Neebing | 5.6 |
| 3549056 | South River | 5.5 |
| 3558044 | Nipigon | 5.5 |
| 3557014 | Tarbutt and Tarbutt Additional | 5.3 |
| 3558034 | Dorion | 5.3 |
| 3549005 | The Archipelago | 5.1 |
| 3558016 | O'Connor | 5.1 |
| 3549078 | Magnetewan 1 | 5.0 |
| 3557006 | Hilton Beach | 5.0 |
| 3552051 | Whitefish Lake 6 | 4.9 |
| 3557008 | St. Joseph | 4.9 |
| 3559042 | Rainy River | 4.8 |
| 3549031 | McDougall | 4.7 |
| 3557016 | Johnson | 4.7 |
| 3557028 | Thessalon | 4.7 |
| 3560034 | Sioux Lookout | 4.7 |
| 3549043 | Magnetawan | 4.6 |
| 3549012 | McMurrich/Monteith | 4.4 |
| 3548072 | Bear Island 1 | 4.2 |
| 3549014 | Perry | 4.2 |
| 3549022 | Burk's Falls | 4.2 |
| 3559090 | Rainy River, Unorganized | 4.2 |
| 3551041 | Sucker Creek 23 | 4.0 |
| 3558061 | Pic Mobert South | 4.0 |
| 3559012 | Fort Frances | 4.0 |
| 3549003 | Seguin | 3.9 |
| 3558041 | Red Rock | 3.9 |
| 3548001 | South Algonquin | 3.8 |
| 3549019 | Armour | 3.8 |
| 3549048 | Sundridge | 3.8 |
| 3551045 | M'Chigeeng 22 | 3.8 |
| 3559001 | Atikokan | 3.8 |
| 3560049 | Pickle Lake | 3.8 |
| 3549018 | Kearney | 3.6 |
| 3549054 | Machar | 3.6 |
| 3558060 | Pic Mobert North | 3.6 |
| 3549046 | Strong | 3.5 |
| 3549024 | Ryerson | 3.4 |
| 3549051 | Joly | 3.4 |
| 3549039 | Whitestone | 3.3 |
| 3549072 | Shawanaga 17 | 3.2 |
| 3551042 | Sheguiandah 24 | 3.2 |
| 3558069 | Rocky Bay 1 | 3.2 |
| 3559016 | La Vallee | 3.2 |
| 3559019 | Emo | 2.9 |
| 3560069 | Rat Portage 38A | 2.9 |
| 3557074 | Garden River 14 | 2.8 |
| 3560008 | Sioux Narrows-Nestor Falls | 2.8 |
| 3560089 | The Dalles 38C | 2.8 |
| 3559040 | Dawson | 2.5 |
| 3560061 | Wabaseemoong | 2.5 |
| 3556106 | Moosonee | 2.3 |
| 3551040 | Whitefish River 4 | 2.2 |
| 3559031 | Morley | 2.0 |
| 3559051 | Big Grassy River 35G | 2.0 |
| 3560024 | Eagle Lake 27 | 2.0 |
| 3559066 | Seine River 23A | 1.9 |
| 3557071 | Sagamok | 1.8 |
| 3559026 | Manitou Rapids 11 | 1.7 |
| 3559047 | Lake of the Woods | 1.6 |
| 3559063 | Couchiching 16A | 1.6 |
| 3558062 | Pic River 50 | 1.4 |
| 3560086 | Summer Beaver | 1.4 |
| 3556093 | Fort Albany (Part) 67 | 1.3 |
| 3559024 | Chapple | 1.3 |
| 3551043 | Wikwemikong Unceded | 1.1 |
| 3558003 | Fort William 52 | 1.0 |
| 3560055 | Osnaburgh 63B | 1.0 |
| 3560004 | Whitefish Bay 32A | 0.8 |
| 3556094 | Factory Island 1 | 0.7 |
| 3556095 | Constance Lake 92 | 0.7 |
| 3560051 | Attawapiskat 91A | 0.6 |
| 3560056 | Lac Seul 28 | 0.5 |
| 3560070 | Deer Lake | 0.5 |
| 3560071 | Sandy Lake 88 | 0.2 |
| 3549073 | Parry Island First Nation | 0.0 |
| 3551044 | Sheshegwaning 20 | 0.0 |
| 3551100 | Zhiibaahaasing 19A | 0.0 |
| 3556102 | New Post 69A | 0.0 |
| 3557026 | Thessalon 12 | 0.0 |
| 3557078 | Gros Cap 49 | 0.0 |
| 3558063 | Pays Plat 51 | 0.0 |
| 3558064 | Lake Helen 53A | 0.0 |
| 3558065 | Gull River 55 | 0.0 |
| 3558067 | Ginoogaming First Nation | 0.0 |
| 3558068 | Long Lake 58 | 0.0 |
| 3558076 | Aroland | 0.0 |
| 3558080 | Ojibway Nation of Saugeen (Savant Lake) | 0.0 |
| 3558085 | Osnaburgh 63A | 0.0 |
| 3558097 | Whitesand | 0.0 |
| 3559053 | Saug-A-Gaw-Sing 1 | 0.0 |
| 3559060 | Neguaguon Lake 25D | 0.0 |
| 3559061 | Rainy Lake 18C | 0.0 |
| 3559064 | Rainy Lake 26A | 0.0 |
| 3559068 | Rainy Lake 17A | 0.0 |
| 3560005 | Whitefish Bay 33A | 0.0 |
| 3560046 | Slate Falls | 0.0 |
| 3560052 | Marten Falls 65 | 0.0 |
| 3560053 | Fort Hope 64 | 0.0 |
| 3560054 | Cat Lake 63C | 0.0 |
| 3560057 | Wabigoon Lake 27 | 0.0 |
| 3560058 | English River 21 | 0.0 |
| 3560059 | Weagamow Lake 87 | 0.0 |
| 3560060 | Northwest Angle 33B | 0.0 |
| 3560063 | Sabaskong Bay 35D | 0.0 |
| 3560064 | Shoal Lake 34B2 | 0.0 |
| 3560065 | Lake of the Woods 37 | 0.0 |
| 3560066 | Kenora 38B | 0.0 |
| 3560067 | Poplar Hill | 0.0 |
| 3560068 | Shoal Lake 39A | 0.0 |
| 3560075 | Kitchenuhmaykoosib Aaki 84 | 0.0 |
| 3560076 | Sachigo Lake 1 | 0.0 |
| 3560078 | Fort Severn 89 | 0.0 |
| 3560079 | Webequie | 0.0 |
| 3560080 | North Spirit Lake | 0.0 |
| 3560082 | Shoal Lake (Part) 40 | 0.0 |
| 3560083 | Whitefish Bay 34A | 0.0 |
| 3560084 | Wabauskang 21 | 0.0 |
| 3560085 | Wunnumin 1 | 0.0 |
| 3560088 | Wapekeka 2 | 0.0 |
| 3560091 | Peawanuck | 0.0 |
| 3560093 | Neskantaga | 0.0 |
| 3560095 | Bearskin Lake | 0.0 |
| 3560096 | Kasabonika Lake | 0.0 |
| 3560098 | Kingfisher Lake 1 | 0.0 |
| 3560104 | Kee-Way-Win | 0.0 |
|
||
- In 2021, in 233 of Ontario’s 539 municipalities,Note less than 5% of the population could conduct a conversation in French. However, in 30 municipalities, 50% or more residents knew French.
- The municipalities with a population of more than 500 that had the highest proportion of people who knew French were all located in northern Ontario: Mattice-Val Côté (96.3%), Hearst (93.2%) and Dubreuilville (90.4%).
- The municipalities that had the highest number of people who knew French were Ottawa (381,310), Toronto (239,470) and Greater Sudbury (61,500).
French as first official language spoken

Data table for Chart 2
| First official language spoken | 1991 | 1996 | 2001 | 2006 | 2011 | 2016 | 2021 |
|---|---|---|---|---|---|---|---|
| number | |||||||
| French only | 483,445 | 480,650 | 489,910 | 497,150 | 500,275 | 504,130 | 484,425 |
| French and English | 52,410 | 62,300 | 75,610 | 80,890 | 84,230 | 92,940 | 98,270 |
| Sources: Statistics Canada, Census of Population, 1991 to 2021. | |||||||
- In 2021, 484,425 Ontarians (3.4% of the population) had French as their only first official language spoken and 98,270 residents (0.7%) had French and English as their first official languages spoken.
- The number of residents with French as their only first official language spoken rose consistently from 1996 to 2016 (+23,480), but then fell from 2016 to 2021 (-19,705).
- From 1991 to 2021, their demographic weight fell steadily from 4.8% to 3.4%.
- In the 2021 Census, the proportion of residents with French as their only first official language spoken was higher in some census agglomerations (CAs) and census metropolitan areas (CMAs) in the northeastern part of the province, such as Timmins (32.4%) and Greater Sudbury (22.7%), as well as in some CAs and CMAs close to the Quebec border, such as HawkesburyNote (74.4%), Cornwall (18.1%) and OttawaNote (14.9%).
- The number of Ontario residents with French and English as their first official languages spoken nearly doubled from 52,410 in 1991 to 98,270 in 2021.
- Of these residents, three-quarters were living in the CMAs of Toronto (49.5%) or Ottawa (27.3%) in 2021.
French as a mother tongue
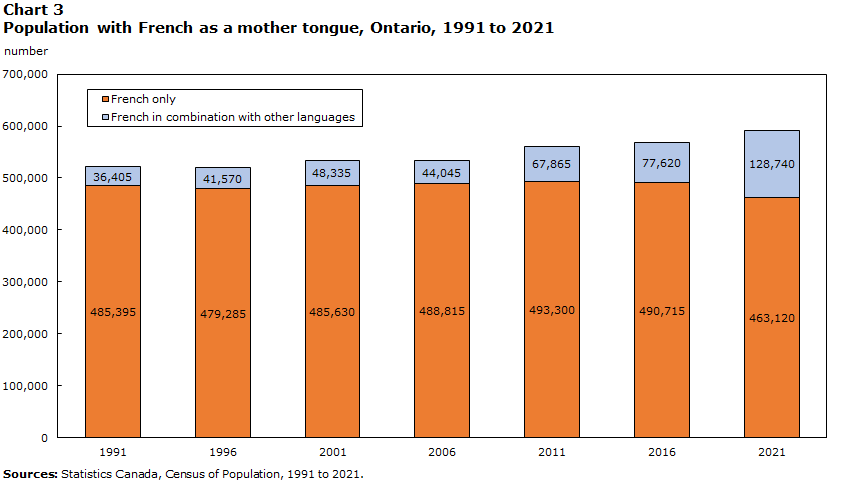
Data table for Chart 3
| Mother tongue | 1991 | 1996 | 2001 | 2006 | 2011 | 2016 | 2021 |
|---|---|---|---|---|---|---|---|
| number | |||||||
| French only | 485,395 | 479,285 | 485,630 | 488,815 | 493,300 | 490,715 | 463,120 |
| French in combination with other languages | 36,405 | 41,570 | 48,335 | 44,045 | 67,865 | 77,620 | 128,740 |
| Sources: Statistics Canada, Census of Population, 1991 to 2021. | |||||||
- In 2021, 591,855 Ontarians (4.2% of the population) had French as one of their mother tongues. While this number varied little from 1991 to 2006 (+11,065 people), it increased steadily from 2006 to 2021 (+58,995 people).
- In 2021, 78.2% of these residents (463,120 people) had French as their only mother tongue, while 21.8% (128,740 people) had French along with other languages.
- The demographic weight of this population fell consistently from 5.2% in 1991 to 4.4% in 2006. After a period of relative stability, it stood at 4.2% in 2021.
- Among married people or common-law partners who had French as one of their mother tongues, almost half (48.2%) were in a relationship with another person whose mother tongue is French.
French spoken at home
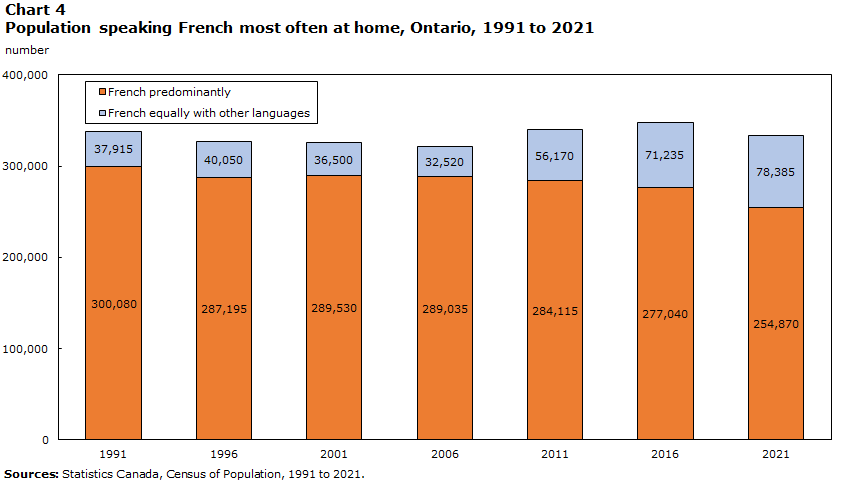
Data table for Chart 4
| Language spoken most often at home | 1991 | 1996 | 2001 | 2006 | 2011 | 2016 | 2021 |
|---|---|---|---|---|---|---|---|
| number | |||||||
| French predominantly | 300,080 | 287,195 | 289,530 | 289,035 | 284,115 | 277,040 | 254,870 |
| French equally with other languages | 37,915 | 40,050 | 36,500 | 32,520 | 56,170 | 71,235 | 78,385 |
| Sources: Statistics Canada, Census of Population, 1991 to 2021. | |||||||
- In 2021, 594,735 Ontarians (4.2% of the population) spoke French at least regularly at home.
- Among these residents, more than half (56.0%, or 333 250 people) spoke French most often at home, predominantly or equally with other languages. Their number declined from 1991 to 2006 (-16,445 people), then rose until 2016 (+26,725 people), before falling again from 2016 to 2021 (-15,030 people).
- Moreover, 261,480 residents (44.0%) spoke French at home as a secondary language while speaking another language more often (generally English).
- Among people with French as their mother tongue, alone or with other languages:
- Two-thirds (66.0%, or 390,830 people) spoke French at least regularly at home in 2021. However, this rate varied by age, ranging from 83.5% among those under age 15 to 59.9% among those aged 45 and older.
- Half (49.9%, or 295,375 people) spoke French most often at home, predominantly or equally with other languages, down from 1991 (61.0%, or 318,500 people).
- Among Ontario residents whose mother tongue is not French, 203,905 (1.5%) spoke French at home at least regularly.
- The vast majority of these residents (81.4%, or 166,025 people) spoke French at home as a secondary language while speaking another language more often.
French used at work

Data table for Chart 5
| Language used most often at work | 2001 | 2006 | 2011 | 2016 | 2021 |
|---|---|---|---|---|---|
| number | |||||
| French predominantly | 77,980 | 85,890 | 82,615 | 82,670 | 80,050 |
| French equally with other languages | 43,265 | 39,105 | 49,005 | 57,970 | 41,390 |
|
Notes: Among workers who were employed during the census reference week. In 2021, changes were made to the census questions regarding languages used at work. Comparisons with previous cycles must therefore be made with caution. For more information, consult the Languages Reference Guide, Census of Population, 2021. Sources: Statistics Canada, Census of Population, 2001, 2006, 2016 and 2021, and the National Household Survey of 2011. |
|||||
- In 2021, 301,655 Ontarians used French at least regularly at work. This represents 4.6% of the province’s workers.Note
- In Ontario, 121,445 people used French most often at work, predominantly or equally with other languages, accounting for 1.9% of the province’s workers.
- The number of workers who used French most often at work rose from 121,245 in 2001 to 140,640 in 2016. It then fell by 19,195 from 2016 to 2021.
- In 2021, among workers who use French at least regularly at work, most worked in public administration (67,070 people, or 22.2%), educational services (52,460 people, or 17.4%), or health care and social assistance (37,870 people, or 12.6%).Note
- Among workers who spoke French most often at home, predominantly or with other languages, 74.5% also used French regularly at work.
- A large proportion of residents (43.2%) who used French regularly at work lived in the Ottawa CMA.
Instruction in French at the primary and secondary levels
- In 2021, 349,875 (12.6%) of the 2,781,415 children under 18 living in the province were eligibleNote for instruction in French at the primary and secondary levels.
- Around 3 in 10 eligible children (29.7%, or 103,835 children) lived in the Toronto CMA.
- Roughly one in four eligible children (23.5%, or 82,355 children) lived in the Ontario part of the Ottawa–Gatineau CMA.
- In Ontario, 769,420 people were attending or had already attended a regular French program in a French-language school in Canada, representing 5.8% of the population aged 5 and older.
- Of those who had never attended a French-language school, 884,120 (6.6%) had instead attended a French immersion program in an English-language school.
- Among school-aged childrenNote who were eligible for instruction in French, 179,995 (67.1%) were attending or had already attended a regular French program in a French-language school in Canada.
French among immigrants
- In 2021, the proportions of recentNote immigrants and establishedNote immigrants living in Ontario who could have a conversation in French (6.2% and 6.0%, respectively) were lower than the proportion of the non-immigrant population (13.5%).
- The proportion of immigrants who spoke French at least regularly at home (2.6%) was lower than the proportion of the non-immigrant population (4.9%).
- The proportion of recent immigrants who had French as their only first official language spoken (2.5%) was higher than the proportion of established immigrants (1.4%), but lower than for the non-immigrant population (4.3%). However, the proportion of immigrants who had French and English as their first official languages spoken (1.3%) was higher than that of the non-immigrant population (0.4%).
- In 2021, nearly 1 in 20 non-permanent residents (4.8%) could have a conversation in French, about 1 in 35 (2,8%) spoke it at least regularly at home and about 1 in 50 (2,1%) had French as their only first official language spoken.
Mobility and birthplace of the French-speaking population

Data table for Chart 6
| Place of birth | Percent |
|---|---|
| Ontario | 58.7 |
| Quebec | 21.2 |
| New Brunswick | 2.3 |
| Elsewhere in Canada | 1.6 |
| Outside Canada | 16.2 |
| Source: Statistics Canada, Census of Population, 2021. | |
- In 2021, among Ontarians whose only first official language spoken is French, around three in five (58.7%, or 280,585 people) were born in the province.
- A quarter (25.1%, or 119,990 people) were born in another province or territory, with large proportions coming from Quebec (21.2%, or 101,150 people) or New Brunswick (2.3%, or 11,000 people).
- Around one in six (16.2%, or 77,285 people) were born abroad, primarily in Africa (8.3%)—especially the Democratic Republic of the Congo (1.7%) and Morocco (0.8%)—in metropolitan France (2.9%) or in Haiti (1.6%).
- From 2016 to 2021, the net interprovincial migration of the Ontario population whose only first official language spoken is French was positive (+470).
- From 2016 to 2021, 23,560 people with French as their only first official language spoken settled in Ontario from another province or territory. The vast majority were from Quebec (76.8%) or Alberta (7.9%). A total of 23,090 people left the province during the same period.
Appendix
| Indicator | 1991 | 1996 | 2001 | 2006 | 2011 | 2016 | 2021 |
|---|---|---|---|---|---|---|---|
| percent | |||||||
| French as first official language spokenTable 1 Note 1 | 5.4 | 5.1 | 5.0 | 4.8 | 4.6 | 4.5 | 4.1 |
| French only | 4.8 | 4.5 | 4.3 | 4.1 | 3.9 | 3.8 | 3.4 |
| French and English | 0.5 | 0.6 | 0.7 | 0.7 | 0.7 | 0.7 | 0.7 |
| Knowledge of FrenchTable 1 Note 2 | 11.9 | 12.0 | 12.1 | 11.9 | 11.3 | 11.5 | 11.1 |
| French only | 0.5 | 0.4 | 0.4 | 0.4 | 0.3 | 0.3 | 0.3 |
| French and English | 11.4 | 11.6 | 11.7 | 11.5 | 11.0 | 11.2 | 10.8 |
| French as mother tongue | 5.2 | 4.9 | 4.7 | 4.4 | 4.4 | 4.3 | 4.2 |
| French only | 4.9 | 4.5 | 4.3 | 4.1 | 3.9 | 3.7 | 3.3 |
| French in combination with other languages | 0.4 | 0.4 | 0.4 | 0.4 | 0.5 | 0.6 | 0.9 |
| French spoken most often at home | 3.4 | 3.1 | 2.9 | 2.7 | 2.7 | 2.6 | 2.4 |
| French predominantly | 3.0 | 2.7 | 2.6 | 2.4 | 2.2 | 2.1 | 1.8 |
| French equally with other languages | 0.4 | 0.4 | 0.3 | 0.3 | 0.4 | 0.5 | 0.6 |
| French used most often at workTable 1 Note 3 | Note ..: not available for a specific reference period | Note ..: not available for a specific reference period | 2.1 | 2.0 | 2.1 | 2.1 | 1.9 |
| French predominantly | Note ..: not available for a specific reference period | Note ..: not available for a specific reference period | 1.4 | 1.4 | 1.3 | 1.3 | 1.2 |
| French equally with other languages | Note ..: not available for a specific reference period | Note ..: not available for a specific reference period | 0.8 | 0.6 | 0.8 | 0.9 | 0.6 |
.. not available for a specific reference period
|
|||||||
| FrequencyTable 2 Note 2 | French used at workTable 2 Note 1 | French spoken at home | ||
|---|---|---|---|---|
| number | percent | number | percent | |
| Total population | 6,492,890 | 100.0 | 14,099,790 | 100.0 |
| Only | 44,040 | 0.7 | 188,560 | 1.3 |
| Mostly | 36,010 | 0.6 | 66,305 | 0.5 |
| Equally | 41,390 | 0.6 | 78,385 | 0.6 |
| Regularly | 180,210 | 2.8 | 261,480 | 1.9 |
| No mention | 6,191,240 | 95.4 | 13,505,055 | 95.8 |
|
||||
| Selection of industry sectors | Use of French at work | |||
|---|---|---|---|---|
| At least regularlyTable 3 Note 2 | Most often | |||
| number | percent | number | percent | |
| Total | 301,655 | 100.0 | 121,445 | 100.0 |
| Construction | 11,950 | 4.0 | 5,850 | 4.8 |
| Manufacturing | 10,485 | 3.5 | 4,485 | 3.7 |
| Retail trade | 21,130 | 7.0 | 7,370 | 6.1 |
| Transportation and warehousing | 9,265 | 3.1 | 3,130 | 2.6 |
| Finance and insurance | 16,315 | 5.4 | 5,400 | 4.4 |
| Professional, scientific and technical services | 20,170 | 6.7 | 5,475 | 4.5 |
| Educational services | 52,460 | 17.4 | 37,600 | 31.0 |
| Health care and social assistance | 37,870 | 12.6 | 15,910 | 13.1 |
| Accommodation and food services | 7,205 | 2.4 | 2,415 | 2.0 |
| Public administration | 67,070 | 22.2 | 16,145 | 13.3 |
| Other sectors | 47,740 | 15.8 | 17,665 | 14.5 |
|
||||
| Age group | Mother tongue | |||||
|---|---|---|---|---|---|---|
| Total | FrenchTable 4 Note 1 | Other languages | ||||
| number | percent | number | percent | number | percent | |
| Total | 594,735 | 4.2 | 390,830 | 66.0 | 203,905 | 1.5 |
| 0 to 14 years | 136,880 | 6.1 | 72,425 | 83.5 | 64,455 | 3.0 |
| 15 to 44 years | 223,505 | 4.1 | 138,055 | 67.7 | 85,445 | 1.6 |
| 45 years and older | 234,350 | 3.7 | 180,345 | 59.9 | 54,005 | 0.9 |
|
||||||
| Immigration status and period of immigration | Knowledge of FrenchTable 5 Note 1 | French spoken at homeTable 5 Note 1 | First official language spoken | |||||
|---|---|---|---|---|---|---|---|---|
| French only | French and English | |||||||
| number | percent | number | percent | number | percent | number | percent | |
| Total | 1,550,545 | 11.1 | 583,210 | 4.2 | 477,860 | 3.4 | 100,405 | 0.7 |
| Non-immigrants | 1,276,985 | 13.5 | 464,155 | 4.9 | 404,010 | 4.3 | 41,185 | 0.4 |
| Immigrants | 255,030 | 6.1 | 108,155 | 2.6 | 65,770 | 1.6 | 55,135 | 1.3 |
| Recent immigrantsTable 5 Note 2 | 36,015 | 6.2 | 20,840 | 3.6 | 14,680 | 2.5 | 9,050 | 1.5 |
| Established immigrantsTable 5 Note 3 | 219,015 | 6.0 | 87,315 | 2.4 | 51,090 | 1.4 | 46,080 | 1.3 |
| 2011 to 2015 | 35,940 | 7.8 | 17,990 | 3.9 | 10,425 | 2.3 | 9,335 | 2.0 |
| 2001 to 2010 | 66,595 | 7.1 | 30,040 | 3.2 | 16,905 | 1.8 | 17,535 | 1.9 |
| 1991 to 2000 | 41,880 | 4.9 | 17,090 | 2.0 | 9,760 | 1.1 | 9,975 | 1.2 |
| 1980 to 1990 | 26,750 | 5.3 | 9,625 | 1.9 | 5,530 | 1.1 | 5,055 | 1.0 |
| Before 1980 | 47,860 | 5.6 | 12,570 | 1.5 | 8,475 | 1.0 | 4,180 | 0.5 |
| Non-permanent residents | 18,530 | 4.8 | 10,905 | 2.8 | 8,085 | 2.1 | 4,095 | 1.1 |
|
||||||||
| Census metropolitan area | Knowledge of FrenchTable 6 Note 1 | French spoken at homeTable 6 Note 1 | First official language spoken | |||||
|---|---|---|---|---|---|---|---|---|
| French only | French and English | |||||||
| number | percent | number | percent | number | percent | number | percent | |
| Total - Province | 1,558,670 | 11.1 | 594,735 | 4.2 | 484,425 | 3.4 | 98,270 | 0.7 |
| Toronto | 461,210 | 7.5 | 141,445 | 2.3 | 69,060 | 1.1 | 48,625 | 0.8 |
| OttawaTable 6 Note 2 | 425,215 | 37.8 | 201,855 | 18.0 | 167,650 | 14.9 | 26,800 | 2.4 |
| Hamilton | 50,630 | 6.5 | 13,135 | 1.7 | 9,255 | 1.2 | 3,110 | 0.4 |
| Kitchener - Cambridge - Waterloo | 36,615 | 6.4 | 8,960 | 1.6 | 5,580 | 1.0 | 2,690 | 0.5 |
| London | 35,735 | 6.6 | 9,705 | 1.8 | 5,790 | 1.1 | 2,475 | 0.5 |
| St. Catharines - Niagara | 31,460 | 7.3 | 9,390 | 2.2 | 10,070 | 2.3 | 1,220 | 0.3 |
| Windsor | 39,915 | 9.5 | 11,535 | 2.8 | 8,905 | 2.1 | 2,505 | 0.6 |
| Oshawa | 30,605 | 7.4 | 8,910 | 2.2 | 6,205 | 1.5 | 1,565 | 0.4 |
| Barrie | 13,600 | 6.4 | 4,050 | 1.9 | 3,300 | 1.6 | 590 | 0.3 |
| Kingston | 21,255 | 12.6 | 6,075 | 3.6 | 5,035 | 3.0 | 675 | 0.4 |
| Greater Sudbury | 63,445 | 37.6 | 32,160 | 19.1 | 38,365 | 22.7 | 1,135 | 0.7 |
| Guelph | 14,355 | 8.7 | 3,100 | 1.9 | 1,765 | 1.1 | 585 | 0.4 |
| Brantford | 6,470 | 4.5 | 1,510 | 1.1 | 1,230 | 0.9 | 245 | 0.2 |
| Peterborough | 9,200 | 7.2 | 1,695 | 1.3 | 1,135 | 0.9 | 180 | 0.1 |
| Thunder Bay | 9,570 | 7.9 | 2,310 | 1.9 | 2,185 | 1.8 | 160 | 0.1 |
| Belleville - Quinte West | 7,930 | 7.2 | 2,640 | 2.4 | 2,560 | 2.3 | 185 | 0.2 |
|
||||||||
- Date modified: