
Ethnicity, Language and Immigration Thematic Series
Key facts on the French language in British Columbia in 2021
Skip to text
Text begins
This fact sheet gives an overview of the situation of French in British Columbia in 2021. It begins by providing information on the changes in the number and proportion of the population who can have a conversation in French, whose first official language spoken is French, whose mother tongue is French, and who speak French at home or use French at work. Next, it presents information on French‑language instruction in primary and secondary schools, on French spoken among recent and established immigrants, as well as on the mobility and place of birth of individuals whose first official language spoken is French. Additional data on these topics can be found in the appendix.
The information presented in this fact sheet comes from the Census of Population. To learn more about census concepts and the historical comparability of data, please refer to the 2021 Census of Population Languages Reference Guide and the Instruction in the Minority Official Language Reference Guide.
Start of text boxHighlights
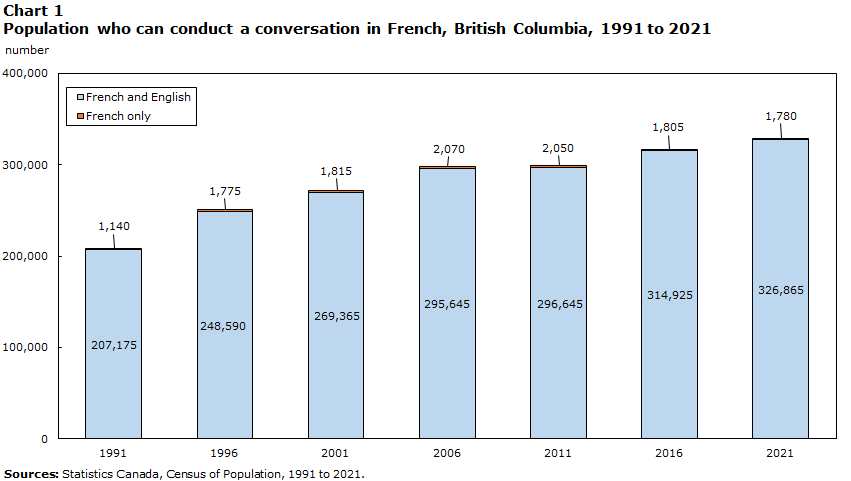
- In 2021, 328,650 British Columbians could conduct a conversation in French. This number is up from 2016 (+11,915) and 1991 (+120,335). The demographic weight of this population rose from 6.4% in 1991 to 7.3% in 2006, before falling over the next 15 years to 6.6% in 2021.
- In 2021, 76,370 people (1.5% of the population) spoke French at least regularly at home. Among those with French as one of their mother tongues, less than half (47.3%) spoke French regularly at home.
- In 2021, 23,340 workers living in the province (1.0%) used French at least regularly at work. Most worked in educational services (32.4%) or public administration (12.3%).
- About 1 in 25 immigrants (4.2%) could have a conversation in French in 2021. This proportion was lower than that of the non-immigrant population (7.9%).
- Nearly two-thirds (63.6%) of British Columbians who had French as their only first official language spoken in 2021 were born in Canada, but outside British Columbia.
Ability to conduct a conversation in French
Data table for Chart 1
| Knowledge of official languages | 1991 | 1996 | 2001 | 2006 | 2011 | 2016 | 2021 |
|---|---|---|---|---|---|---|---|
| number | |||||||
| French and English | 207,175 | 248,590 | 269,365 | 295,645 | 296,645 | 314,925 | 326,865 |
| French only | 1,140 | 1,775 | 1,815 | 2,070 | 2,050 | 1,805 | 1,780 |
| Sources: Statistics Canada, Census of Population, 1991 to 2021. | |||||||
- In 2021, 328,650 British Columbians could have a conversation in French. Almost all (99.5%, or 326,865 people) could also do so in English.
- The number of people in the province who could have a conversation in French has been rising since 1991 (+120,335). From 2016 to 2021, this number continued to increase (+11,915), reaching a record high in 2021.
- In 2021, 6.6% of the British Columbia population could have a conversation in French. This was higher than in 1991 (6.4%), but lower than the all-time high recorded in 2006 (7.3%).
- From 1991 to 2021, the number and proportion of British Columbians able to conduct a conversation in French was up among those who did not learn French first at home in their childhood: while 160,475 (5.0%) could have a conversation in French in 1991, this rose to 258,635 (5.3%) in 2021.
Description for Map 1
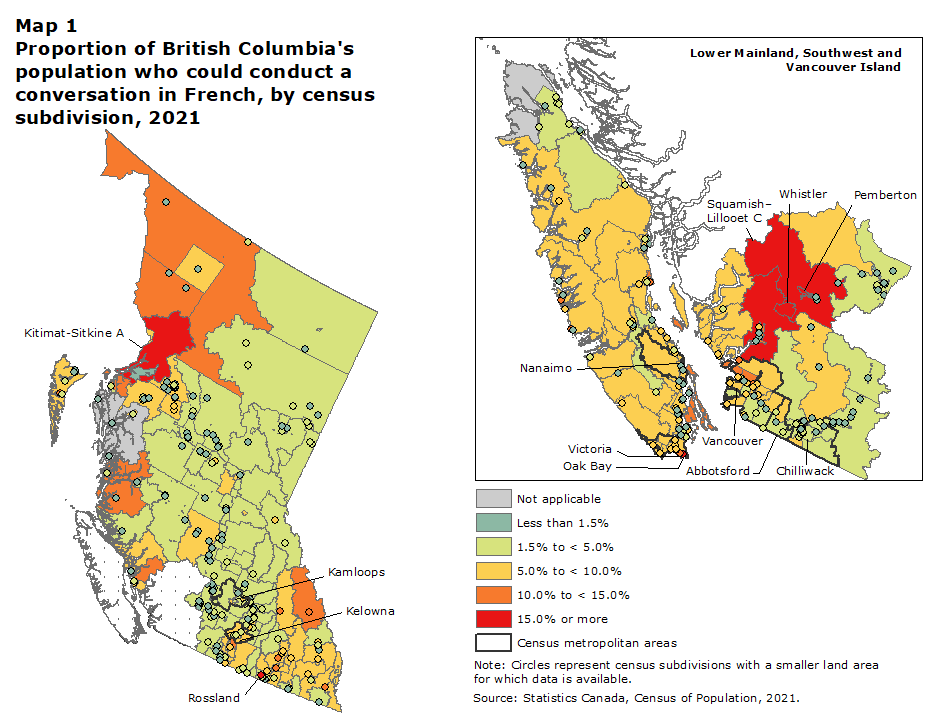
This map shows the proportion of the population able to conduct a conversation in French in each census subdivision in British Columbia in 2021.
In this map we use 6 distinct colours to signify different values. Grey is used to represent areas for which no data are available. There are 214 census subdivisions in this group.
Teal is used to represent areas in which less than 1.5% of the population is able to conduct a conversation in French. There are 159 census subdivisions in this group.
Green is used to represent areas in which 1.5% to less than 5% of the population is able to conduct a conversation in French. There are 191 census subdivisions in this group.
Yellow is used to represent areas in which 5% to less than 10% of the population is able to conduct a conversation in French. There are 148 census subdivisions in this group.
Orange is used to represent areas in which 10% to less than 15% of the population is able to conduct a conversation in French. There are 32 census subdivisions in this group.
Red is used to represent areas in which 15% or more of the population is able to conduct a conversation in French. There are 7 census subdivisions in this group.
The boundaries of census subdivisions have been delimited by a gray line or by circles for those with smaller land area. Their colour was assigned according to the table below.
| Census Subdivision | Population knowing FrenchData Table for Map 1 Note 1 | |
|---|---|---|
| Code | Name | percentage |
| 5949039 | Kitimat-Stikine A | 20.0 |
| 5931012 | Pemberton | 18.9 |
| 5931017 | Squamish-Lillooet C | 16.8 |
| 5931020 | Whistler | 15.9 |
| 5905023 | Rossland | 15.7 |
| 5917030 | Oak Bay | 15.4 |
| 5931021 | Squamish-Lillooet D | 15.2 |
| 5927010 | qathet A | 14.8 |
| 5939011 | Columbia-Shuswap A | 14.4 |
| 5949041 | Kitimat-Stikine D | 14.3 |
| 5923025 | Tofino | 13.5 |
| 5917040 | Esquimalt | 13.4 |
| 5931006 | Squamish | 13.3 |
| 5917034 | Victoria | 13.2 |
| 5926005 | Comox | 13.2 |
| 5939007 | Golden | 13.0 |
| 5903015 | Nelson | 12.9 |
| 5901012 | Fernie | 12.8 |
| 5917027 | Saltspring Island | 12.8 |
| 5915062 | Bowen Island | 12.6 |
| 5907049 | Okanagan-Similkameen E | 12.2 |
| 5915065 | Lions Bay | 12.2 |
| 5949022 | Hazelton | 12.0 |
| 5939019 | Revelstoke | 11.5 |
| 5947026 | Queen Charlotte | 11.5 |
| 5924052 | Strathcona B | 11.3 |
| 5926022 | Comox Valley B (Lazo North) | 11.3 |
| 5947016 | North Coast A | 11.1 |
| 5915046 | North Vancouver | 11.0 |
| 5917029 | Southern Gulf Islands | 10.6 |
| 5957022 | Stikine Region | 10.6 |
| 5903019 | Slocan | 10.5 |
| 5915055 | West Vancouver | 10.5 |
| 5917005 | North Saanich | 10.3 |
| 5945006 | Central Coast A | 10.3 |
| 5915036 | Belcarra | 10.2 |
| 5923019 | Ucluelet | 10.2 |
| 5927020 | qathet E | 10.1 |
| 5921014 | Nanaimo B | 10.0 |
| 5915806 | Burrard Inlet 3 | 9.9 |
| 5929024 | Sunshine Coast D | 9.9 |
| 5907051 | Okanagan-Similkameen F | 9.8 |
| 5926014 | Cumberland | 9.8 |
| 5915020 | Metro Vancouver A | 9.7 |
| 5917015 | Central Saanich | 9.7 |
| 5924054 | Strathcona C | 9.7 |
| 5945014 | Central Coast E | 9.7 |
| 5903043 | Central Kootenay F | 9.5 |
| 5901043 | Canal Flats | 9.4 |
| 5915022 | Vancouver | 9.4 |
| 5915051 | North Vancouver | 9.3 |
| 5903023 | Kaslo | 9.2 |
| 5903039 | Central Kootenay D | 9.2 |
| 5901017 | East Kootenay A | 9.1 |
| 5917052 | Sooke | 9.0 |
| 5926010 | Courtenay | 9.0 |
| 5917021 | Saanich | 8.9 |
| 5924030 | Tahsis | 8.9 |
| 5917047 | View Royal | 8.7 |
| 5917819 | T'Sou-ke | 8.7 |
| 5903052 | Central Kootenay H | 8.6 |
| 5901039 | Invermere | 8.5 |
| 5917054 | Juan de Fuca (Part 1) | 8.5 |
| 5917041 | Colwood | 8.4 |
| 5919043 | Cowichan Valley A | 8.4 |
| 5903041 | Central Kootenay E | 8.3 |
| 5926021 | Comox Valley A | 8.3 |
| 5929005 | Gibsons | 8.3 |
| 5943804 | Fort Rupert 1 | 8.3 |
| 5927016 | qathet C | 8.2 |
| 5931032 | Squamish-Lillooet A | 8.2 |
| 5933045 | Sun Peaks Mountain | 8.2 |
| 5915007 | White Rock | 8.1 |
| 5929028 | Sunshine Coast F | 8.1 |
| 5949013 | Kitimat-Stikine C (Part 1) | 8.1 |
| 5915043 | Port Moody | 8.0 |
| 5917010 | Sidney | 7.9 |
| 5915070 | Pitt Meadows | 7.8 |
| 5947027 | North Coast D | 7.8 |
| 5901037 | East Kootenay E | 7.7 |
| 5947032 | North Coast E | 7.7 |
| 5949038 | Kitimat-Stikine F | 7.7 |
| 5903010 | Central Kootenay A | 7.6 |
| 5915803 | Musqueam 2 | 7.6 |
| 5923035 | Alberni-Clayoquot D | 7.6 |
| 5927018 | qathet D | 7.6 |
| 5939023 | Columbia-Shuswap B | 7.6 |
| 5901046 | East Kootenay F | 7.5 |
| 5903032 | New Denver | 7.5 |
| 5915802 | Tsawwassen | 7.5 |
| 5917044 | Langford | 7.5 |
| 5919049 | Cowichan Valley C | 7.5 |
| 5935010 | Kelowna | 7.5 |
| 5907048 | Okanagan-Similkameen I | 7.4 |
| 5919046 | Cowichan Valley B | 7.4 |
| 5929022 | Sunshine Coast B | 7.4 |
| 5937010 | Coldstream | 7.4 |
| 5939032 | Salmon Arm | 7.4 |
| 5901028 | Kimberley | 7.3 |
| 5907035 | Summerland | 7.3 |
| 5917049 | Highlands | 7.3 |
| 5949028 | Kitimat-Stikine B | 7.3 |
| 5951051 | Bulkley-Nechako A | 7.3 |
| 5935020 | Central Okanagan West | 7.2 |
| 5915029 | New Westminster | 7.1 |
| 5921023 | Qualicum Beach | 7.0 |
| 5924034 | Campbell River | 7.0 |
| 5927008 | Powell River | 7.0 |
| 5941025 | Wells | 7.0 |
| 5921030 | Nanaimo E | 6.9 |
| 5929011 | Sechelt | 6.9 |
| 5937021 | North Okanagan C | 6.9 |
| 5949005 | Kitimat | 6.9 |
| 5917809 | Becher Bay 1 | 6.8 |
| 5921007 | Nanaimo | 6.8 |
| 5921008 | Lantzville | 6.8 |
| 5935016 | Lake Country | 6.8 |
| 5949032 | Stewart | 6.8 |
| 5903027 | Silverton | 6.7 |
| 5915039 | Port Coquitlam | 6.7 |
| 5917042 | Metchosin | 6.7 |
| 5919013 | Cowichan Valley D | 6.7 |
| 5926024 | Comox Valley C (Puntledge- Black Creek) | 6.7 |
| 5951043 | Smithers | 6.7 |
| 5907041 | Penticton | 6.6 |
| 5915038 | Anmore | 6.6 |
| 5923033 | Alberni-Clayoquot B | 6.6 |
| 5924042 | Strathcona D (Oyster Bay- Buttle Lake) | 6.6 |
| 5915011 | Delta | 6.4 |
| 5929018 | Sunshine Coast A | 6.4 |
| 5929026 | Sunshine Coast E | 6.4 |
| 5905054 | Kootenay Boundary E / West Boundary | 6.3 |
| 5917815 | Gordon River 2 | 6.3 |
| 5937014 | Vernon | 6.3 |
| 5949011 | Terrace | 6.3 |
| 5919012 | Duncan | 6.2 |
| 5919021 | Ladysmith | 6.2 |
| 5907026 | Okanagan-Similkameen B | 6.1 |
| 5915034 | Coquitlam | 6.1 |
| 5919017 | Cowichan Valley H | 6.1 |
| 5921034 | Nanaimo G | 6.1 |
| 5951038 | Telkwa | 6.1 |
| 5917812 | New Songhees 1A | 6.0 |
| 5919008 | North Cowichan | 6.0 |
| 5919015 | Cowichan Valley G | 5.9 |
| 5921018 | Parksville | 5.9 |
| 5923047 | Alberni-Clayoquot A | 5.9 |
| 5907028 | Okanagan-Similkameen C | 5.8 |
| 5919051 | Cowichan Valley E | 5.8 |
| 5921016 | Nanaimo C | 5.8 |
| 5924048 | Strathcona A | 5.8 |
| 5949024 | New Hazelton | 5.8 |
| 5907047 | Okanagan-Similkameen D | 5.7 |
| 5915075 | Maple Ridge | 5.7 |
| 5923049 | Alberni-Clayoquot C | 5.7 |
| 5935029 | West Kelowna | 5.7 |
| 5901040 | Radium Hot Springs | 5.6 |
| 5923008 | Port Alberni | 5.6 |
| 5923823 | Esowista 3 | 5.6 |
| 5941041 | Cariboo K | 5.6 |
| 5903045 | Castlegar | 5.5 |
| 5903058 | Central Kootenay J | 5.5 |
| 5907005 | Osoyoos | 5.5 |
| 5915808 | Capilano 5 | 5.5 |
| 5921032 | Nanaimo F | 5.5 |
| 5933042 | Kamloops | 5.5 |
| 5901035 | East Kootenay C | 5.4 |
| 5909048 | Fraser Valley C | 5.4 |
| 5923037 | Alberni-Clayoquot E | 5.4 |
| 5935018 | Peachland | 5.4 |
| 5947023 | Masset | 5.4 |
| 5909035 | Fraser Valley H | 5.3 |
| 5919033 | Cowichan Valley F | 5.3 |
| 5931801 | Cheakamus 11 | 5.3 |
| 5951007 | Vanderhoof | 5.3 |
| 5953042 | Fraser-Fort George C | 5.3 |
| 5903047 | Central Kootenay G | 5.2 |
| 5907022 | Okanagan-Similkameen A | 5.2 |
| 5921010 | Nanaimo A | 5.2 |
| 5953012 | McBride | 5.2 |
| 5927012 | qathet B | 5.1 |
| 5933006 | Merritt | 5.1 |
| 5935012 | Central Okanagan | 5.1 |
| 5949018 | Kitimat-Stikine E | 5.1 |
| 5953023 | Prince George | 5.1 |
| 5909027 | Harrison Hot Springs | 5.0 |
| 5909056 | Mission | 5.0 |
| 5917056 | Juan de Fuca (Part 2) | 5.0 |
| 5935802 | Tsinstikeptum 9 | 5.0 |
| 5915025 | Burnaby | 4.9 |
| 5903050 | Nakusp | 4.8 |
| 5907014 | Oliver | 4.8 |
| 5907053 | Okanagan-Similkameen G | 4.8 |
| 5915001 | Langley | 4.8 |
| 5923039 | Alberni-Clayoquot F | 4.8 |
| 5923803 | Anacla 12 | 4.8 |
| 5933015 | Lytton | 4.8 |
| 5933044 | Thompson | 4.8 |
| 5939045 | Sicamous | 4.8 |
| 5949818 | Sik-e-dakh 2 | 4.8 |
| 5953007 | Valemount | 4.8 |
| 5955014 | Dawson Creek | 4.8 |
| 5955034 | Fort St. John | 4.8 |
| 5901019 | East Kootenay B | 4.7 |
| 5903056 | Central Kootenay I | 4.6 |
| 5915002 | Langley | 4.6 |
| 5919035 | Cowichan Valley I | 4.6 |
| 5933008 | Thompson-Nicola M (Beautiful Nicola Valley-North) | 4.6 |
| 5941005 | One Hundred Mile House | 4.6 |
| 5943031 | Mount Waddington C | 4.6 |
| 5947012 | Prince Rupert | 4.6 |
| 5901048 | East Kootenay G | 4.5 |
| 5909020 | Chilliwack | 4.5 |
| 5915015 | Richmond | 4.5 |
| 5917803 | East Saanich 2 | 4.5 |
| 5919016 | Lake Cowichan | 4.5 |
| 5921036 | Nanaimo H | 4.5 |
| 5933039 | Thompson | 4.5 |
| 5941016 | Cariboo H | 4.5 |
| 5945010 | Central Coast C | 4.5 |
| 5903011 | Salmo | 4.4 |
| 5924025 | Gold River | 4.4 |
| 5927802 | Sliammon 1 | 4.4 |
| 5937017 | North Okanagan B | 4.4 |
| 5947030 | Port Clements | 4.4 |
| 5953019 | Fraser-Fort George H | 4.4 |
| 5901022 | Cranbrook | 4.3 |
| 5909036 | Fraser Valley E | 4.3 |
| 5933070 | Thompson | 4.3 |
| 5943037 | Mount Waddington A | 4.3 |
| 5955840 | Finlay River 6 | 4.3 |
| 5957814 | Liard River 3 | 4.3 |
| 5905030 | Kootenay Boundary B / Lower Columbia-Old-Glory | 4.2 |
| 5933012 | Thompson-Nicola N (Beautiful Nicola Valley-South) | 4.2 |
| 5933019 | Ashcroft | 4.2 |
| 5935803 | Tsinstikeptum 10 | 4.2 |
| 5937041 | North Okanagan F | 4.2 |
| 5939037 | Columbia-Shuswap C | 4.2 |
| 5939044 | Columbia-Shuswap F | 4.2 |
| 5941010 | Cariboo D | 4.2 |
| 5955030 | Taylor | 4.2 |
| 5903017 | Central Kootenay C | 4.1 |
| 5907803 | Penticton 1 | 4.1 |
| 5909052 | Abbotsford | 4.1 |
| 5937803 | Priest's Valley 6 | 4.1 |
| 5955042 | Peace River C | 4.1 |
| 5905018 | Warfield | 4.0 |
| 5905050 | Kootenay Boundary C / Christina Lake | 4.0 |
| 5909014 | Fraser Valley A | 4.0 |
| 5924029 | Zeballos | 4.0 |
| 5931034 | Squamish-Lillooet B | 4.0 |
| 5933880 | Kamloops 1 | 4.0 |
| 5939043 | Columbia-Shuswap E | 4.0 |
| 5941009 | Williams Lake | 4.0 |
| 5941027 | Cariboo I | 4.0 |
| 5903004 | Creston | 3.9 |
| 5903060 | Central Kootenay K | 3.9 |
| 5909009 | Hope | 3.9 |
| 5915004 | Surrey | 3.9 |
| 5955021 | Peace River D | 3.9 |
| 5901003 | Elkford | 3.8 |
| 5907009 | Keremeos | 3.8 |
| 5933037 | Thompson | 3.8 |
| 5933068 | Thompson | 3.8 |
| 5937022 | North Okanagan D | 3.8 |
| 5941012 | Cariboo E | 3.8 |
| 5941015 | Cariboo G | 3.8 |
| 5953033 | Mackenzie | 3.8 |
| 5905032 | Grand Forks | 3.7 |
| 5907802 | Osoyoos 1 | 3.7 |
| 5909032 | Kent | 3.7 |
| 5937801 | Okanagan (Part) 1 | 3.7 |
| 5941014 | Cariboo F | 3.7 |
| 5945012 | Central Coast D | 3.7 |
| 5951022 | Burns Lake | 3.7 |
| 5953038 | Fraser-Fort George A | 3.7 |
| 5905042 | Greenwood | 3.6 |
| 5909060 | Fraser Valley F | 3.6 |
| 5909884 | Skowkale | 3.6 |
| 5933060 | Thompson | 3.6 |
| 5939039 | ColumbiaShuswap D | 3.6 |
| 5941017 | Cariboo L | 3.6 |
| 5943023 | Port Hardy | 3.6 |
| 5953048 | Fraser-Fort George F | 3.6 |
| 5933028 | Clinton | 3.5 |
| 5955003 | Tumbler Ridge | 3.5 |
| 5955010 | Chetwynd | 3.5 |
| 5909821 | Kwawkwawapilt 6 | 3.4 |
| 5909830 | Tzeachten 13 | 3.4 |
| 5929803 | Sechelt (Part) | 3.4 |
| 5933067 | Clearwater | 3.4 |
| 5937802 | Enderby 2 | 3.4 |
| 5941021 | Cariboo B | 3.4 |
| 5943017 | Port Alice | 3.4 |
| 5951017 | Bulkley-Nechako D | 3.4 |
| 5905052 | Kootenay Boundary D / Rural Grand Forks | 3.3 |
| 5907024 | Princeton | 3.3 |
| 5909062 | Fraser Valley G | 3.3 |
| 5915825 | Matsqui 4 | 3.3 |
| 5933035 | Logan Lake | 3.3 |
| 5933806 | Nicola Lake 1 | 3.3 |
| 5937024 | Spallumcheen | 3.3 |
| 5937028 | Armstrong | 3.3 |
| 5941039 | Cariboo J | 3.3 |
| 5943008 | Alert Bay | 3.3 |
| 5953044 | Fraser-Fort George D | 3.3 |
| 5955005 | Pouce Coupe | 3.3 |
| 5905037 | Midway | 3.2 |
| 5937005 | Lumby | 3.2 |
| 5941013 | Quesnel | 3.2 |
| 5947007 | Port Edward | 3.2 |
| 5951015 | Bulkley-Nechako C | 3.2 |
| 5951028 | Bulkley-Nechako B | 3.2 |
| 5901006 | Sparwood | 3.1 |
| 5901806 | Shuswap | 3.1 |
| 5933024 | Cache Creek | 3.1 |
| 5933054 | Chase | 3.1 |
| 5941019 | Cariboo A | 3.1 |
| 5951009 | Fraser Lake | 3.1 |
| 5924039 | Sayward | 3.0 |
| 5933072 | Thompson | 3.0 |
| 5935801 | Duck Lake 7 | 3.0 |
| 5951019 | Bulkley-Nechako F | 3.0 |
| 5951032 | Granisle | 3.0 |
| 5909034 | Fraser Valley D | 2.9 |
| 5909880 | Lakahahmen 11 | 2.9 |
| 5933801 | Coldwater 1 | 2.9 |
| 5933807 | Nicola Mameet 1 | 2.9 |
| 5947804 | Skidegate 1 | 2.9 |
| 5959007 | Northern Rockies | 2.9 |
| 5905005 | Fruitvale | 2.8 |
| 5905014 | Trail | 2.8 |
| 5943012 | Port McNeill | 2.8 |
| 5953046 | Fraser-Fort George E | 2.8 |
| 5955023 | Peace River E | 2.8 |
| 5903013 | Central Kootenay B | 2.7 |
| 5937023 | North Okanagan E | 2.7 |
| 5943033 | Mount Waddington D | 2.7 |
| 5949812 | Gitanmaax 1 | 2.7 |
| 5953050 | Fraser-Fort George G | 2.7 |
| 5915807 | Mission 1 | 2.6 |
| 5931026 | Lillooet | 2.6 |
| 5933032 | Thompson | 2.6 |
| 5951031 | Bulkley-Nechako E | 2.6 |
| 5937033 | Enderby | 2.5 |
| 5939811 | Switsemalph | 2.4 |
| 5941026 | Cariboo C | 2.4 |
| 5951053 | Bulkley-Nechako G | 2.4 |
| 5955025 | Hudson's Hope | 2.4 |
| 5959806 | Fort Nelson 2 | 2.4 |
| 5909016 | Fraser Valley B | 2.3 |
| 5933074 | Barriere | 2.3 |
| 5943815 | Kippase 2 | 2.3 |
| 5905026 | Kootenay Boundary A | 2.2 |
| 5909877 | Upper Sumas 6 | 2.2 |
| 5909881 | Skweahm 10 | 2.2 |
| 5943806 | Tsulquate 4 | 2.2 |
| 5909827 | Soowahlie 14 | 2.1 |
| 5907055 | Okanagan-Similkameen H | 2.0 |
| 5921805 | Nanoose | 2.0 |
| 5949803 | Kitamaat 2 | 2.0 |
| 5951034 | Houston | 2.0 |
| 5955807 | Fort Ware 1 | 2.0 |
| 5955808 | Halfway River 168 | 2.0 |
| 5917801 | Cole Bay 3 | 1.9 |
| 5931821 | Lillooet 1 | 1.8 |
| 5933898 | Neskonlith | 1.8 |
| 5939805 | Quaaout 1 | 1.8 |
| 5951013 | Fort St. James | 1.8 |
| 5955040 | Peace River B | 1.8 |
| 5923816 | Tsahaheh 1 | 1.7 |
| 5926801 | Comox 1 | 1.7 |
| 5945801 | Bella Bella 1 | 1.7 |
| 5924812 | Quinsam 12 | 1.6 |
| 5949804 | Kitsumkaylum 1 | 1.6 |
| 5951809 | Stony Creek 1 | 1.6 |
| 5905009 | Montrose | 1.5 |
| 5909856 | Langley 2 | 1.5 |
| 5909879 | Holachten 8 | 1.5 |
| 5921804 | Nanaimo Town 1 | 1.3 |
| 5923808 | Marktosis 15 | 1.3 |
| 5951810 | Tache 1 | 1.3 |
| 5919822 | Cowichan | 1.0 |
| 5924804 | Campbell River 11 | 1.0 |
| 5947809 | Lax Kw'alaams 1 | 0.8 |
| 5949035 | Nisga'a | 0.8 |
| 5917804 | South Saanich 1 | 0.7 |
| 5909832 | Seabird Island | 0.6 |
| 5919804 | Chemainus 13 | 0.6 |
| 5945802 | Bella Coola 1 | 0.5 |
| 5931843 | Mount Currie | 0.4 |
| 5901801 | Tobacco Plains 2 | 0.0 |
| 5901803 | Kootenay 1 | 0.0 |
| 5901804 | Columbia Lake 3 | 0.0 |
| 5903807 | Creston 1 | 0.0 |
| 5907801 | Lower Similkameen 2 | 0.0 |
| 5907805 | Chopaka 7 & 8 | 0.0 |
| 5907807 | Chuchuwayha 2 | 0.0 |
| 5907809 | Ashnola 10 | 0.0 |
| 5909804 | Chawathil 4 | 0.0 |
| 5909806 | Kopchitchin 2 | 0.0 |
| 5909807 | Ohamil 1 | 0.0 |
| 5909810 | Lukseetsissum 9 | 0.0 |
| 5909812 | Schkam 2 | 0.0 |
| 5909816 | Spuzzum 1 | 0.0 |
| 5909824 | Skwah 4 | 0.0 |
| 5909826 | Skway 5 | 0.0 |
| 5909831 | Yakweakwioose 12 | 0.0 |
| 5909835 | Aitchelitch 9 | 0.0 |
| 5909837 | Cheam 1 | 0.0 |
| 5909839 | Chehalis 5 | 0.0 |
| 5909841 | Stullawheets 8 | 0.0 |
| 5909842 | Douglas 8 | 0.0 |
| 5909875 | Q'alatkú7em | 0.0 |
| 5909876 | Albert Flat 5 | 0.0 |
| 5909878 | Matsqui Main 2 | 0.0 |
| 5909882 | Squawkum Creek 3 | 0.0 |
| 5909885 | Squiaala | 0.0 |
| 5915801 | Semiahmoo | 0.0 |
| 5915805 | Coquitlam 1 | 0.0 |
| 5915811 | Seymour Creek 2 | 0.0 |
| 5915816 | McMillan Island 6 | 0.0 |
| 5915830 | Katzie 1 | 0.0 |
| 5917802 | Union Bay 4 | 0.0 |
| 5917811 | Esquimalt | 0.0 |
| 5919801 | Halalt 2 | 0.0 |
| 5919803 | Tsussie 6 | 0.0 |
| 5919809 | Penelakut Island 7 | 0.0 |
| 5919814 | Malachan 11 | 0.0 |
| 5919815 | Malahat 11 | 0.0 |
| 5919816 | Oyster Bay 12 | 0.0 |
| 5919818 | Theik 2 | 0.0 |
| 5921806 | Qualicum | 0.0 |
| 5921807 | Nanaimo River | 0.0 |
| 5923801 | Ahahswinis 1 | 0.0 |
| 5923807 | Ittatsoo 1 | 0.0 |
| 5923813 | Opitsat 1 | 0.0 |
| 5924806 | Houpsitas 6 | 0.0 |
| 5924817 | Cape Mudge 10 | 0.0 |
| 5924820 | Tork 7 | 0.0 |
| 5924835 | Tsa Xana 18 | 0.0 |
| 5924836 | Ehatis 11 | 0.0 |
| 5924840 | Homalco 9 | 0.0 |
| 5931802 | Kowtain 17 | 0.0 |
| 5931807 | Stawamus 24 | 0.0 |
| 5931808 | Waiwakum 14 | 0.0 |
| 5931812 | Nesuch 3 | 0.0 |
| 5931813 | Bridge River 1 | 0.0 |
| 5931814 | Cayoosh Creek 1 | 0.0 |
| 5931815 | Chilhil 6 | 0.0 |
| 5931816 | Fountain 1 | 0.0 |
| 5931828 | Pashilqua 2 | 0.0 |
| 5931829 | Pavilion 1 | 0.0 |
| 5931831 | Slosh 1 | 0.0 |
| 5931842 | Fountain 1B | 0.0 |
| 5931844 | Nequatque | 0.0 |
| 5933802 | Douglas Lake 3 | 0.0 |
| 5933805 | Joeyaska 2 | 0.0 |
| 5933808 | Nooaitch 10 | 0.0 |
| 5933812 | Bonaparte 3 | 0.0 |
| 5933814 | Canoe Creek 1 | 0.0 |
| 5933817 | Skeetchestn | 0.0 |
| 5933821 | Canoe Creek 2 | 0.0 |
| 5933832 | Klickkumcheen 18 | 0.0 |
| 5933833 | Inkluckcheen | 0.0 |
| 5933836 | Lower Hat Creek 2 | 0.0 |
| 5933844 | Ashcroft 4 | 0.0 |
| 5933849 | Siska Flat | 0.0 |
| 5933853 | Nuuautin 2 | 0.0 |
| 5933859 | Shackan 11 | 0.0 |
| 5933872 | Marble Canyon 3 | 0.0 |
| 5933873 | Stryen 9 | 0.0 |
| 5933877 | Whispering Pines 4 | 0.0 |
| 5933884 | Sahhaltkum 4 | 0.0 |
| 5933887 | North Thompson 1 | 0.0 |
| 5933896 | Nekliptum 1 | 0.0 |
| 5939801 | Chum Creek 2 | 0.0 |
| 5939802 | Hustalen 1 | 0.0 |
| 5939803 | North Bay 5 | 0.0 |
| 5939804 | Okanagan (Part) 1 | 0.0 |
| 5939808 | Switsemalph 3 | 0.0 |
| 5941801 | Alkali Lake 1 | 0.0 |
| 5941805 | Deep Creek 2 | 0.0 |
| 5941806 | Dog Creek 1 | 0.0 |
| 5941809 | Quesnel 1 | 0.0 |
| 5941812 | Williams Lake 1 | 0.0 |
| 5941821 | Anahim's Flat 1 | 0.0 |
| 5941837 | Nazco 20 | 0.0 |
| 5941839 | Redstone Flat 1 | 0.0 |
| 5941840 | Squinas 2 | 0.0 |
| 5941841 | Stone 1 | 0.0 |
| 5941850 | Toosey 1 | 0.0 |
| 5941880 | Ulkatcho 14A | 0.0 |
| 5943813 | Quaee 7 | 0.0 |
| 5943816 | Quatsino Subdivision 18 | 0.0 |
| 5943837 | Alert Bay | 0.0 |
| 5945803 | Katit 1 | 0.0 |
| 5947802 | Kulkayu (Hartley Bay) 4A | 0.0 |
| 5947803 | Masset 1 | 0.0 |
| 5947806 | Kulkayu (Hartley Bay) 4 | 0.0 |
| 5947807 | Dolphin Island 1 | 0.0 |
| 5947823 | Tlaa Gaa Aawtlaas 28 | 0.0 |
| 5949802 | Kitasoo 1 | 0.0 |
| 5949807 | Kulspai 6 | 0.0 |
| 5949810 | Coryatsaqua (Moricetown) 2 | 0.0 |
| 5949811 | Hagwilget 1 | 0.0 |
| 5949813 | Kispiox 1 | 0.0 |
| 5949814 | Gitsegukla 1 | 0.0 |
| 5949815 | Gitanyow 1 | 0.0 |
| 5949816 | Gitwangak 1 | 0.0 |
| 5949817 | Moricetown 1 | 0.0 |
| 5949819 | Babine 17 | 0.0 |
| 5949820 | Bulkley River 19 | 0.0 |
| 5949832 | Iskut 6 | 0.0 |
| 5949843 | Guhthe Tah 12 | 0.0 |
| 5949844 | Kitselas 1 | 0.0 |
| 5949845 | Dease Lake 9 | 0.0 |
| 5949847 | Telegraph Creek | 0.0 |
| 5951801 | Ye Koo Che 3 | 0.0 |
| 5951802 | Nautley (Fort Fraser) 1 | 0.0 |
| 5951803 | Nak'azdli | 0.0 |
| 5951805 | Binche 2 | 0.0 |
| 5951807 | Stellaquo (Stella) 1 | 0.0 |
| 5951818 | Cheslatta 1 | 0.0 |
| 5951820 | Palling 1 | 0.0 |
| 5951827 | Woyenne 27 | 0.0 |
| 5951828 | Babine 6 | 0.0 |
| 5951829 | Babine 25 | 0.0 |
| 5951848 | North Tacla Lake | 0.0 |
| 5953801 | Fort George 2 | 0.0 |
| 5953802 | McLeod Lake 1 | 0.0 |
| 5955801 | East Moberly Lake 169 | 0.0 |
| 5955802 | West Moberly Lake 168A | 0.0 |
| 5955803 | Blueberry River 205 | 0.0 |
| 5955804 | Doig River 206 | 0.0 |
| 5957803 | Five Mile Point 3 | 0.0 |
| 5959810 | Prophet River 4 | 0.0 |
|
||
- In 2021, in 350 of British Columbia’s 537 municipalities,Note less than 5% of the population could have a conversation in French. Conversely, in 39 municipalities, 10% or more of the population knew French.
- The municipalities with a population of more than 500 that had the highest proportion of people who could have a conversation in French were in the Squamish-Lillooet regional district, just north of Vancouver: Pemberton (18.9%), Squamish-Lillooet C (16.8%) and Whistler (15.9%).
- The municipalities that had the highest number of people who knew French were in the Vancouver census metropolitain area (CMA): Vancouver (61,400), Surrey (22,005) and Burnaby (12,135).
French as the first official language spoken
Data table for Chart 2
| First official language spoken | 1991 | 1996 | 2001 | 2006 | 2011 | 2016 | 2021 |
|---|---|---|---|---|---|---|---|
| number | |||||||
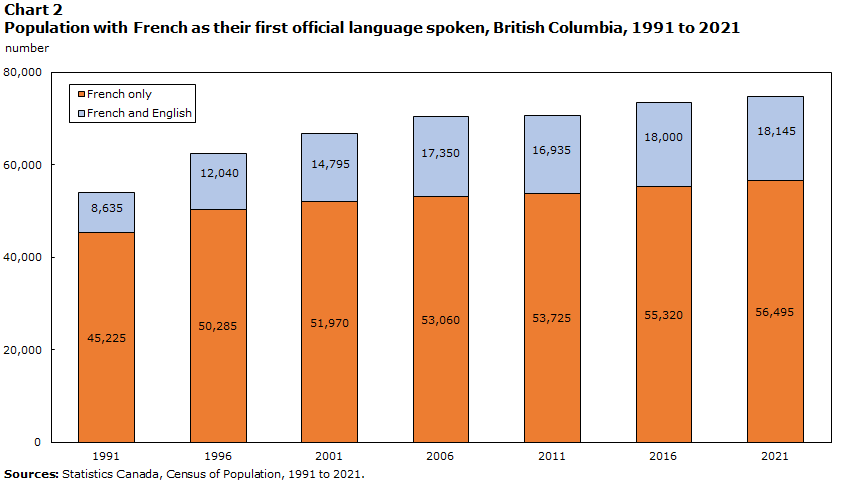
| French only | 45,225 | 50,285 | 51,970 | 53,060 | 53,725 | 55,320 | 56,495 |
| French and English | 8,635 | 12,040 | 14,795 | 17,350 | 16,935 | 18,000 | 18,145 |
| Sources: Statistics Canada, Census of Population, 1991 to 2021. | |||||||
- In 2021, 56,495 British Columbians (1.1% of the population) had French as their only first official language spoken and 18,145 residents (0.4% of the population) had French and English as their first official languages spoken.
- The number of people with French as their only first official language spoken has increased steadily since 1991 (+11,270) to reach an all-time high in 2021. However, the demographic weight of this population fell from 1.4% to 1.1% during the same period.
- From 1991 to 2021, the number of British Columbians who had French and English as their first official languages spoken more than doubled, from 8,635 to 18,145.
French as a mother tongue

Data table for Chart 3
| Mother tongue | 1991 | 1996 | 2001 | 2006 | 2011 | 2016 | 2021 |
|---|---|---|---|---|---|---|---|
| number | |||||||
| French only | 48,835 | 53,035 | 54,400 | 54,745 | 57,280 | 57,425 | 57,420 |
| French in combination with other languages | 5,595 | 7,640 | 9,230 | 8,550 | 13,475 | 14,280 | 22,675 |
| Sources: Statistics Canada, Census of Population, 1991 to 2021. | |||||||
- In 2021, 80,095 British Columbians (1.6% of the population) had French as one of their mother tongues, up from 1991 (+25,655) and 2016 (+8,390). However, their demographic weight remained stable (from 1.7% in 1991 to 1.6% in 2021).
- In 2021, 71.7% of these residents (57,420 people) had French as their only mother tongue, while 28.3% (22,675 people) had French as their mother tongue along with other languages (mainly English).
- Among people who were married or in a common-law relationship and who had French as one of their mother tongues, just under a quarter (23.7%) were in a relationship with another person whose mother tongue is French.
French spoken at home

Data table for Chart 4
| Language spoken most often at home | 1991 | 1996 | 2001 | 2006 | 2011 | 2016 | 2021 |
|---|---|---|---|---|---|---|---|
| number | |||||||
| French predominantly | 12,120 | 14,085 | 14,480 | 15,325 | 16,685 | 16,800 | 17,250 |
| French equally with other languages | 4,980 | 5,175 | 5,030 | 4,660 | 7,755 | 9,870 | 9,270 |
| Sources: Statistics Canada, Census of Population, 1991 to 2021. | |||||||
- In 2021, 76,370 British Columbians (1.5% of the population) spoke French at least regularly at home.
- Of these, over a third (34.7%, or 26,520 people) spoke French most often at home, predominantly or equally with other languages. Their numbers rose from 1991 (+9,420), but have remained fairly stable since 2016 (-150).
- Moreover, 49,855 residents (65.3%) spoke French regularly at home as a secondary language while speaking another language more often (generally English).
- Among people with French as their mother tongue, alone or with other languages:
- Just under half (47.3%, or 37,900 people) spoke French at least regularly at home in 2021. However, this rate varied by age, ranging from 75.6% among those under age 15 to 36.3% among those aged 45 and older.
- Just over a quarter (27.2%, or 21,785 people) spoke French most often at home, predominantly or equally with other languages, up from 1991 (26.3%, or 14,335 people).
- Among residents of British Columbia whose mother tongue is not French, 38,470 (0.8%) spoke French regularly at home.
- The vast majority of these residents (87.7%, or 33,735 people) spoke French at home as a secondary language while speaking another language more often (generally English).
French used at work

Data table for Chart 5
| Language used most often at work | 2001 | 2006 | 2011 | 2016 | 2021 |
|---|---|---|---|---|---|
| number | |||||
| French predominantly | 3,685 | 4,710 | 4,725 | 5,210 | 5,585 |
| French equally with other languages | 2,220 | 2,995 | 2,935 | 4,065 | 2,240 |
|
Notes: Among workers who were employed during the census reference week. In 2021, changes were made to the census questions regarding languages used at work. Comparisons with previous cycles must therefore be made with caution. For more information, consult the Languages Reference Guide, Census of Population, 2021. Sources: Statistics Canada, Census of Population, 2001, 2006, 2016 and 2021, and the National Household Survey of 2011. |
|||||
- In 2021, 23,340 British Columbians used French at least regularly at work. This represents 1.0% of the province’s workers.Note
- In British Columbia, 7,825 people used French most often at work, predominantly or equally with other languages, accounting for 0.3% of the province’s workers.
- The number of workers who used French most often at work grew from 5,905 in 2001 to 9,270 in 2016. It then fell from 2016 to 2021 (-1,445).
- In 2021, among workers who used French at least regularly at work, most worked in educational services (7,570 people, or 32.4%), public administration (2,880 people, or 12.3%) or professional, scientific and technical services (2,110 people, or 9.0%).Note
- Among workers who spoke French most often at home, predominantly or equally with other languages, 38.1% also used French regularly at work in 2021.
- Most workers (55.6%) who used French regularly at work lived in the Vancouver CMA.
Instruction in French at the primary and secondary levels
- In 2021, 55,580 (6.3%) of the 884,130 children under 18 living in the province were eligibleNote for instruction in French at the primary and secondary levels.
- Nearly one in two eligible children (49.5%, or 27,520) lived in the Vancouver CMA.
- In British Columbia, 112,290 people attended or had already attended a regular French program in a French-language school in Canada, representing 2.4% of the population aged 5 and older.
- Of those who had never attended a French-language school, 248,170 (5.3%) had instead attended a French immersion program in an English-language school.
- Among school-aged childrenNote who were eligible for instruction in French, 23,960 (55.7%) were attending or had already attended a regular French program in a French-language school in Canada.
French among immigrants
- In 2021, the proportions of recentNote immigrants and establishedNote immigrants living in British Columbia who could have a conversation in French (3.9% and 4.3%, respectively) were lower than the proportion of the non-immigrant population (7.9%).
- The proportion of recent immigrants who spoke French at least regularly at home (1.9%) was higher than that of the non-immigrant population (1.6%), but the proportion for established immigrants was lower (1.2%).
- The proportion of immigrants who had French as their only first official language spoken (0.8%) was lower than that of the non-immigrant population (1.2%). However, the proportion of immigrants who had French and English as their first official languages spoken (0.7%) was higher than for the non-immigrant population (0.2%).
Mobility and birthplace of the French-speaking population
Data table for Chart 6
| Place of birth | Percent |
|---|---|
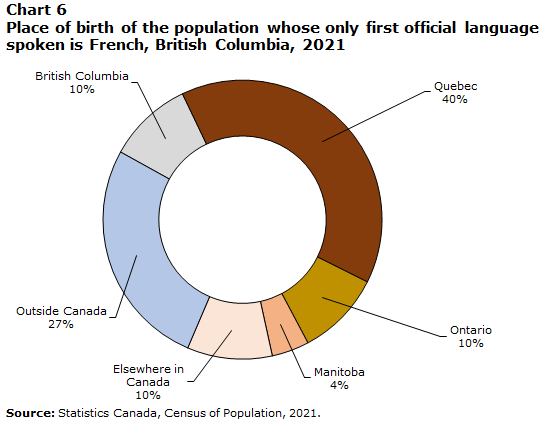
| British Columbia | 9.9 |
| Quebec | 40.2 |
| Ontario | 9.6 |
| Manitoba | 3.9 |
| Elsewhere in Canada | 9.9 |
| Outside Canada | 26.9 |
| Source: Statistics Canada, Census of Population, 2021. | |
- In 2021, among British Columbians whose only first official language spoken is French, nearly 1 in 10 (9.9%, or 5,440 people) were born in the province.
- Just under two-thirds (63.6%, or 35,070 people) were born in another province or territory, with the majority coming from Quebec (40.2%, or 22,180 people), Ontario (9.6%, or 5,300 people) or Manitoba (3.9%, or 2,140 people).
- More than a quarter (26.6%, or 14,650 people) were born abroad, mainly in metropolitan France (13.2%), Africa (5.9%) or Belgium (1.4%).
- From 2016 to 2021, the net interprovincial migration of the British Columbia population whose only first official language spoken is French was positive (+2,235).
- While 5,445 people with French as their only first official language spoken left British Columbia to settle in another province or territory from 2016 to 2021, 7,680 people moved to the province during the same period, with the majority coming from Quebec (54.1%), Ontario (20.6%) and Alberta (15.5%).
Appendix
| Indicator | 1991 | 1996 | 2001 | 2006 | 2011 | 2016 | 2021 |
|---|---|---|---|---|---|---|---|
| percent | |||||||
| French as first official language spokenTable 1 Note 1 | 1.7 | 1.7 | 1.7 | 1.7 | 1.6 | 1.6 | 1.5 |
| French only | 1.4 | 1.4 | 1.3 | 1.3 | 1.2 | 1.2 | 1.1 |
| French and English | 0.3 | 0.3 | 0.4 | 0.4 | 0.4 | 0.4 | 0.4 |
| Knowledge of FrenchTable 1 Note 2 | 6.4 | 6.8 | 7.0 | 7.3 | 6.9 | 6.9 | 6.6 |
| French only | 0.0 | 0.0 | 0.0 | 0.1 | 0.0 | 0.0 | 0.0 |
| French and English | 6.4 | 6.7 | 7.0 | 7.3 | 6.8 | 6.8 | 6.6 |
| French as mother tongue | 1.7 | 1.6 | 1.6 | 1.6 | 1.6 | 1.6 | 1.6 |
| French only | 1.5 | 1.4 | 1.4 | 1.3 | 1.3 | 1.2 | 1.2 |
| French in combination with other languages | 0.2 | 0.2 | 0.2 | 0.2 | 0.3 | 0.3 | 0.5 |
| French spoken most often at home | 0.5 | 0.5 | 0.5 | 0.5 | 0.6 | 0.6 | 0.5 |
| French predominantly | 0.4 | 0.4 | 0.4 | 0.4 | 0.4 | 0.4 | 0.3 |
| French equally with other languages | 0.2 | 0.1 | 0.1 | 0.1 | 0.2 | 0.2 | 0.2 |
| French used most often at workTable 1 Note 3 | Note ..: not available for a specific reference period | Note ..: not available for a specific reference period | 0.3 | 0.4 | 0.4 | 0.4 | 0.3 |
| French predominantly | Note ..: not available for a specific reference period | Note ..: not available for a specific reference period | 0.2 | 0.2 | 0.2 | 0.2 | 0.2 |
| French equally with other languages | Note ..: not available for a specific reference period | Note ..: not available for a specific reference period | 0.1 | 0.1 | 0.1 | 0.2 | 0.1 |
.. not available for a specific reference period
|
|||||||
| FrequencyTable 2 Note 2 | French used at workTable 2 Note 1 | French spoken at home | ||
|---|---|---|---|---|
| number | percent | number | percent | |
| Total population | 2,433,600 | 100.0 | 4,951,655 | 100.0 |
| Only | 2,585 | 0.1 | 11,050 | 0.2 |
| Mostly | 2,995 | 0.1 | 6,195 | 0.1 |
| Equally | 2,240 | 0.1 | 9,270 | 0.2 |
| Regularly | 15,515 | 0.6 | 49,855 | 1.0 |
| No mention | 2,410,260 | 99.0 | 4,875,285 | 98.5 |
|
||||
| Selection of industry sectors | Use of French at work | |||
|---|---|---|---|---|
| At least regularlyTable 3 Note 2 | Most often | |||
| number | percent | number | percent | |
| Total | 23,340 | 100.0 | 7,825 | 100.0 |
| Construction | 755 | 3.2 | 245 | 3.1 |
| Retail trade | 1,325 | 5.7 | 210 | 2.7 |
| Transportation and warehousing | 860 | 3.7 | 145 | 1.9 |
| Finance and insurance | 795 | 3.4 | 165 | 2.1 |
| Professional, scientific and technical services | 2,110 | 9.0 | 480 | 6.1 |
| Administrative and support, waste management and remediation services | 715 | 3.1 | 210 | 2.7 |
| Educational services | 7,570 | 32.4 | 4,550 | 58.1 |
| Health care and social assistance | 1,815 | 7.8 | 360 | 4.6 |
| Accommodation and food services | 810 | 3.5 | 165 | 2.1 |
| Public administration | 2,880 | 12.3 | 390 | 5.0 |
| Other sectors | 3,700 | 15.9 | 910 | 11.6 |
|
||||
| Age group | Mother tongue | |||||
|---|---|---|---|---|---|---|
| Total | FrenchTable 4 Note 1 | Other languages | ||||
| number | percent | number | percent | number | percent | |
| Total | 76,370 | 1.5 | 37,900 | 47.3 | 38,470 | 0.8 |
| 0 to 14 years | 16,920 | 2.4 | 6,380 | 75.6 | 10,545 | 1.5 |
| 15 to 44 years | 33,880 | 1.8 | 16,580 | 54.4 | 17,305 | 0.9 |
| 45 years and older | 25,565 | 1.1 | 14,940 | 36.3 | 10,630 | 0.5 |
|
||||||
| Immigration status and period of immigration | Knowledge of FrenchTable 5 Note 1 | French spoken at homeTable 5 Note 1 | First official language spoken | |||||
|---|---|---|---|---|---|---|---|---|
| French only | French and English | |||||||
| number | percent | number | percent | number | percent | number | percent | |
| Total | 327,350 | 6.7 | 73,875 | 1.5 | 55,150 | 1.1 | 17,725 | 0.4 |
| Non-immigrants | 261,500 | 7.9 | 52,895 | 1.6 | 41,250 | 1.2 | 6,160 | 0.2 |
| Immigrants | 60,185 | 4.2 | 18,415 | 1.3 | 11,900 | 0.8 | 10,325 | 0.7 |
| Recent immigrantsTable 5 Note 2 | 7,705 | 3.9 | 3,660 | 1.9 | 2,680 | 1.4 | 1,715 | 0.9 |
| Established immigrantsTable 5 Note 3 | 52,480 | 4.3 | 14,760 | 1.2 | 9,215 | 0.8 | 8,605 | 0.7 |
| 2011 to 2015 | 6,920 | 4.1 | 2,575 | 1.5 | 1,580 | 0.9 | 1,935 | 1.2 |
| 2001 to 2010 | 13,835 | 4.4 | 4,330 | 1.4 | 2,295 | 0.7 | 3,400 | 1.1 |
| 1991 to 2000 | 9,190 | 3.1 | 2,800 | 0.9 | 1,575 | 0.5 | 1,620 | 0.5 |
| 1980 to 1990 | 6,645 | 4.0 | 1,835 | 1.1 | 1,175 | 0.7 | 880 | 0.5 |
| Before 1980 | 15,890 | 5.7 | 3,230 | 1.2 | 2,590 | 0.9 | 770 | 0.3 |
| Non-permanent residents | 5,660 | 3.3 | 2,560 | 1.5 | 2,010 | 1.2 | 1,235 | 0.7 |
|
||||||||
| Census Metropolitan Area | Knowledge of FrenchTable 6 Note 1 | French spoken at homeTable 6 Note 1 | First official language spoken | |||||
|---|---|---|---|---|---|---|---|---|
| French only | French and English | |||||||
| number | percent | number | percent | number | percent | number | percent | |
| Total - Province | 328,650 | 6.6 | 76,370 | 1.5 | 56,495 | 1.1 | 18,145 | 0.4 |
| Vancouver | 172,050 | 6.6 | 43,115 | 1.6 | 25,925 | 1.0 | 14,255 | 0.5 |
| Victoria | 39,715 | 10.1 | 7,895 | 2.0 | 6,100 | 1.6 | 1,080 | 0.3 |
| Kelowna | 15,155 | 6.9 | 3,085 | 1.4 | 2,985 | 1.4 | 400 | 0.2 |
| Abbotsford - Mission | 8,350 | 4.3 | 1,875 | 1.0 | 1,230 | 0.6 | 520 | 0.3 |
| Nanaimo | 7,555 | 6.6 | 1,570 | 1.4 | 1,280 | 1.1 | 170 | 0.1 |
| Chilliwack | 4,855 | 4.3 | 1,040 | 0.9 | 1,000 | 0.9 | 145 | 0.1 |
| Kamloops | 6,010 | 5.4 | 1,095 | 1.0 | 965 | 0.9 | 115 | 0.1 |
|
||||||||
- Date modified: